Business Decision Making: Analyzing Survey Data and Reporting Trends
VerifiedAdded on 2024/05/30
|26
|4997
|86
Report
AI Summary
This report explores business decision-making through the analysis of survey data and trend identification. It begins with planning a survey to collect data from students, detailing the survey methodology and sampling frame used, including quantitative and qualitative approaches. The report then summarizes and analyzes the collected data using representative values such as arithmetic mean, median, and mode, and measures of dispersion. It explains the use of quartiles, percentiles, and the correlation coefficient to draw useful conclusions. The findings are presented with the aid of spreadsheets, producing graphs to illustrate trends over a three-year period using secondary data. Furthermore, the report discusses the role of software-generated information systems in supporting various levels of management, including their characteristics and roles in a business context. It applies financial tools for decision-making, advising a business on a potential investment project by calculating the Net Present Value (NPV) and Internal Rate of Return (IRR) to determine the project's viability. The study concludes by emphasizing the importance of adapting to technological changes and understanding evolving consumer behavior in the retail industry.
Business decision making
Paraphrase This Document
Need a fresh take? Get an instant paraphrase of this document with our AI Paraphraser
Table of Contents
Introduction................................................................................................................................3
Task 1.........................................................................................................................................3
Planning the survey....................................................................................................................3
a) Create a plan for collecting data from students across all campuses.....................................3
b) Present the survey methodology and sampling frame used...................................................4
Task 2.........................................................................................................................................9
Summarising and analysing the data..........................................................................................9
a) Summarise the data collected from the survey using representative values (arithmetic
mean, median and mode)...........................................................................................................9
b) Analyse the results of the survey and draw conclusions.....................................................10
c) Analyse the data using measures of dispersion (describe)...................................................10
d) Explain how you can use quartiles, percentiles and the correlation coefficient to draw
useful conclusions....................................................................................................................11
Task 3.......................................................................................................................................12
Presenting and reporting your findings....................................................................................12
a) With the aid of spreadsheets produce graphs to help draw valid conclusions on the survey
..................................................................................................................................................12
b) Create trend lines in spreadsheet graphs to show the level of impact over a minimum of 3
year period (this could be based on secondary data)................................................................19
Figure: Offline purchase decline..............................................................................................20
Online.......................................................................................................................................20
Figure: Online purchase decline..............................................................................................21
Task 4.......................................................................................................................................21
Software-generated information to make business decisions..................................................21
a) How do the following systems serve the various levels of management in a business? You
are to describe their characteristics and the roles they play in a business................................21
b) A publisher has just signed a contract for the publication of a book. What is the earliest
date that the book can be ready for distribution based on the following activities with time
estimates...................................................................................................................................22
c) Using financial tools for decision making advice a business planning on investing in a
project.......................................................................................................................................23
d) If the rate of finance at which the business can borrow is 10% calculate the NPV and
advice if it is worth considering this investment......................................................................23
e) Calculate the Internal Rate of Return (IRR) and explain the meaning of the result............24
Conclusion................................................................................................................................24
Reference list............................................................................................................................25
⊘ This is a preview!⊘
Do you want full access?
Subscribe today to unlock all pages.
Trusted by 1+ million students worldwide
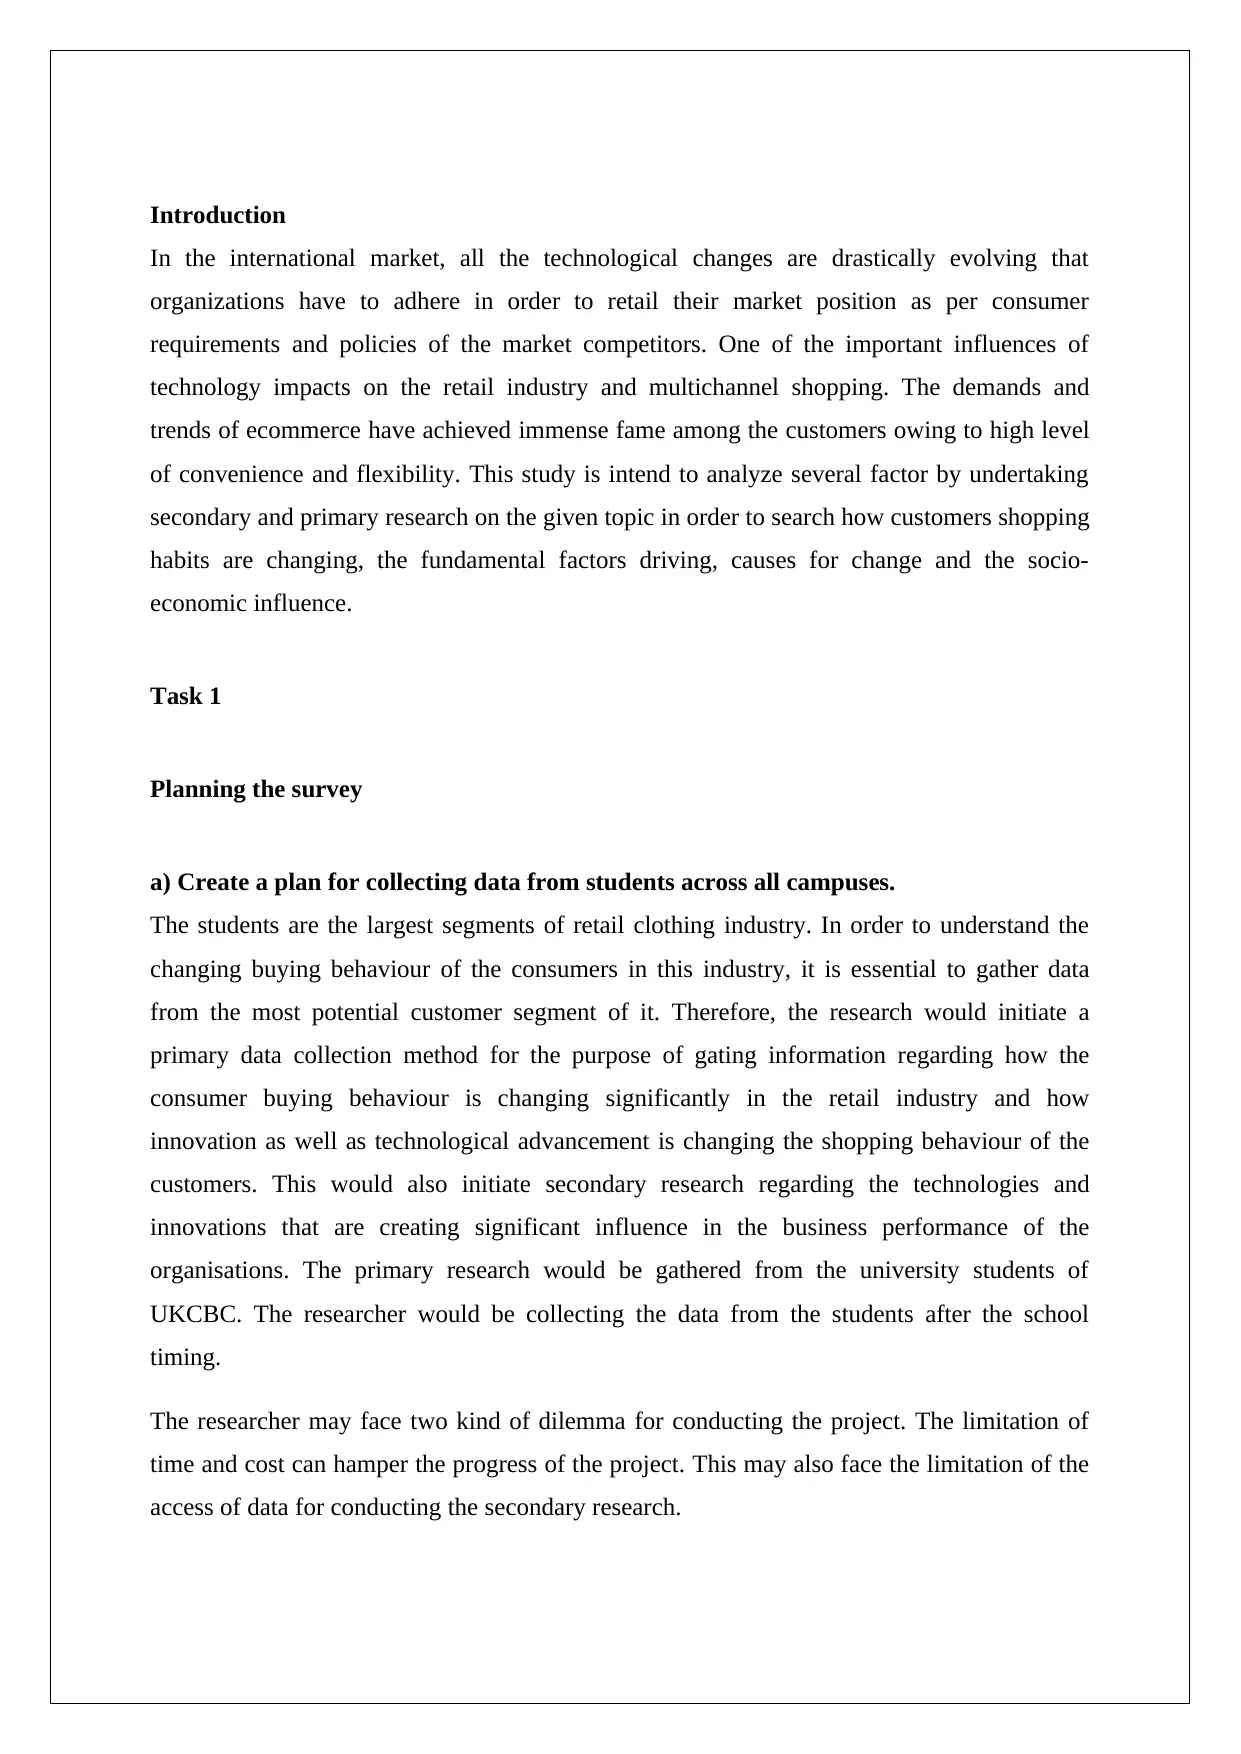
Introduction
In the international market, all the technological changes are drastically evolving that
organizations have to adhere in order to retail their market position as per consumer
requirements and policies of the market competitors. One of the important influences of
technology impacts on the retail industry and multichannel shopping. The demands and
trends of ecommerce have achieved immense fame among the customers owing to high level
of convenience and flexibility. This study is intend to analyze several factor by undertaking
secondary and primary research on the given topic in order to search how customers shopping
habits are changing, the fundamental factors driving, causes for change and the socio-
economic influence.
Task 1
Planning the survey
a) Create a plan for collecting data from students across all campuses.
The students are the largest segments of retail clothing industry. In order to understand the
changing buying behaviour of the consumers in this industry, it is essential to gather data
from the most potential customer segment of it. Therefore, the research would initiate a
primary data collection method for the purpose of gating information regarding how the
consumer buying behaviour is changing significantly in the retail industry and how
innovation as well as technological advancement is changing the shopping behaviour of the
customers. This would also initiate secondary research regarding the technologies and
innovations that are creating significant influence in the business performance of the
organisations. The primary research would be gathered from the university students of
UKCBC. The researcher would be collecting the data from the students after the school
timing.
The researcher may face two kind of dilemma for conducting the project. The limitation of
time and cost can hamper the progress of the project. This may also face the limitation of the
access of data for conducting the secondary research.
Paraphrase This Document
Need a fresh take? Get an instant paraphrase of this document with our AI Paraphraser
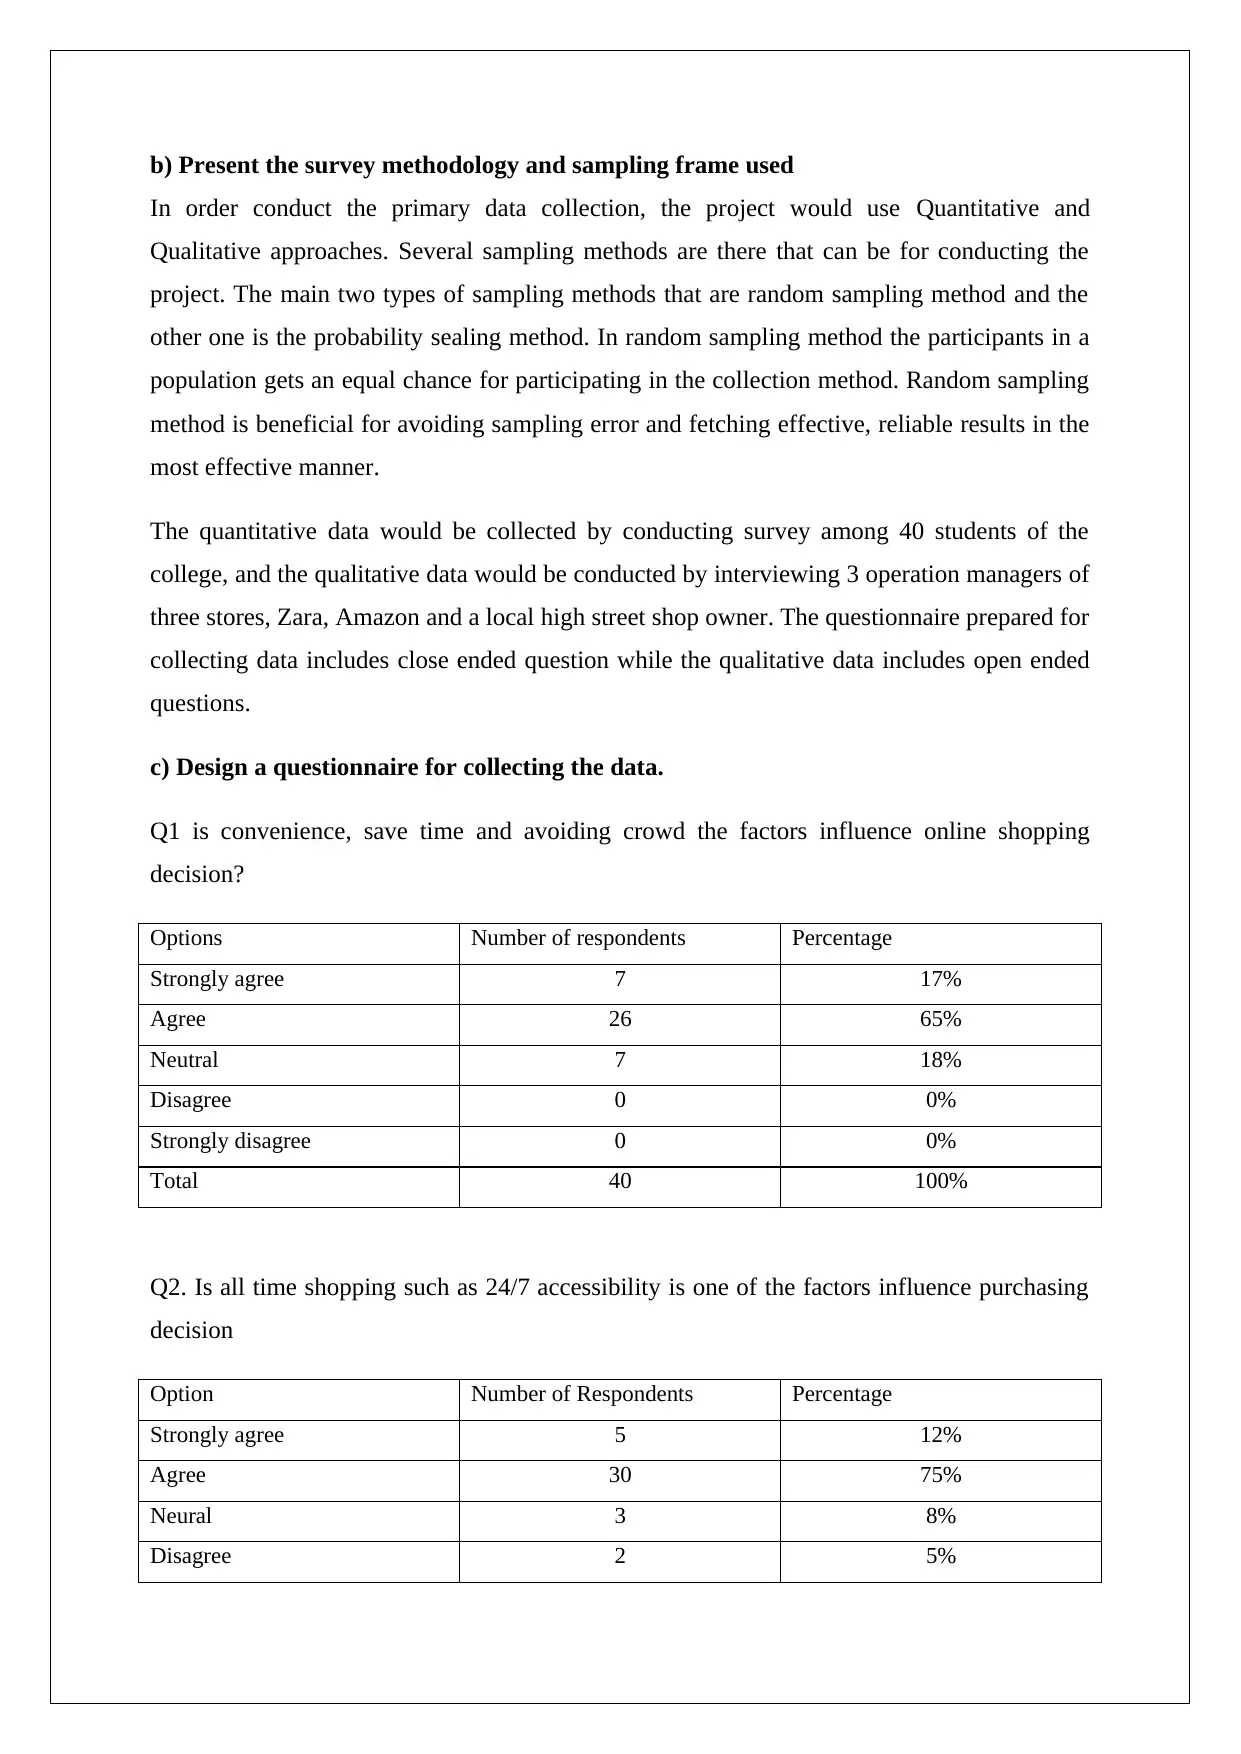
b) Present the survey methodology and sampling frame used
In order conduct the primary data collection, the project would use Quantitative and
Qualitative approaches. Several sampling methods are there that can be for conducting the
project. The main two types of sampling methods that are random sampling method and the
other one is the probability sealing method. In random sampling method the participants in a
population gets an equal chance for participating in the collection method. Random sampling
method is beneficial for avoiding sampling error and fetching effective, reliable results in the
most effective manner.
The quantitative data would be collected by conducting survey among 40 students of the
college, and the qualitative data would be conducted by interviewing 3 operation managers of
three stores, Zara, Amazon and a local high street shop owner. The questionnaire prepared for
collecting data includes close ended question while the qualitative data includes open ended
questions.
c) Design a questionnaire for collecting the data.
Q1 is convenience, save time and avoiding crowd the factors influence online shopping
decision?
Options Number of respondents Percentage
Strongly agree 7 17%
Agree 26 65%
Neutral 7 18%
Disagree 0 0%
Strongly disagree 0 0%
Total 40 100%
Q2. Is all time shopping such as 24/7 accessibility is one of the factors influence purchasing
decision
Option Number of Respondents Percentage
Strongly agree 5 12%
Agree 30 75%
Neural 3 8%
Disagree 2 5%
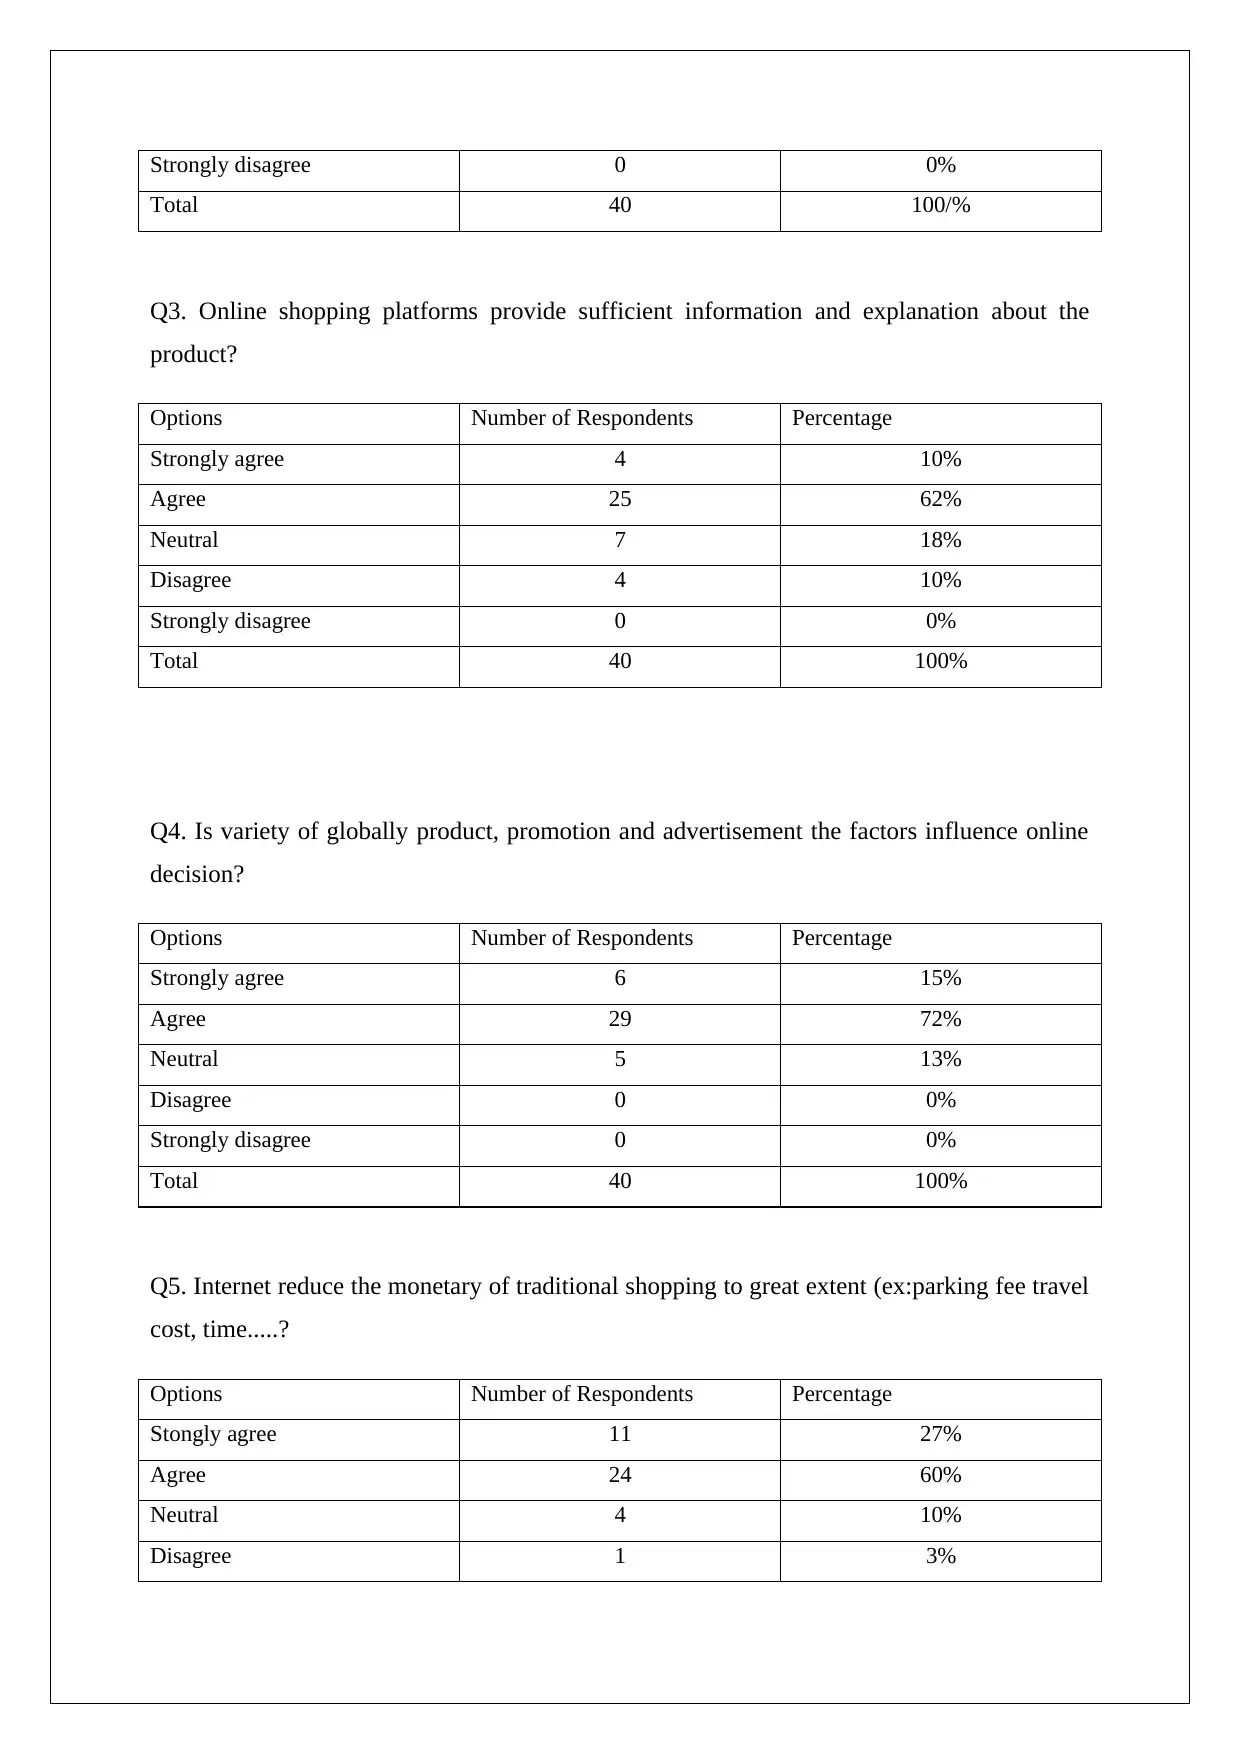
Strongly disagree 0 0%
Total 40 100/%
Q3. Online shopping platforms provide sufficient information and explanation about the
product?
Options Number of Respondents Percentage
Strongly agree 4 10%
Agree 25 62%
Neutral 7 18%
Disagree 4 10%
Strongly disagree 0 0%
Total 40 100%
Q4. Is variety of globally product, promotion and advertisement the factors influence online
decision?
Options Number of Respondents Percentage
Strongly agree 6 15%
Agree 29 72%
Neutral 5 13%
Disagree 0 0%
Strongly disagree 0 0%
Total 40 100%
Q5. Internet reduce the monetary of traditional shopping to great extent (ex:parking fee travel
cost, time.....?
Options Number of Respondents Percentage
Stongly agree 11 27%
Agree 24 60%
Neutral 4 10%
Disagree 1 3%
⊘ This is a preview!⊘
Do you want full access?
Subscribe today to unlock all pages.
Trusted by 1+ million students worldwide
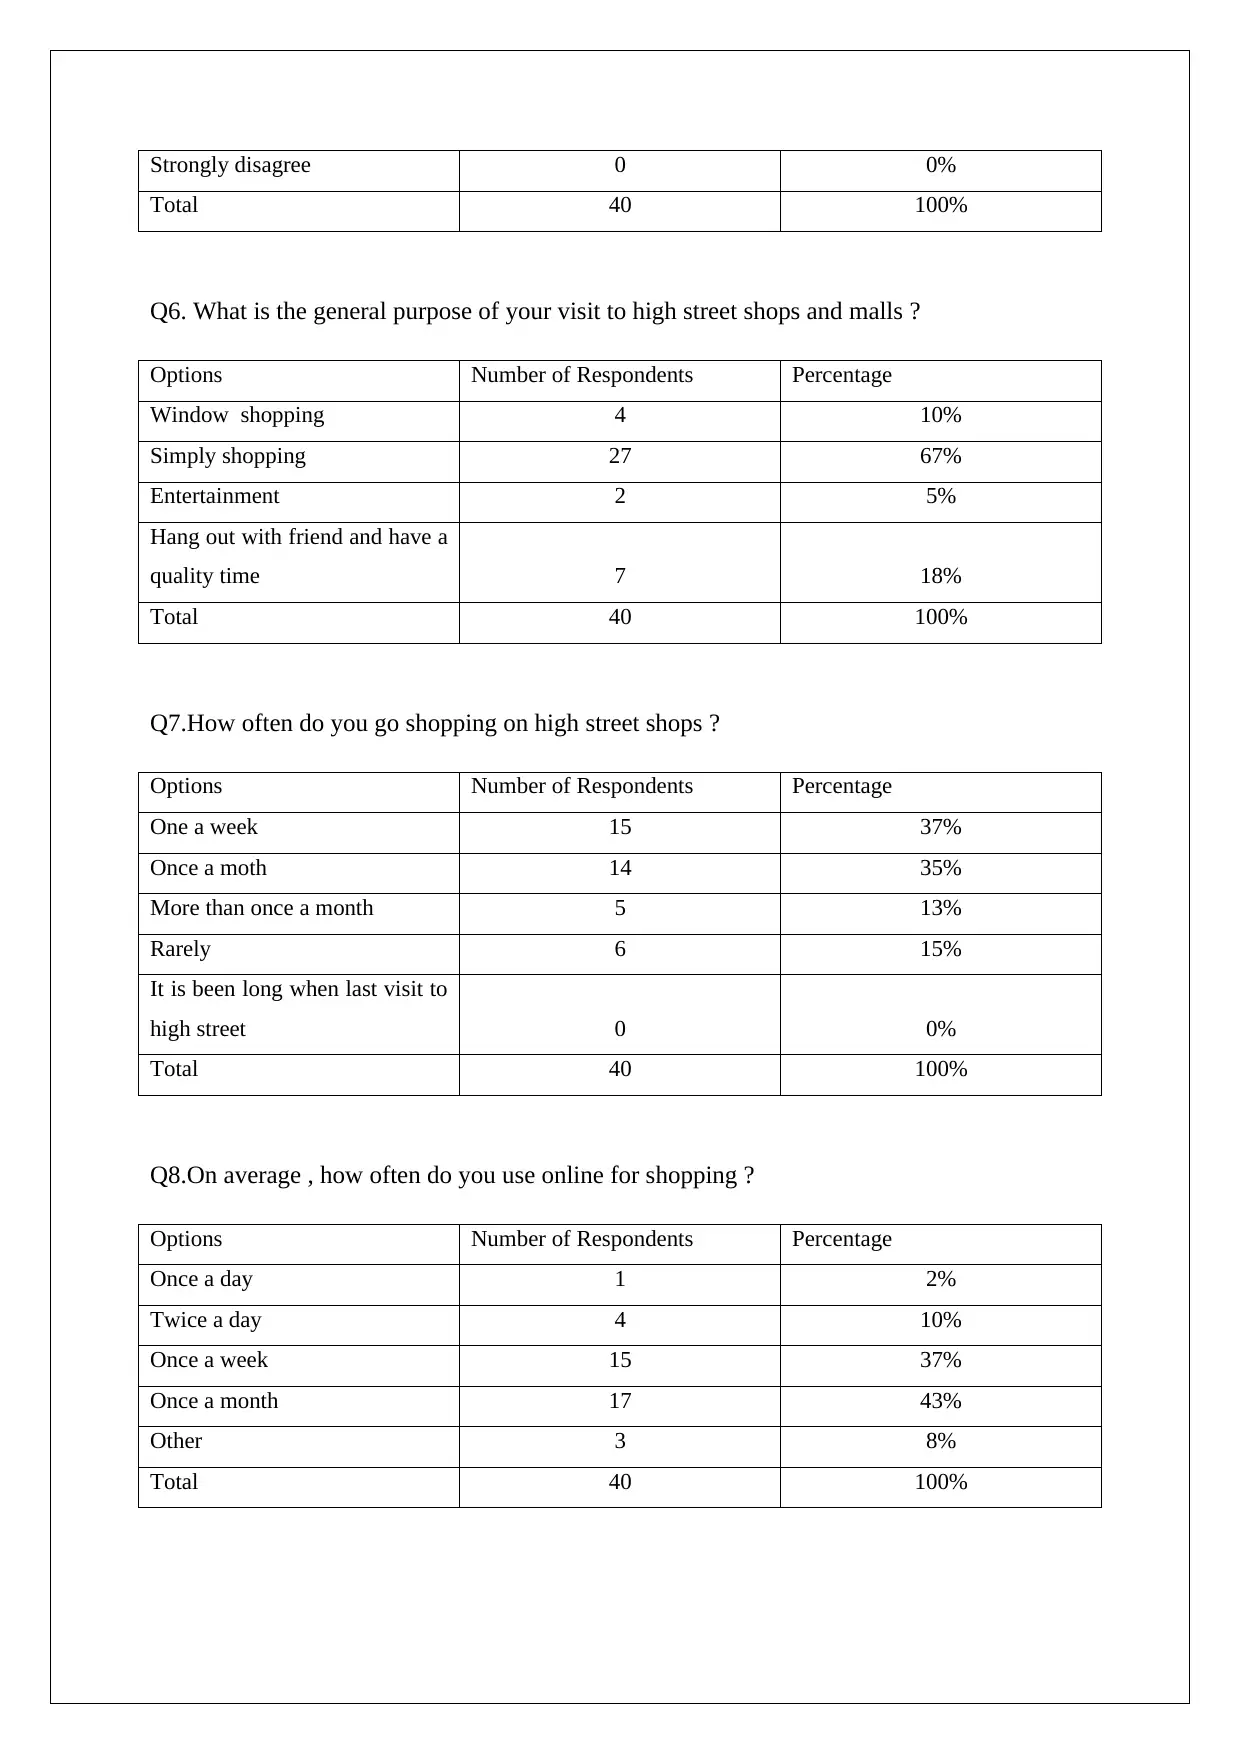
Strongly disagree 0 0%
Total 40 100%
Q6. What is the general purpose of your visit to high street shops and malls ?
Options Number of Respondents Percentage
Window shopping 4 10%
Simply shopping 27 67%
Entertainment 2 5%
Hang out with friend and have a
quality time 7 18%
Total 40 100%
Q7.How often do you go shopping on high street shops ?
Options Number of Respondents Percentage
One a week 15 37%
Once a moth 14 35%
More than once a month 5 13%
Rarely 6 15%
It is been long when last visit to
high street 0 0%
Total 40 100%
Q8.On average , how often do you use online for shopping ?
Options Number of Respondents Percentage
Once a day 1 2%
Twice a day 4 10%
Once a week 15 37%
Once a month 17 43%
Other 3 8%
Total 40 100%
Total 40 100%
Q6. What is the general purpose of your visit to high street shops and malls ?
Options Number of Respondents Percentage
Window shopping 4 10%
Simply shopping 27 67%
Entertainment 2 5%
Hang out with friend and have a
quality time 7 18%
Total 40 100%
Q7.How often do you go shopping on high street shops ?
Options Number of Respondents Percentage
One a week 15 37%
Once a moth 14 35%
More than once a month 5 13%
Rarely 6 15%
It is been long when last visit to
high street 0 0%
Total 40 100%
Q8.On average , how often do you use online for shopping ?
Options Number of Respondents Percentage
Once a day 1 2%
Twice a day 4 10%
Once a week 15 37%
Once a month 17 43%
Other 3 8%
Total 40 100%
Paraphrase This Document
Need a fresh take? Get an instant paraphrase of this document with our AI Paraphraser
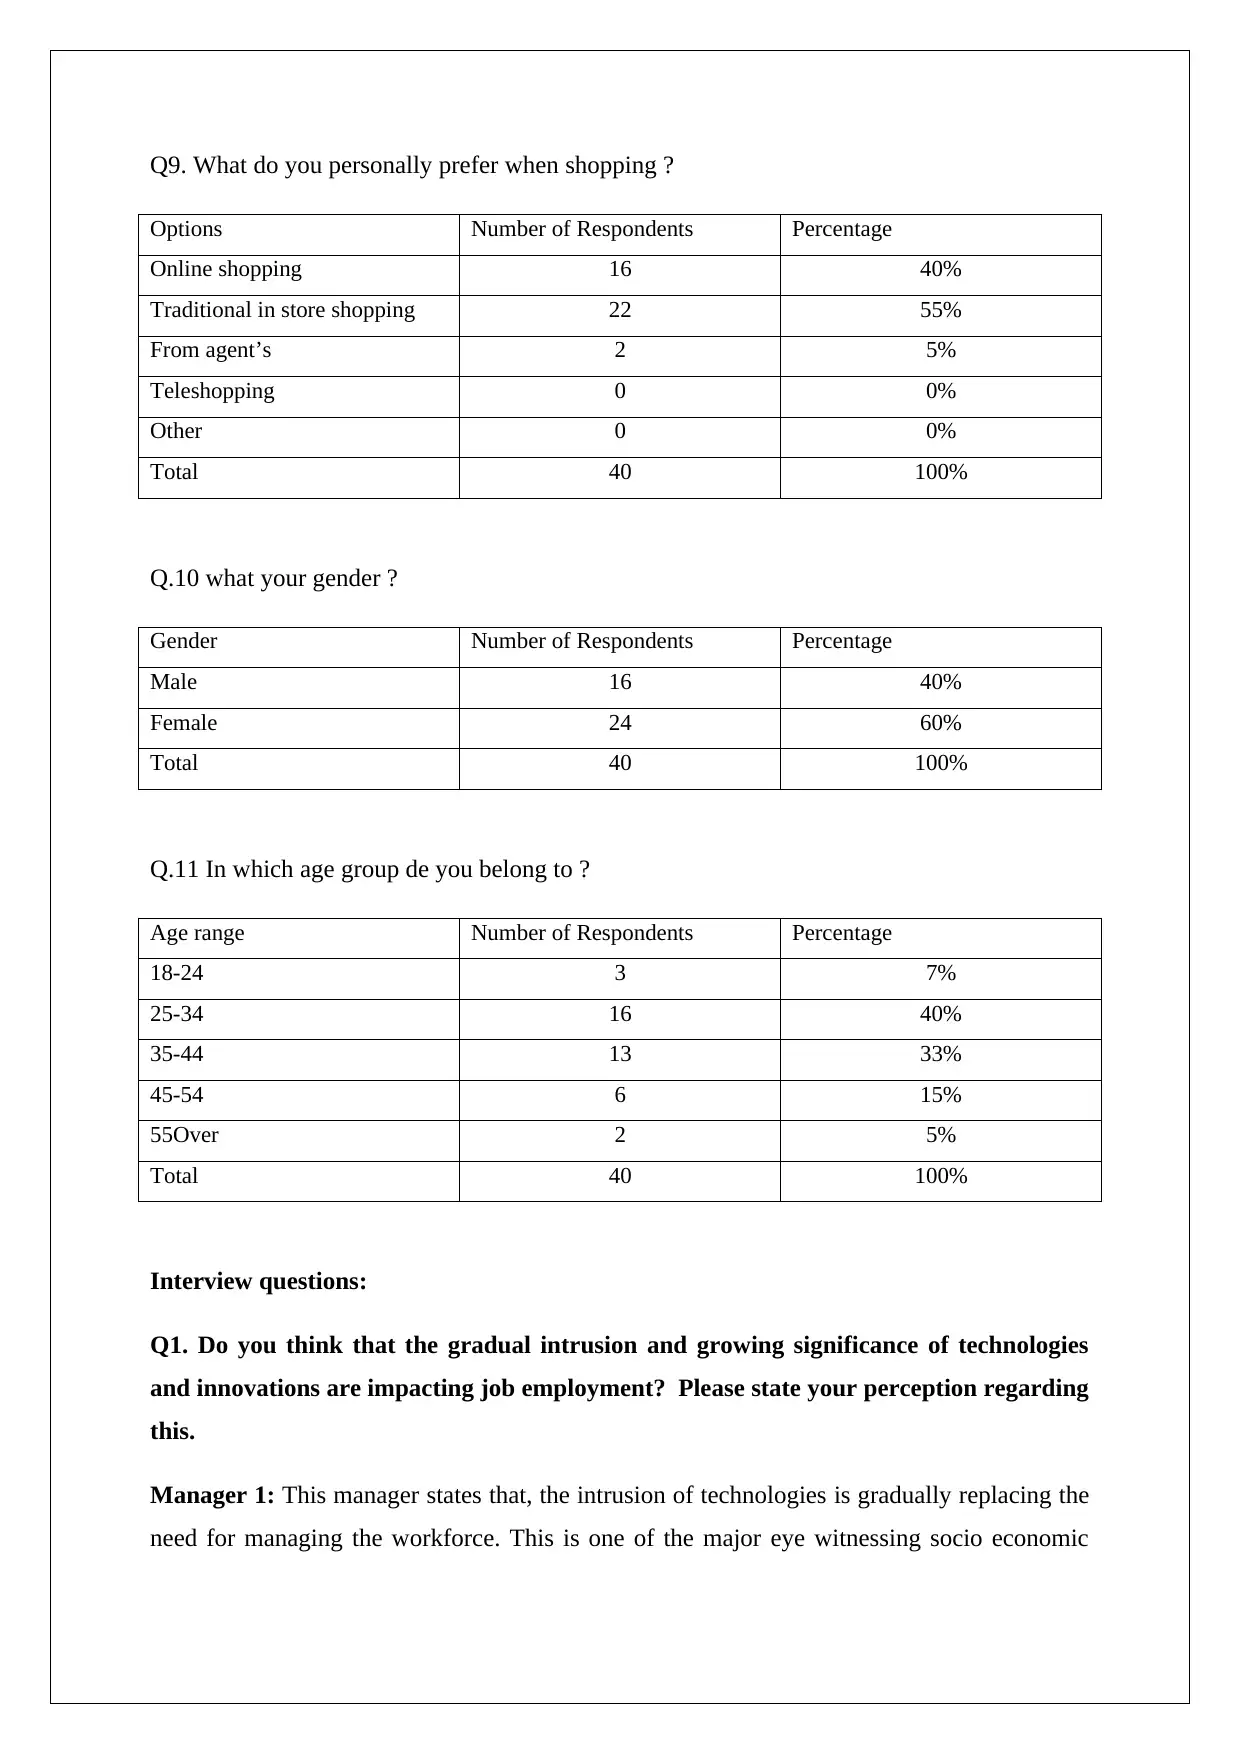
Q9. What do you personally prefer when shopping ?
Options Number of Respondents Percentage
Online shopping 16 40%
Traditional in store shopping 22 55%
From agent’s 2 5%
Teleshopping 0 0%
Other 0 0%
Total 40 100%
Q.10 what your gender ?
Gender Number of Respondents Percentage
Male 16 40%
Female 24 60%
Total 40 100%
Q.11 In which age group de you belong to ?
Age range Number of Respondents Percentage
18-24 3 7%
25-34 16 40%
35-44 13 33%
45-54 6 15%
55Over 2 5%
Total 40 100%
Interview questions:
Q1. Do you think that the gradual intrusion and growing significance of technologies
and innovations are impacting job employment? Please state your perception regarding
this.
Manager 1: This manager states that, the intrusion of technologies is gradually replacing the
need for managing the workforce. This is one of the major eye witnessing socio economic
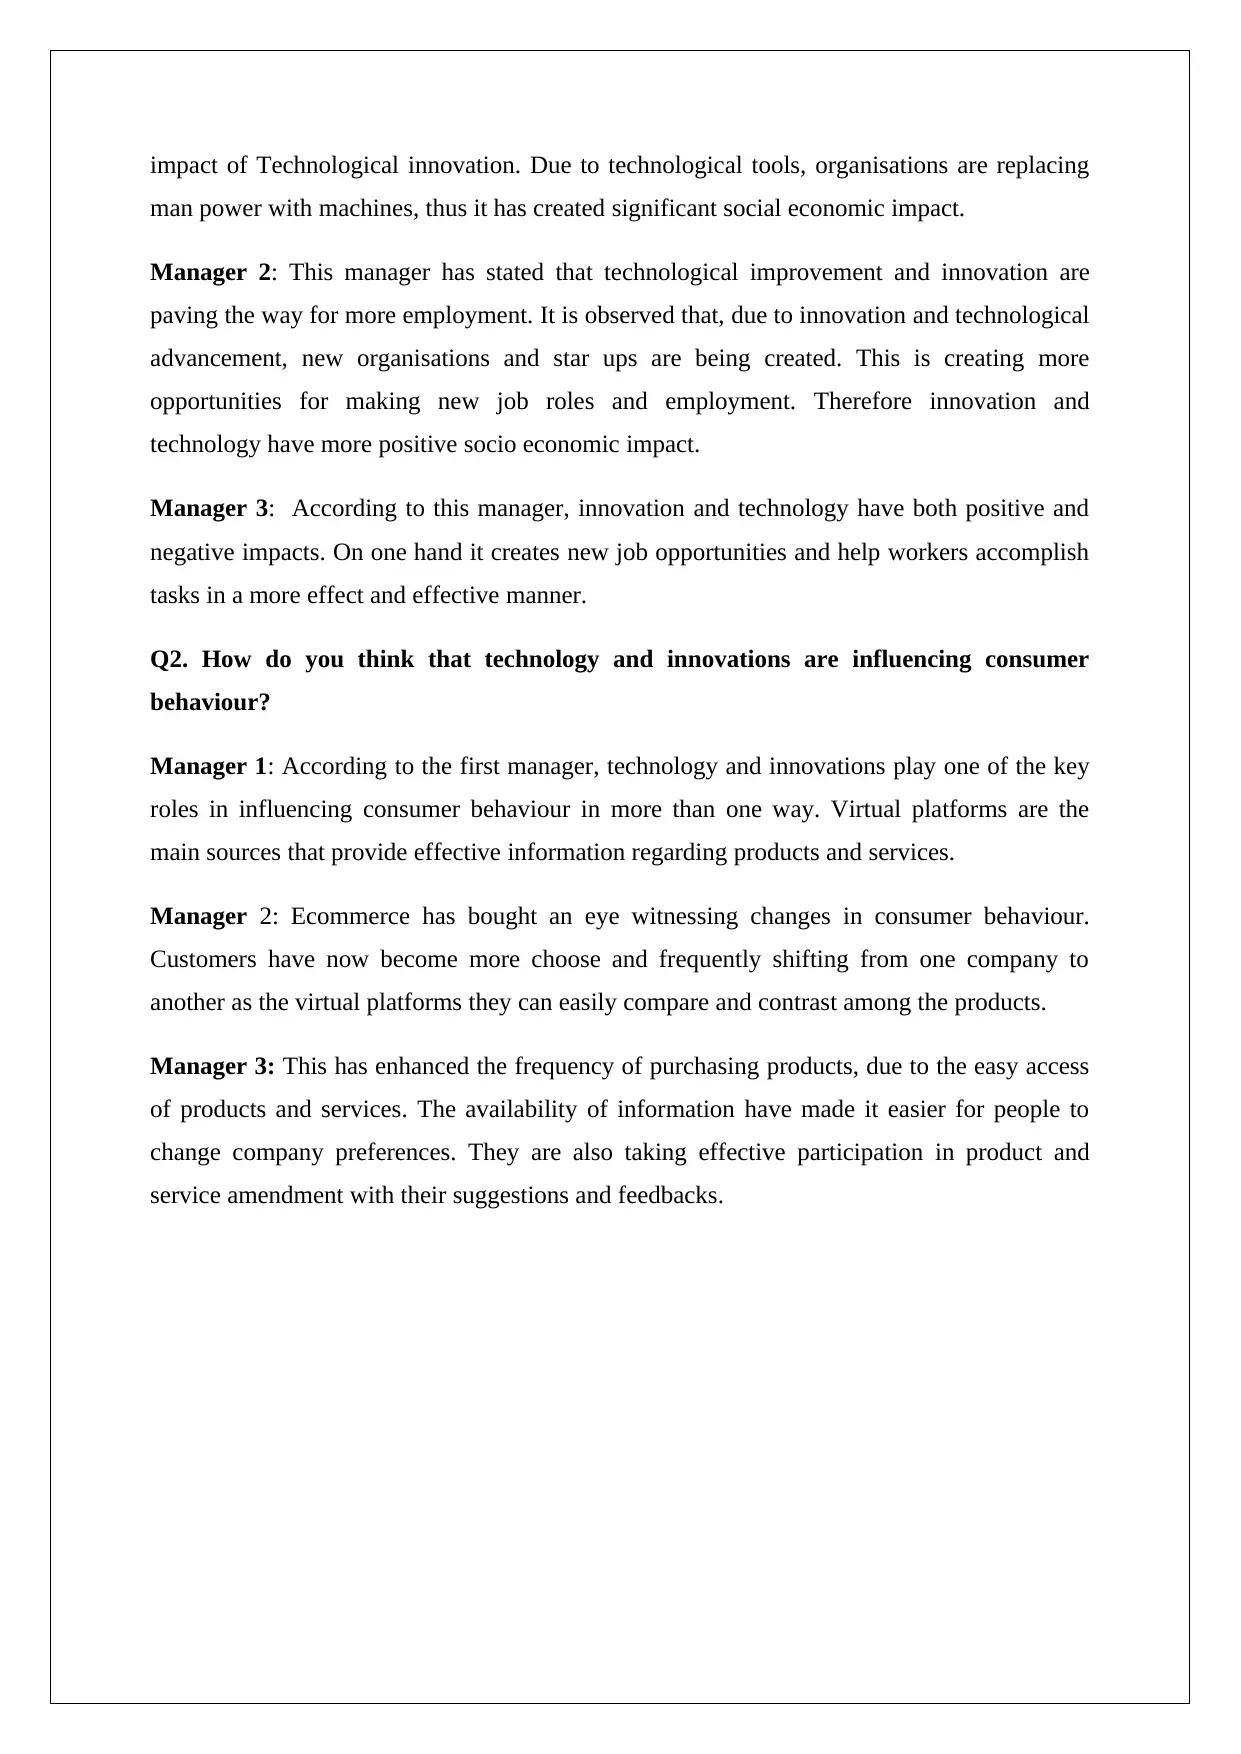
impact of Technological innovation. Due to technological tools, organisations are replacing
man power with machines, thus it has created significant social economic impact.
Manager 2: This manager has stated that technological improvement and innovation are
paving the way for more employment. It is observed that, due to innovation and technological
advancement, new organisations and star ups are being created. This is creating more
opportunities for making new job roles and employment. Therefore innovation and
technology have more positive socio economic impact.
Manager 3: According to this manager, innovation and technology have both positive and
negative impacts. On one hand it creates new job opportunities and help workers accomplish
tasks in a more effect and effective manner.
Q2. How do you think that technology and innovations are influencing consumer
behaviour?
Manager 1: According to the first manager, technology and innovations play one of the key
roles in influencing consumer behaviour in more than one way. Virtual platforms are the
main sources that provide effective information regarding products and services.
Manager 2: Ecommerce has bought an eye witnessing changes in consumer behaviour.
Customers have now become more choose and frequently shifting from one company to
another as the virtual platforms they can easily compare and contrast among the products.
Manager 3: This has enhanced the frequency of purchasing products, due to the easy access
of products and services. The availability of information have made it easier for people to
change company preferences. They are also taking effective participation in product and
service amendment with their suggestions and feedbacks.
⊘ This is a preview!⊘
Do you want full access?
Subscribe today to unlock all pages.
Trusted by 1+ million students worldwide
Task 2
Summarising and analysing the data
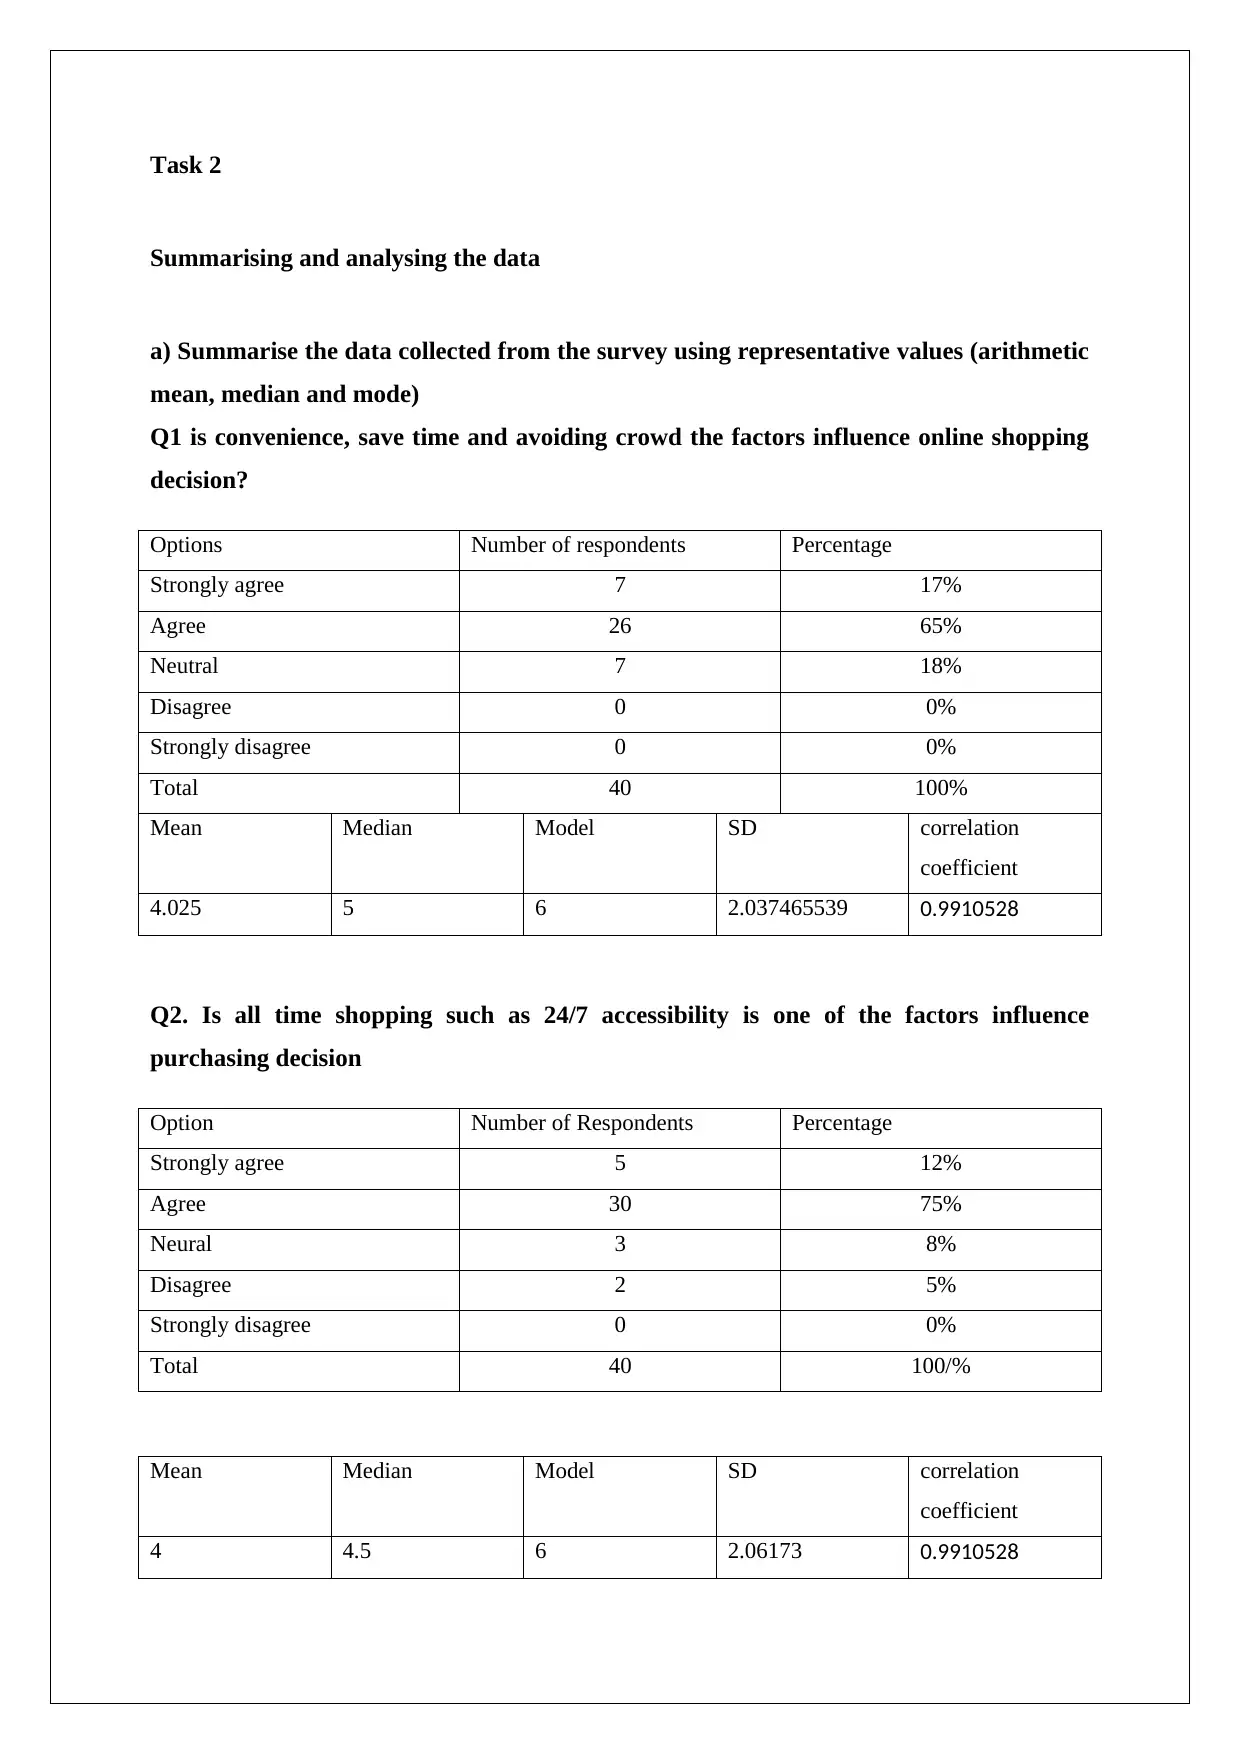
a) Summarise the data collected from the survey using representative values (arithmetic
mean, median and mode)
Q1 is convenience, save time and avoiding crowd the factors influence online shopping
decision?
Options Number of respondents Percentage
Strongly agree 7 17%
Agree 26 65%
Neutral 7 18%
Disagree 0 0%
Strongly disagree 0 0%
Total 40 100%
Mean Median Model SD correlation
coefficient
4.025 5 6 2.037465539 0.9910528
Q2. Is all time shopping such as 24/7 accessibility is one of the factors influence
purchasing decision
Option Number of Respondents Percentage
Strongly agree 5 12%
Agree 30 75%
Neural 3 8%
Disagree 2 5%
Strongly disagree 0 0%
Total 40 100/%
Mean Median Model SD correlation
coefficient
4 4.5 6 2.06173 0.9910528
Summarising and analysing the data
a) Summarise the data collected from the survey using representative values (arithmetic
mean, median and mode)
Q1 is convenience, save time and avoiding crowd the factors influence online shopping
decision?
Options Number of respondents Percentage
Strongly agree 7 17%
Agree 26 65%
Neutral 7 18%
Disagree 0 0%
Strongly disagree 0 0%
Total 40 100%
Mean Median Model SD correlation
coefficient
4.025 5 6 2.037465539 0.9910528
Q2. Is all time shopping such as 24/7 accessibility is one of the factors influence
purchasing decision
Option Number of Respondents Percentage
Strongly agree 5 12%
Agree 30 75%
Neural 3 8%
Disagree 2 5%
Strongly disagree 0 0%
Total 40 100/%
Mean Median Model SD correlation
coefficient
4 4.5 6 2.06173 0.9910528
Paraphrase This Document
Need a fresh take? Get an instant paraphrase of this document with our AI Paraphraser
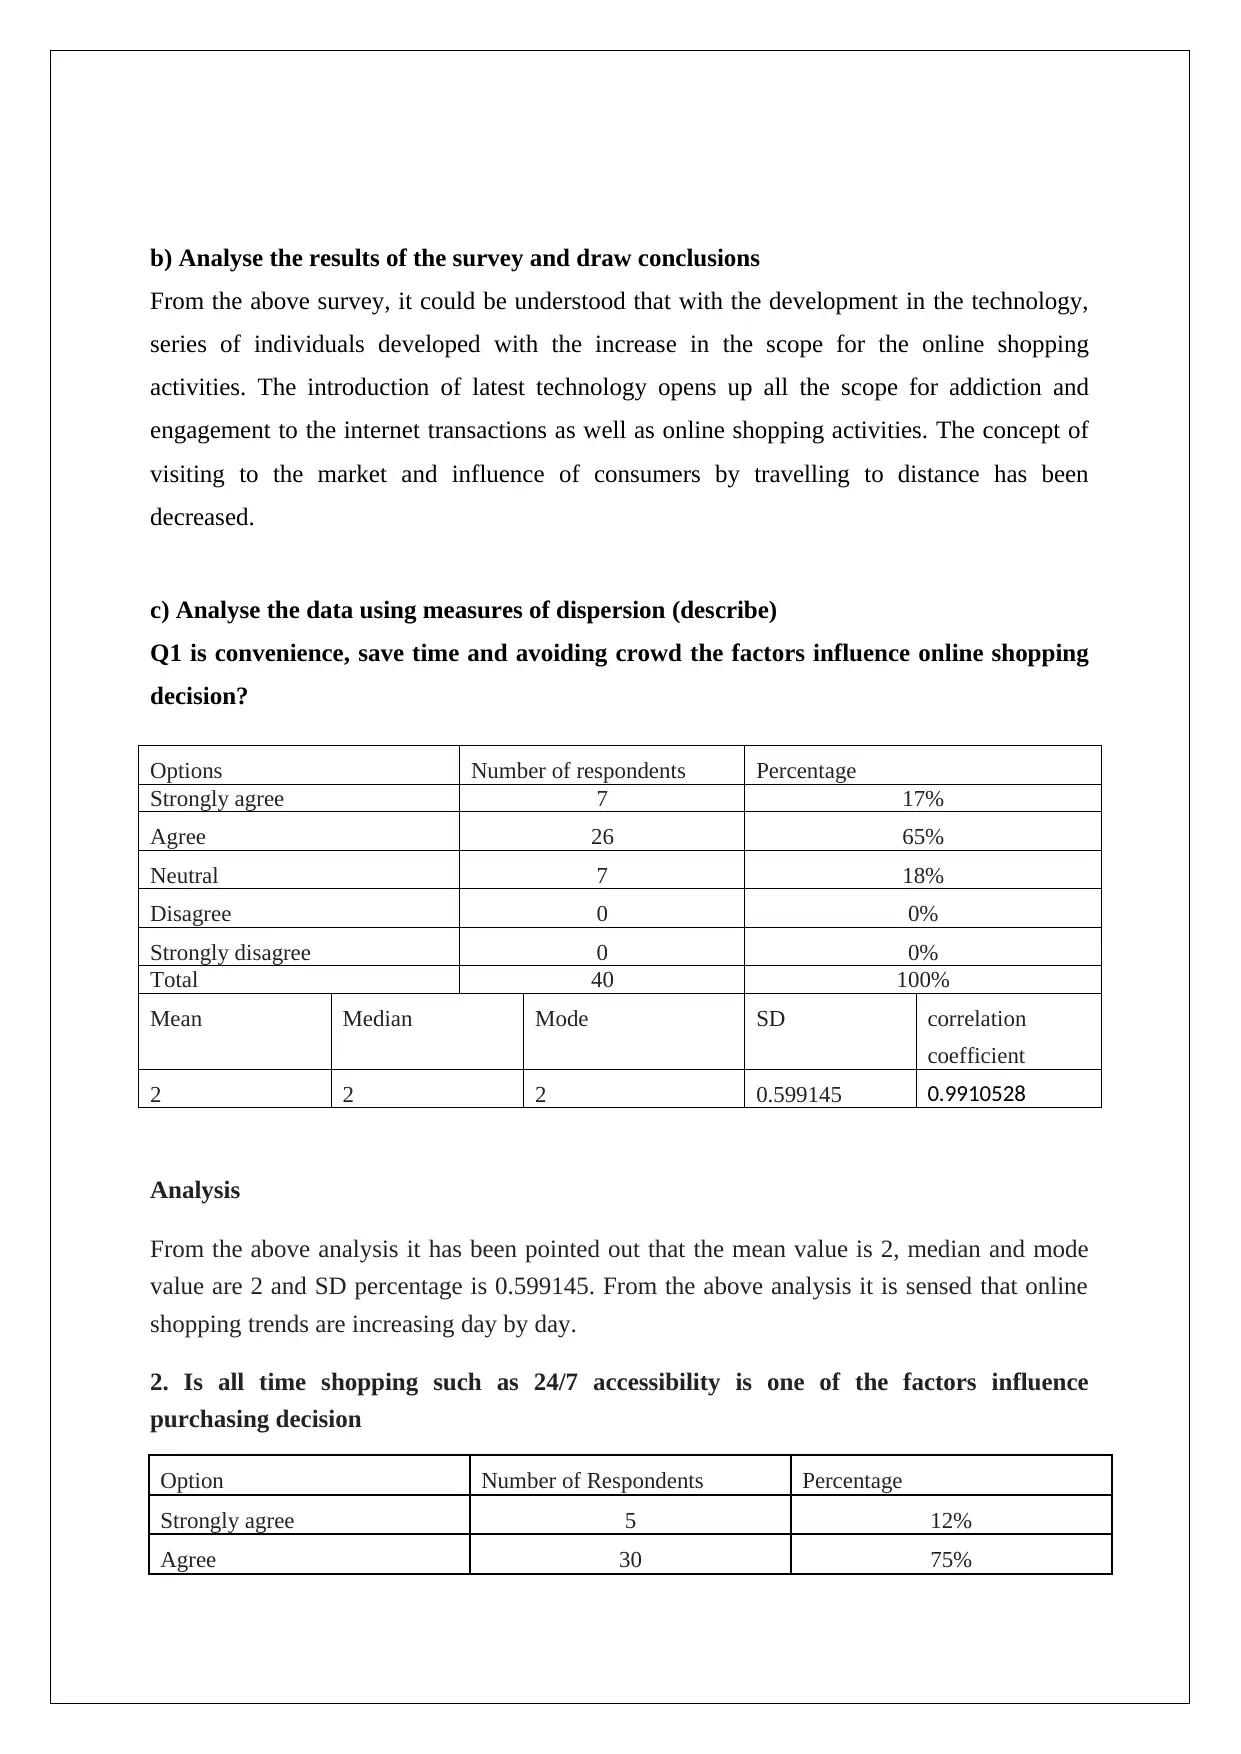
b) Analyse the results of the survey and draw conclusions
From the above survey, it could be understood that with the development in the technology,
series of individuals developed with the increase in the scope for the online shopping
activities. The introduction of latest technology opens up all the scope for addiction and
engagement to the internet transactions as well as online shopping activities. The concept of
visiting to the market and influence of consumers by travelling to distance has been
decreased.
c) Analyse the data using measures of dispersion (describe)
Q1 is convenience, save time and avoiding crowd the factors influence online shopping
decision?
Options Number of respondents Percentage
Strongly agree 7 17%
Agree 26 65%
Neutral 7 18%
Disagree 0 0%
Strongly disagree 0 0%
Total 40 100%
Mean Median Mode SD correlation
coefficient
2 2 2 0.599145 0.9910528
Analysis
From the above analysis it has been pointed out that the mean value is 2, median and mode
value are 2 and SD percentage is 0.599145. From the above analysis it is sensed that online
shopping trends are increasing day by day.
2. Is all time shopping such as 24/7 accessibility is one of the factors influence
purchasing decision
Option Number of Respondents Percentage
Strongly agree 5 12%
Agree 30 75%
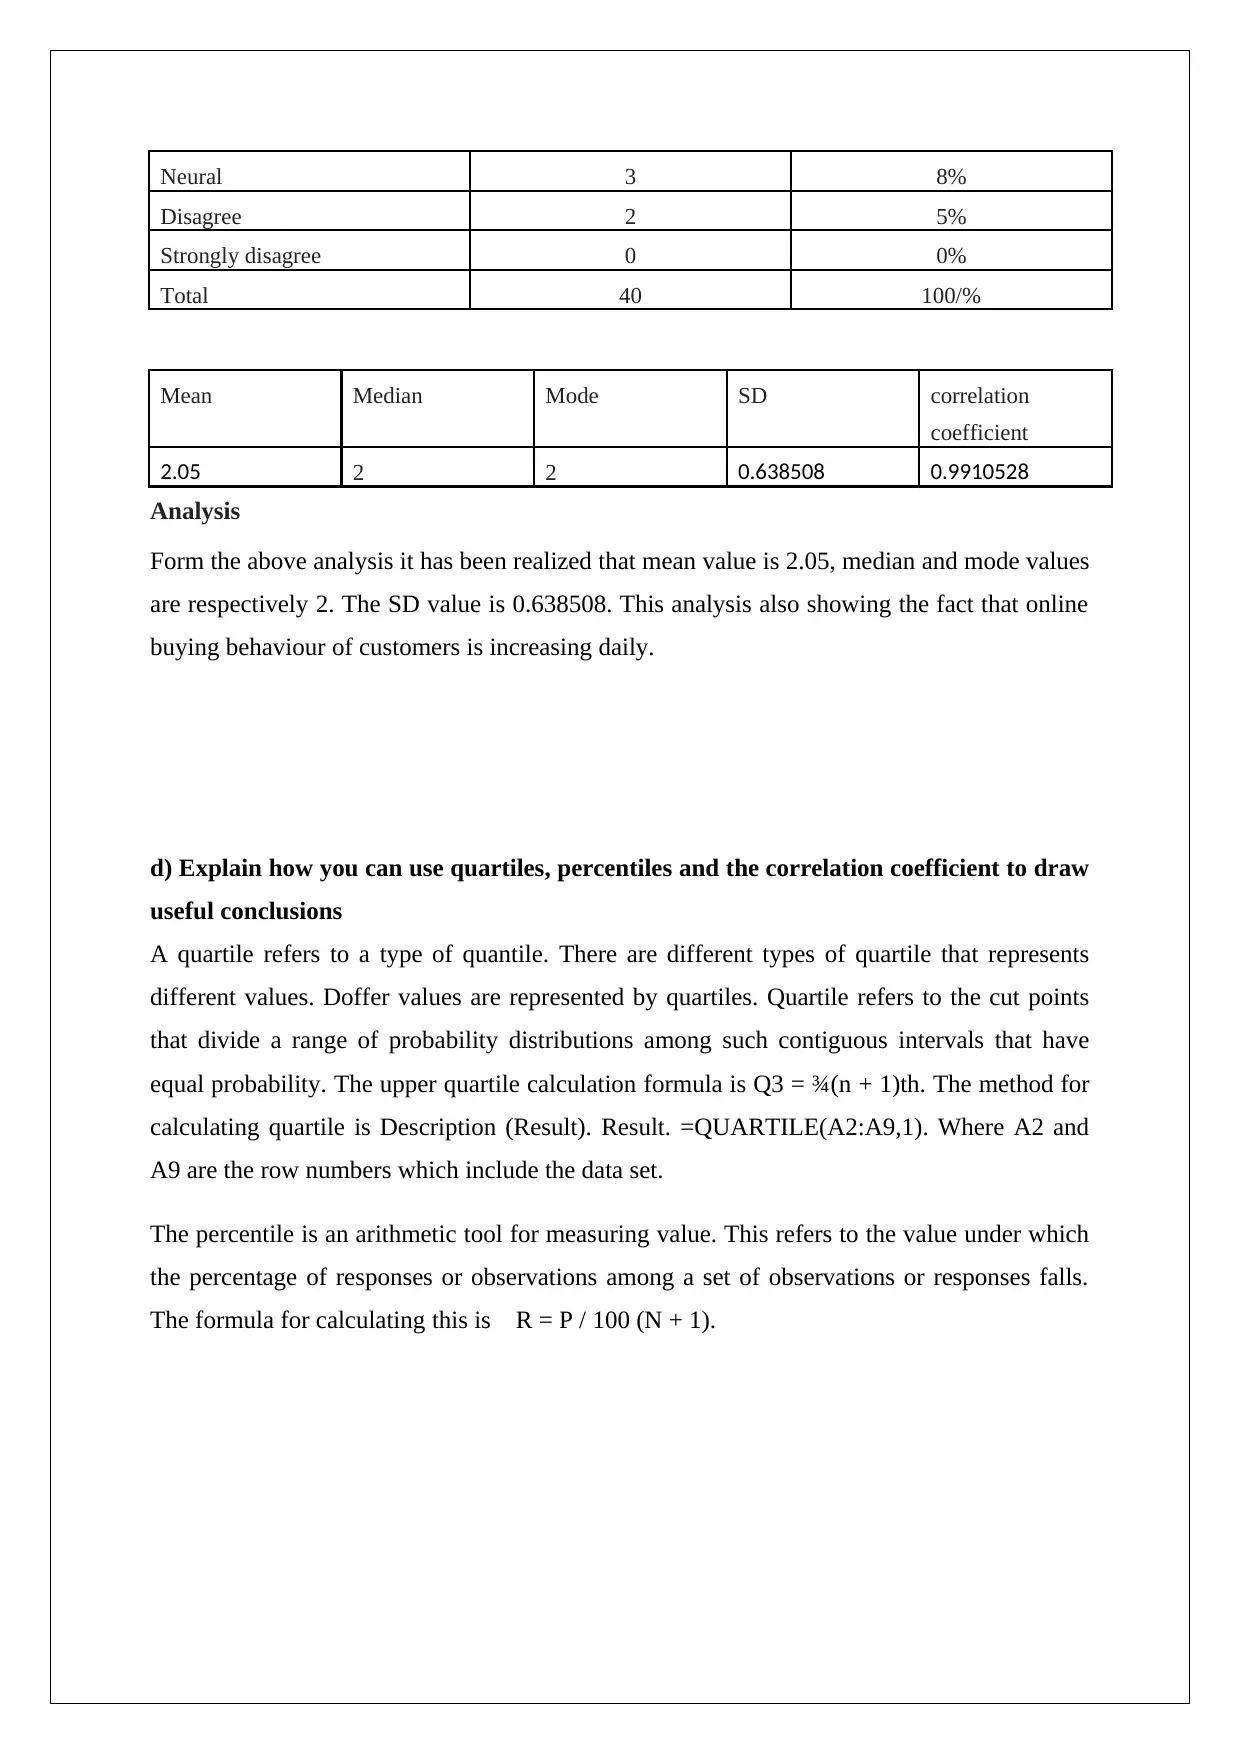
Neural 3 8%
Disagree 2 5%
Strongly disagree 0 0%
Total 40 100/%
Mean Median Mode SD correlation
coefficient
2.05 2 2 0.638508 0.9910528
Analysis
Form the above analysis it has been realized that mean value is 2.05, median and mode values
are respectively 2. The SD value is 0.638508. This analysis also showing the fact that online
buying behaviour of customers is increasing daily.
d) Explain how you can use quartiles, percentiles and the correlation coefficient to draw
useful conclusions
A quartile refers to a type of quantile. There are different types of quartile that represents
different values. Doffer values are represented by quartiles. Quartile refers to the cut points
that divide a range of probability distributions among such contiguous intervals that have
equal probability. The upper quartile calculation formula is Q3 = ¾(n + 1)th. The method for
calculating quartile is Description (Result). Result. =QUARTILE(A2:A9,1). Where A2 and
A9 are the row numbers which include the data set.
The percentile is an arithmetic tool for measuring value. This refers to the value under which
the percentage of responses or observations among a set of observations or responses falls.
The formula for calculating this is R = P / 100 (N + 1).
⊘ This is a preview!⊘
Do you want full access?
Subscribe today to unlock all pages.
Trusted by 1+ million students worldwide
1 out of 26
Related Documents


Your All-in-One AI-Powered Toolkit for Academic Success.
+13062052269
info@desklib.com
Available 24*7 on WhatsApp / Email
![[object Object]](/_next/static/media/star-bottom.7253800d.svg)
Unlock your academic potential
Copyright © 2020–2026 A2Z Services. All Rights Reserved. Developed and managed by ZUCOL.