Business Decision Making Report: Data Analysis and Planning
VerifiedAdded on 2020/07/22
|16
|3735
|79
Report
AI Summary
This report provides a detailed analysis of business decision-making, focusing on the launch of a new Balti Palace branch in London. It covers the collection of primary and secondary data, including the design of a questionnaire and the explanation of survey methodology and sampling frames. The report then delves into data analysis techniques, such as calculating mean, median, mode, standard deviation, quartile, percentile, and correlation, to draw valid conclusions. Graphical representations of the data are also included, along with a formal business report and a business presentation. Finally, the report discusses information processing tools, project planning with critical path determination, and the assessment of financial tools for making business decisions, culminating in recommendations for the company.
Business Decision Making
Paraphrase This Document
Need a fresh take? Get an instant paraphrase of this document with our AI Paraphraser
TABLE OF CONTENTS
INTRODUCTION...........................................................................................................................1
TASK 1............................................................................................................................................1
(1.1) Prepare a plan by using primary and secondary data.....................................................1
(1.2) Explaining survey methodology and sampling frame...................................................1
(1.3) Prepare a questionnaire .................................................................................................2
(2.1) Summarising collected data using representative values and drawing valid conclusion3
(2.2) Computing mean, median and mode and also provide recommendations....................4
(2.3) Calculation of standard deviation..................................................................................5
(2.4) Computing quartile, percentile and correlation and providing meaningful conclusion
from the calculations..............................................................................................................5
TASK 2............................................................................................................................................7
(3.1) Prepare graphical representation of data covered in ppt................................................7
(3.3) Business Presentation Covered in ppt............................................................................8
(3.4) Prepare formal business report......................................................................................8
TASK 3............................................................................................................................................9
(4.1) Discuss different tools of information processing.........................................................9
(4.2) Preparation of project plan and determination of critical path......................................9
(4.3) Assessing financial tools for making business decisions.............................................11
CONCLUSION..............................................................................................................................12
REFERENCES..............................................................................................................................13
INTRODUCTION
Organisation is required to plan out its activities so that it may flourish in the manner by
garnering more profit and widen customer base. The enclosed report deals with Balti palace
which is planning to launch new branch in London. It is required that organisation may invest in
projects after analysing its risks. By providing quality services to customer, it may achieve goals
in effectual manner (Zsambok, 2014).
TASK 1
(1.1) Prepare a plan by using primary and secondary data.
Data collection is really important to start a new venture by company. Balti palace is
planning to launch a new restaurant. For this, it has to collect secondary as well as primary data.
Primary data is collected through original source and is first hand data collected by researcher.
This data is collected through questionnaire which is provided to respondents through online
facility. Books and journals are also used for data gathering. Data needs to be collected from
different sources so that topics related to research may be carefully analysed. Primary data is
first handed data where information through the online questionnaire
On the other hand, secondary data is collected from the annual reports of company to
draw out meaningful conclusion. Secondary data is second hand information which has been
already used previously for the research purpose. Whereas, primary data is provided to
customers to be filed by them to draw out useful information. Therefore, it has to make a plan of
segregating primary as well as secondary data so that business decisions can be made easily
(García-Peñalvo and Conde, 2014). It is of much use for company as it provides a good source of
information which helps in the decision making.
(1.2) Explaining survey methodology and sampling frame
Survey methodology
It is used for gathering data from specific segment. In this study, it is essential to find out
the information from customers regarding their likings and dis-likings, tastes and preferences as
well as ideas to improve upon innovation. Questionnaire are distributed through online way
which reduces time and increase efficiency. Consumer’s tastes and preferences play a vital role
in deciding upon what restaurant has to make decisions regarding taste of them so that quality of
1
⊘ This is a preview!⊘
Do you want full access?
Subscribe today to unlock all pages.
Trusted by 1+ million students worldwide
services may be achieved. It is provided to customers through online basis which saves time of
investigators. The survey question list may be out if closed as well as open ended questions.
Simple random sampling method
It is the method of sampling in which data is collected from taking sample of it. It means
that sample taken by company is representation of entire segment of the information. For
example, 20 customers are taken as a sample by the investigators. In this research Balti palace
restaurant use simple random sampling methods where they easy generate information
(Pettigrew, 2014). In this sampling method there is no parameter used. This method is free and
randomly determine. In this research report research used online questionnaire forms for
generating authentic information
(1.3) Prepare a questionnaire
Questionnaire
Demographic information
Name
Age
Gender
1. Do you prefer to go to restaurant for eating food?
Daily
Weekly
Once in month
Rarely
2. Which factor do you consider while taking food from Balti palace?
Service
Quality
Low prices
Location
3. In your opinion, does Balti palace provide high quality of food products?
Yes
No
4. Do you think customer satisfaction is achieved by Balti palace?
Strongly agree
2
Paraphrase This Document
Need a fresh take? Get an instant paraphrase of this document with our AI Paraphraser
Agree
Neutral
Disagree
5. Do you think that food is provided at low cost by Balti palace?
Yes
No
6. Are you satisfied by services provided by Balti palace?
Highly Satisfied
Satisfied
Neutral
Not satisfied
7. From the below strategies, which strategy affect your buying behaviour?
Promotional activities
Social media
Newspapers
Television
8. Do you think that food products are of utmost quality provided by Balti palace?
Yes
No
9. Do marketing strategies used by Balti palace affect positively on your buying behaviour?
Yes
No
10. Provide your suggestions to improve the services of restaurant_______________
(2.1) Summarising collected data using representative values and drawing valid conclusion
Different data is required to be collected by investigators to draw meaningful information
from the data. Secondary as well as primary data is collected by investigator so that he may
figure out the information regarding business problems. In this scenario, raw data has been
collected from the annual report of Balti Palace. There are sales as well as profit data of Balti
Palace from year 2011 to 2017 are given.. The raw data is as follows:
Table 1: Raw data of sales and profit of Balti Palace
3
Neutral
Disagree
5. Do you think that food is provided at low cost by Balti palace?
Yes
No
6. Are you satisfied by services provided by Balti palace?
Highly Satisfied
Satisfied
Neutral
Not satisfied
7. From the below strategies, which strategy affect your buying behaviour?
Promotional activities
Social media
Newspapers
Television
8. Do you think that food products are of utmost quality provided by Balti palace?
Yes
No
9. Do marketing strategies used by Balti palace affect positively on your buying behaviour?
Yes
No
10. Provide your suggestions to improve the services of restaurant_______________
(2.1) Summarising collected data using representative values and drawing valid conclusion
Different data is required to be collected by investigators to draw meaningful information
from the data. Secondary as well as primary data is collected by investigator so that he may
figure out the information regarding business problems. In this scenario, raw data has been
collected from the annual report of Balti Palace. There are sales as well as profit data of Balti
Palace from year 2011 to 2017 are given.. The raw data is as follows:
Table 1: Raw data of sales and profit of Balti Palace
3
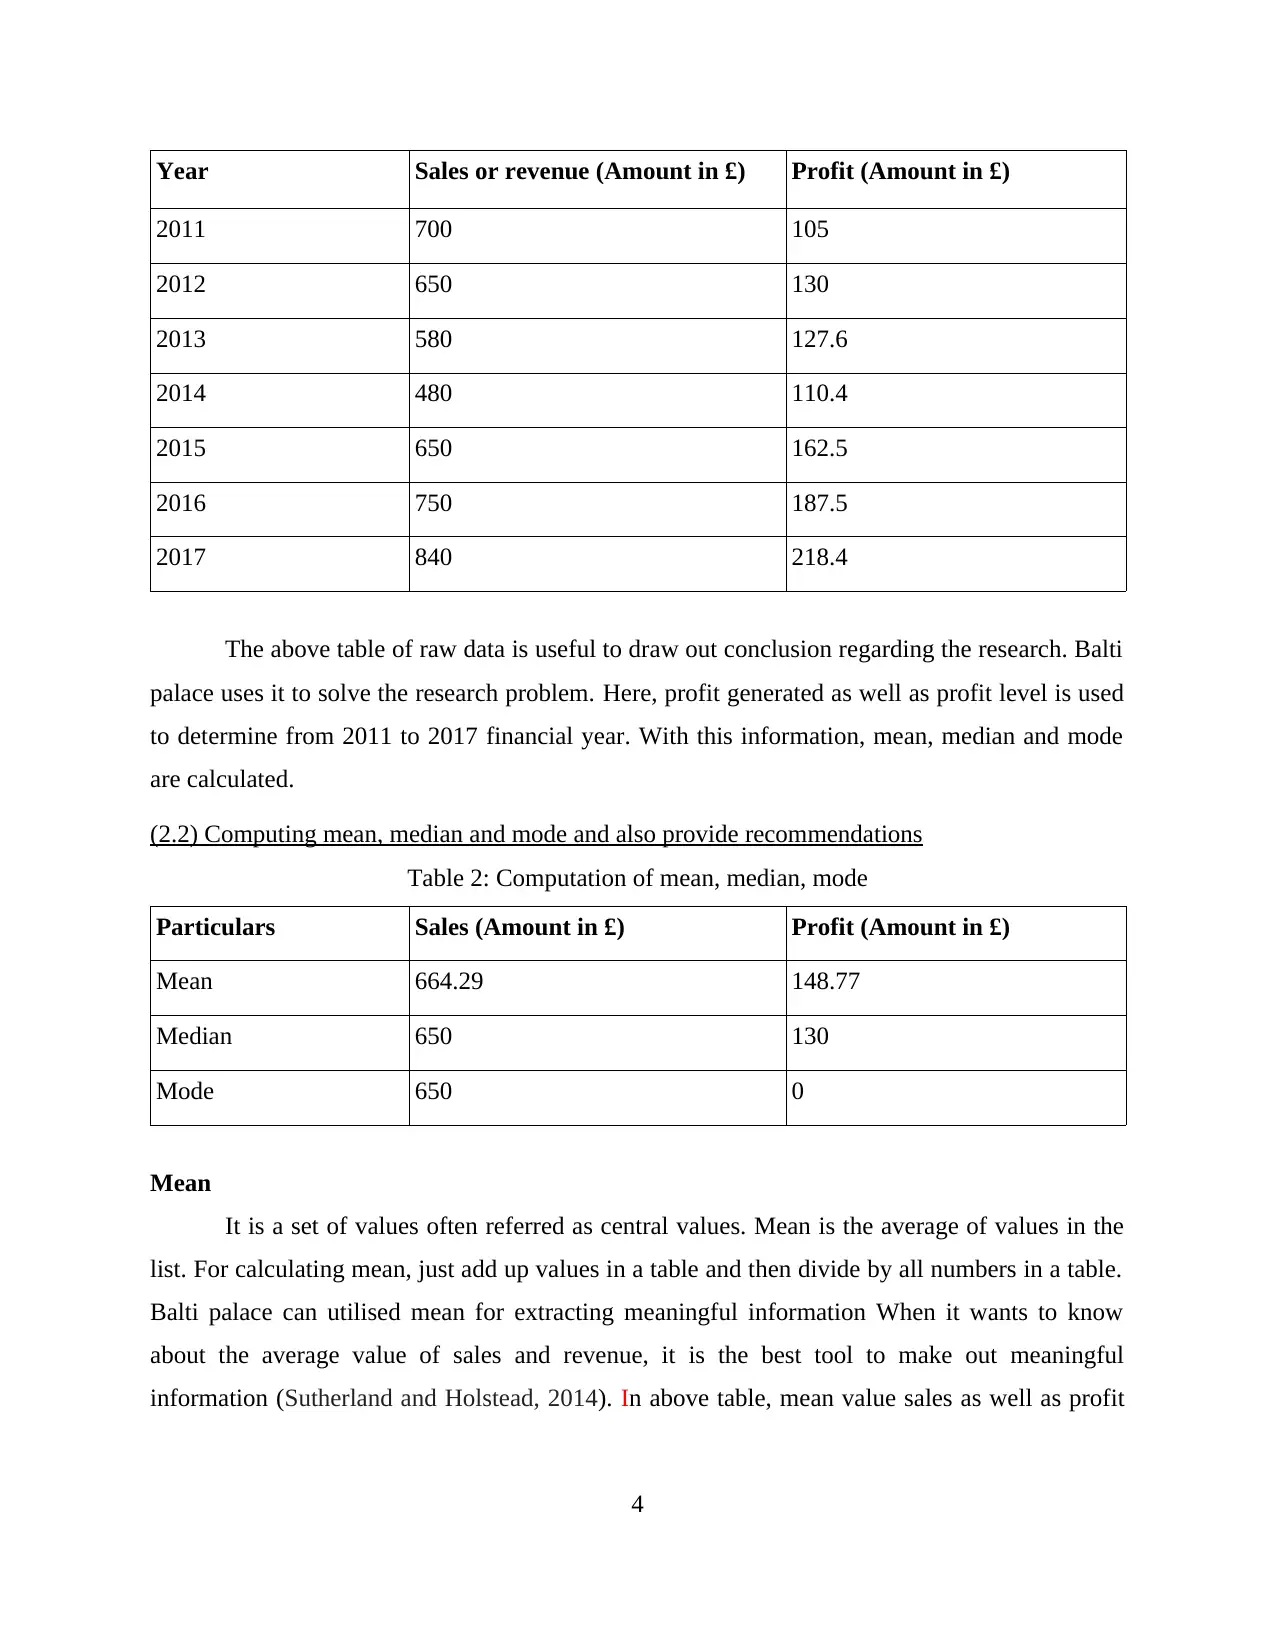
Year Sales or revenue (Amount in £) Profit (Amount in £)
2011 700 105
2012 650 130
2013 580 127.6
2014 480 110.4
2015 650 162.5
2016 750 187.5
2017 840 218.4
The above table of raw data is useful to draw out conclusion regarding the research. Balti
palace uses it to solve the research problem. Here, profit generated as well as profit level is used
to determine from 2011 to 2017 financial year. With this information, mean, median and mode
are calculated.
(2.2) Computing mean, median and mode and also provide recommendations
Table 2: Computation of mean, median, mode
Particulars Sales (Amount in £) Profit (Amount in £)
Mean 664.29 148.77
Median 650 130
Mode 650 0
Mean
It is a set of values often referred as central values. Mean is the average of values in the
list. For calculating mean, just add up values in a table and then divide by all numbers in a table.
Balti palace can utilised mean for extracting meaningful information When it wants to know
about the average value of sales and revenue, it is the best tool to make out meaningful
information (Sutherland and Holstead, 2014). In above table, mean value sales as well as profit
4
⊘ This is a preview!⊘
Do you want full access?
Subscribe today to unlock all pages.
Trusted by 1+ million students worldwide
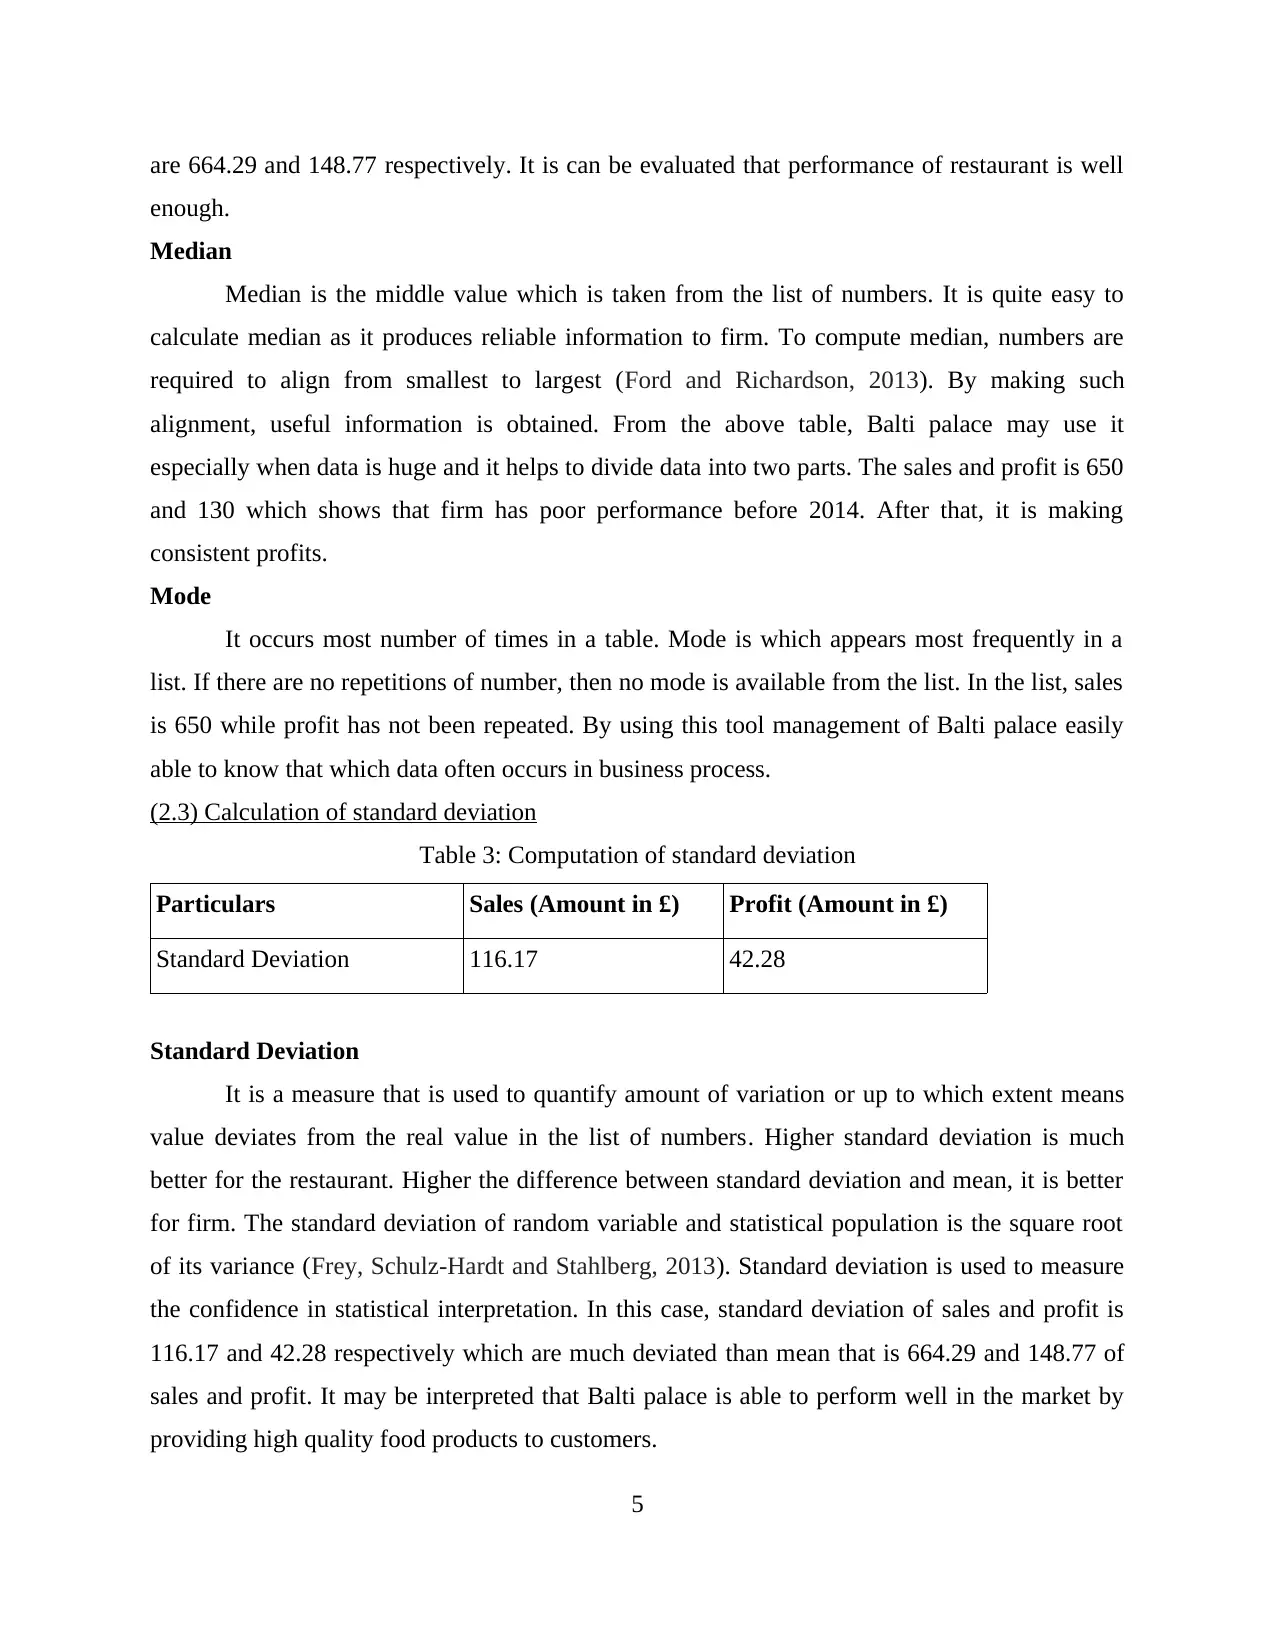
are 664.29 and 148.77 respectively. It is can be evaluated that performance of restaurant is well
enough.
Median
Median is the middle value which is taken from the list of numbers. It is quite easy to
calculate median as it produces reliable information to firm. To compute median, numbers are
required to align from smallest to largest (Ford and Richardson, 2013). By making such
alignment, useful information is obtained. From the above table, Balti palace may use it
especially when data is huge and it helps to divide data into two parts. The sales and profit is 650
and 130 which shows that firm has poor performance before 2014. After that, it is making
consistent profits.
Modet occurs most number of times in a table. Mode is which appears most frequent
It occurs most number of times in a table. Mode is which appears most frequently in a
list. If there are no repetitions of number, then no mode is available from the list. In the list, sales
is 650 while profit has not been repeated. By using this tool management of Balti palace easily
able to know that which data often occurs in business process.
(2.3) Calculation of standard deviation
Table 3: Computation of standard deviation
Particulars Sales (Amount in £) Profit (Amount in £)
Standard Deviation 116.17 42.28
Standard Deviation
It is a measure that is used to quantify amount of variation or up to which extent means
value deviates from the real value in the list of numbers. Higher standard deviation is much
better for the restaurant. Higher the difference between standard deviation and mean, it is better
for firm. The standard deviation of random variable and statistical population is the square root
of its variance (Frey, Schulz-Hardt and Stahlberg, 2013). Standard deviation is used to measure
the confidence in statistical interpretation. In this case, standard deviation of sales and profit is
116.17 and 42.28 respectively which are much deviated than mean that is 664.29 and 148.77 of
sales and profit. It may be interpreted that Balti palace is able to perform well in the market by
providing high quality food products to customers.
5
Paraphrase This Document
Need a fresh take? Get an instant paraphrase of this document with our AI Paraphraser
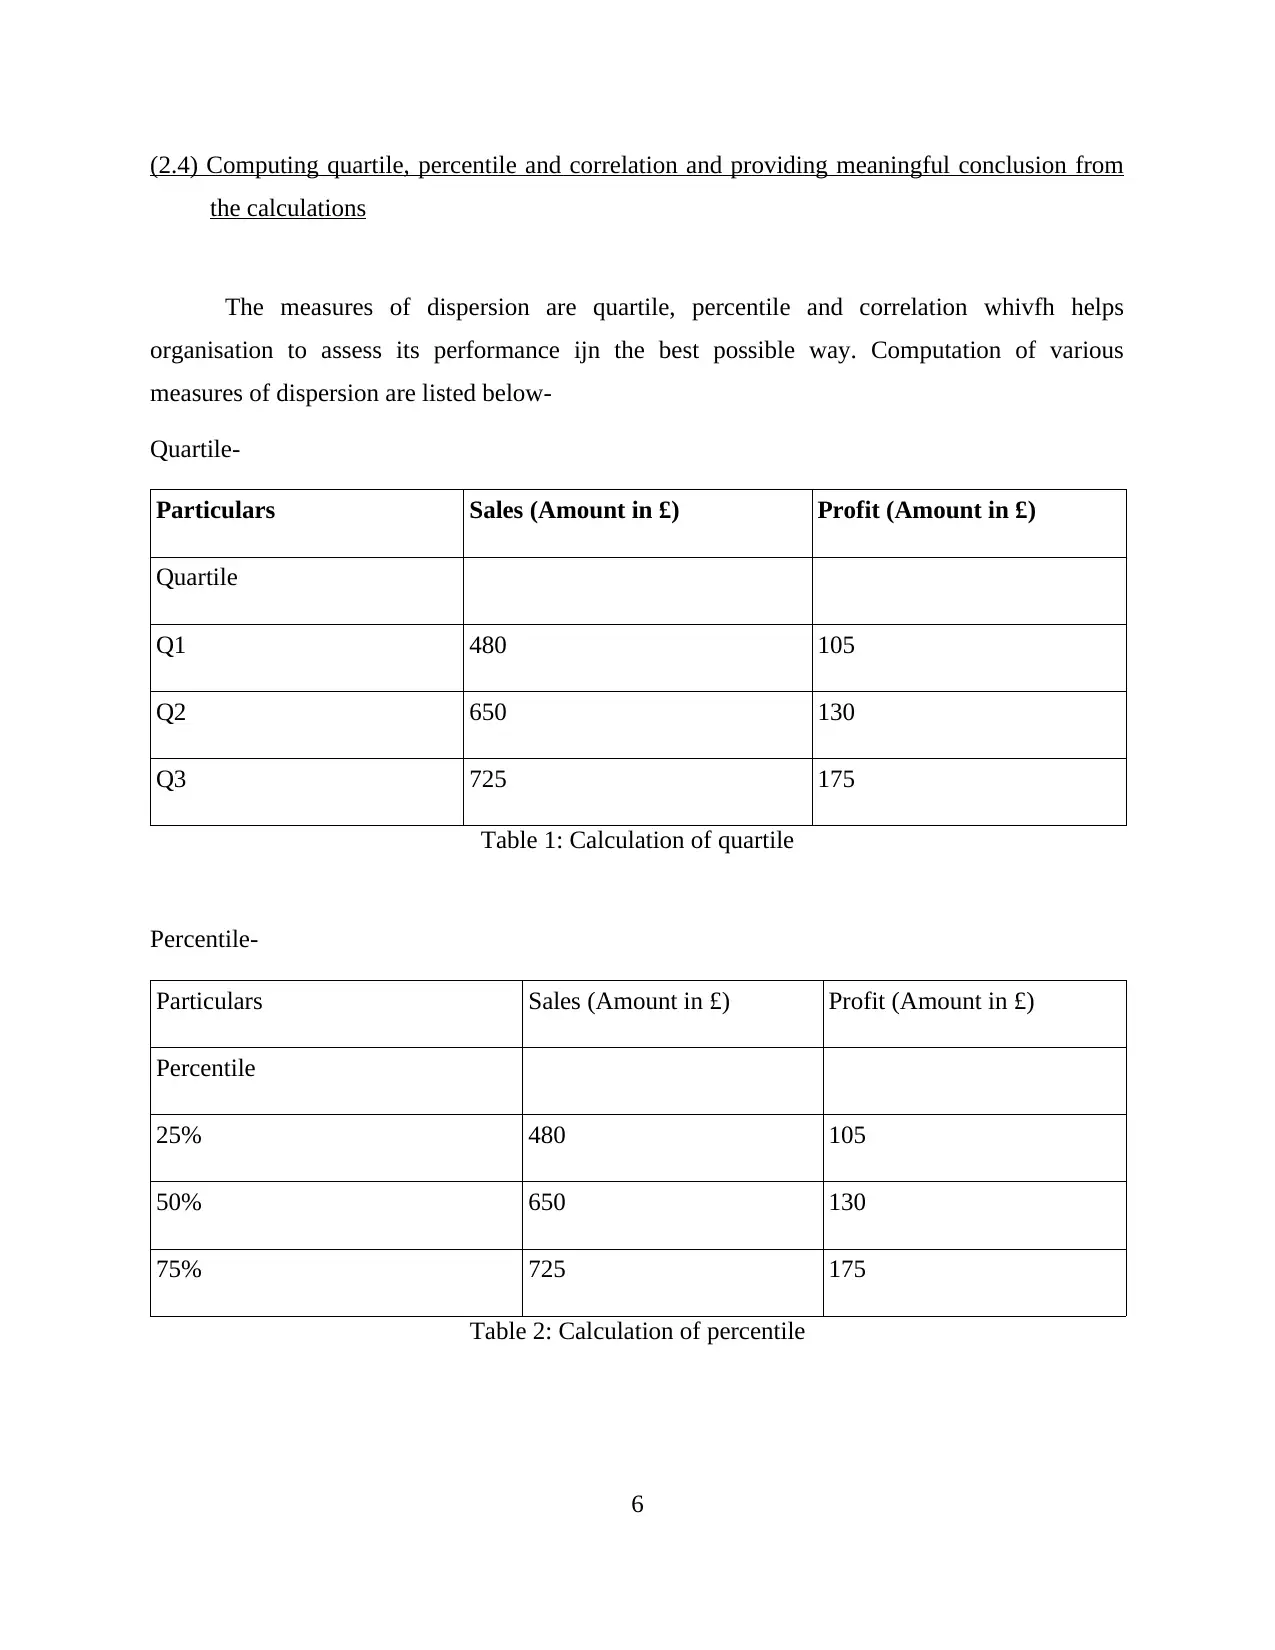
(2.4) Computing quartile, percentile and correlation and providing meaningful conclusion from
the calculations
The measures of dispersion are quartile, percentile and correlation whivfh helps
organisation to assess its performance ijn the best possible way. Computation of various
measures of dispersion are listed below-
Quartile-
Particulars Sales (Amount in £) Profit (Amount in £)
Quartile
Q1 480 105
Q2 650 130
Q3 725 175
Table 1: Calculation of quartile
Percentile-
Particulars Sales (Amount in £) Profit (Amount in £)
Percentile
25% 480 105
50% 650 130
75% 725 175
Table 2: Calculation of percentile
6
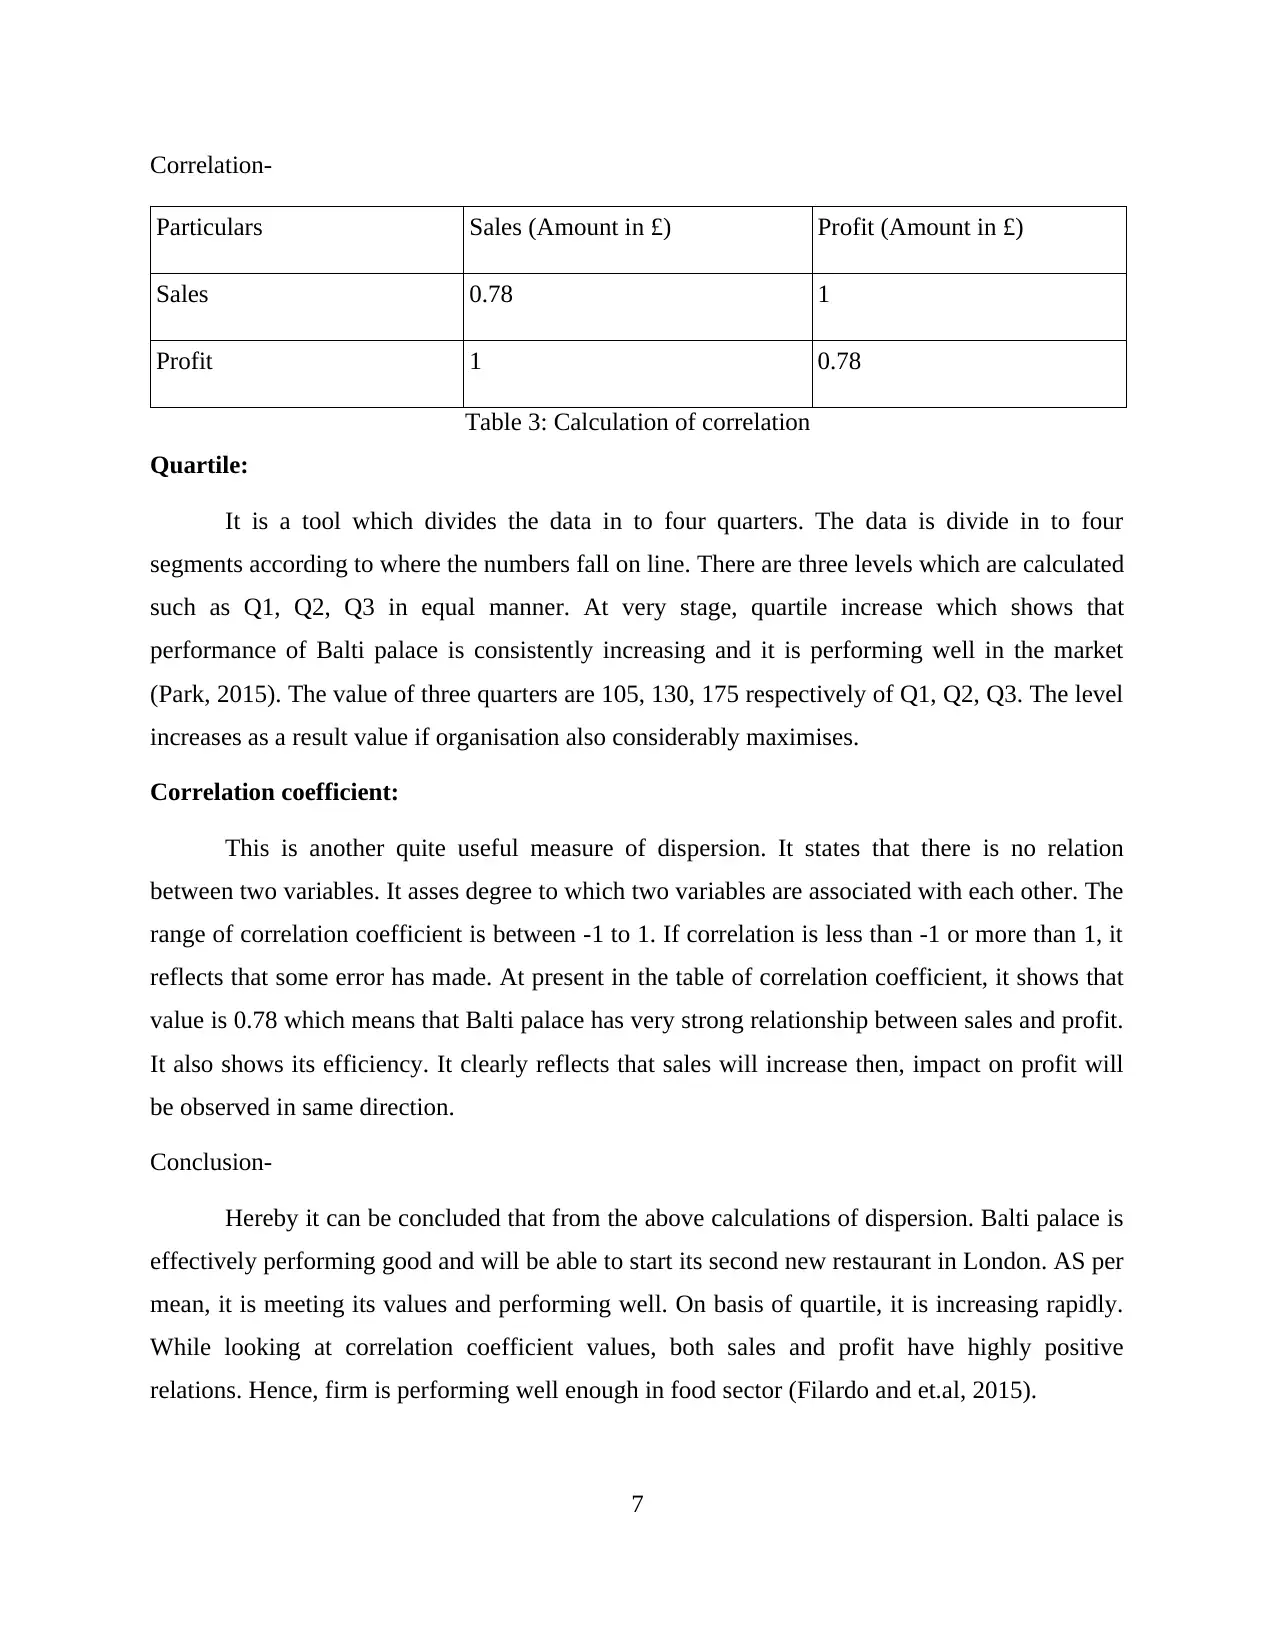
Correlation-
Particulars Sales (Amount in £) Profit (Amount in £)
Sales 0.78 1
Profit 1 0.78
Table 3: Calculation of correlation
Quartile:
It is a tool which divides the data in to four quarters. The data is divide in to four
segments according to where the numbers fall on line. There are three levels which are calculated
such as Q1, Q2, Q3 in equal manner. At very stage, quartile increase which shows that
performance of Balti palace is consistently increasing and it is performing well in the market
(Park, 2015). The value of three quarters are 105, 130, 175 respectively of Q1, Q2, Q3. The level
increases as a result value if organisation also considerably maximises.
Correlation coefficient:
This is another quite useful measure of dispersion. It states that there is no relation
between two variables. It asses degree to which two variables are associated with each other. The
range of correlation coefficient is between -1 to 1. If correlation is less than -1 or more than 1, it
reflects that some error has made. At present in the table of correlation coefficient, it shows that
value is 0.78 which means that Balti palace has very strong relationship between sales and profit.
It also shows its efficiency. It clearly reflects that sales will increase then, impact on profit will
be observed in same direction.
Conclusion-
Hereby it can be concluded that from the above calculations of dispersion. Balti palace is
effectively performing good and will be able to start its second new restaurant in London. AS per
mean, it is meeting its values and performing well. On basis of quartile, it is increasing rapidly.
While looking at correlation coefficient values, both sales and profit have highly positive
relations. Hence, firm is performing well enough in food sector (Filardo and et.al, 2015).
7
⊘ This is a preview!⊘
Do you want full access?
Subscribe today to unlock all pages.
Trusted by 1+ million students worldwide
TASK 2
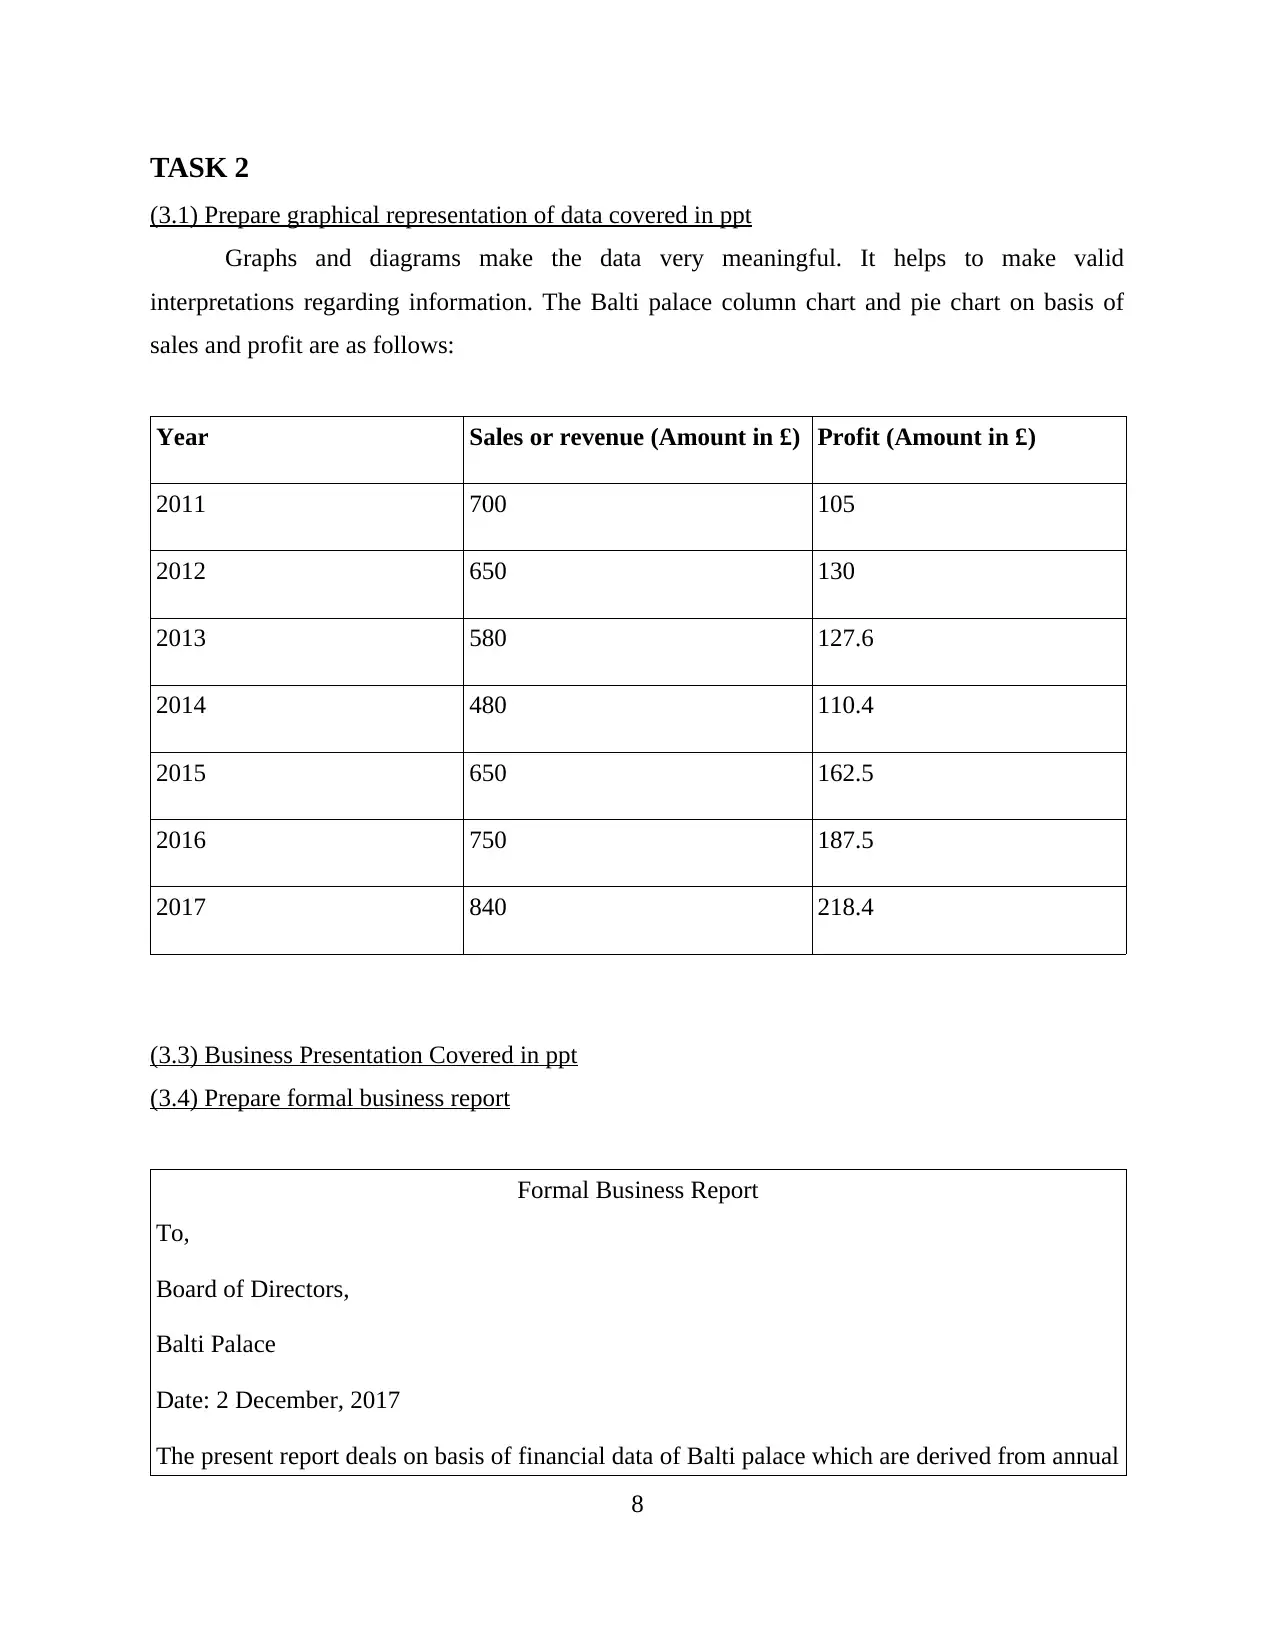
(3.1) Prepare graphical representation of data covered in ppt
Graphs and diagrams make the data very meaningful. It helps to make valid
interpretations regarding information. The Balti palace column chart and pie chart on basis of
sales and profit are as follows:
Year Sales or revenue (Amount in £) Profit (Amount in £)
2011 700 105
2012 650 130
2013 580 127.6
2014 480 110.4
2015 650 162.5
2016 750 187.5
2017 840 218.4
(3.3) Business Presentation Covered in ppt
(3.4) Prepare formal business report
Formal Business Report
To,
Board of Directors,
Balti Palace
Date: 2 December, 2017
The present report deals on basis of financial data of Balti palace which are derived from annual
8
Paraphrase This Document
Need a fresh take? Get an instant paraphrase of this document with our AI Paraphraser
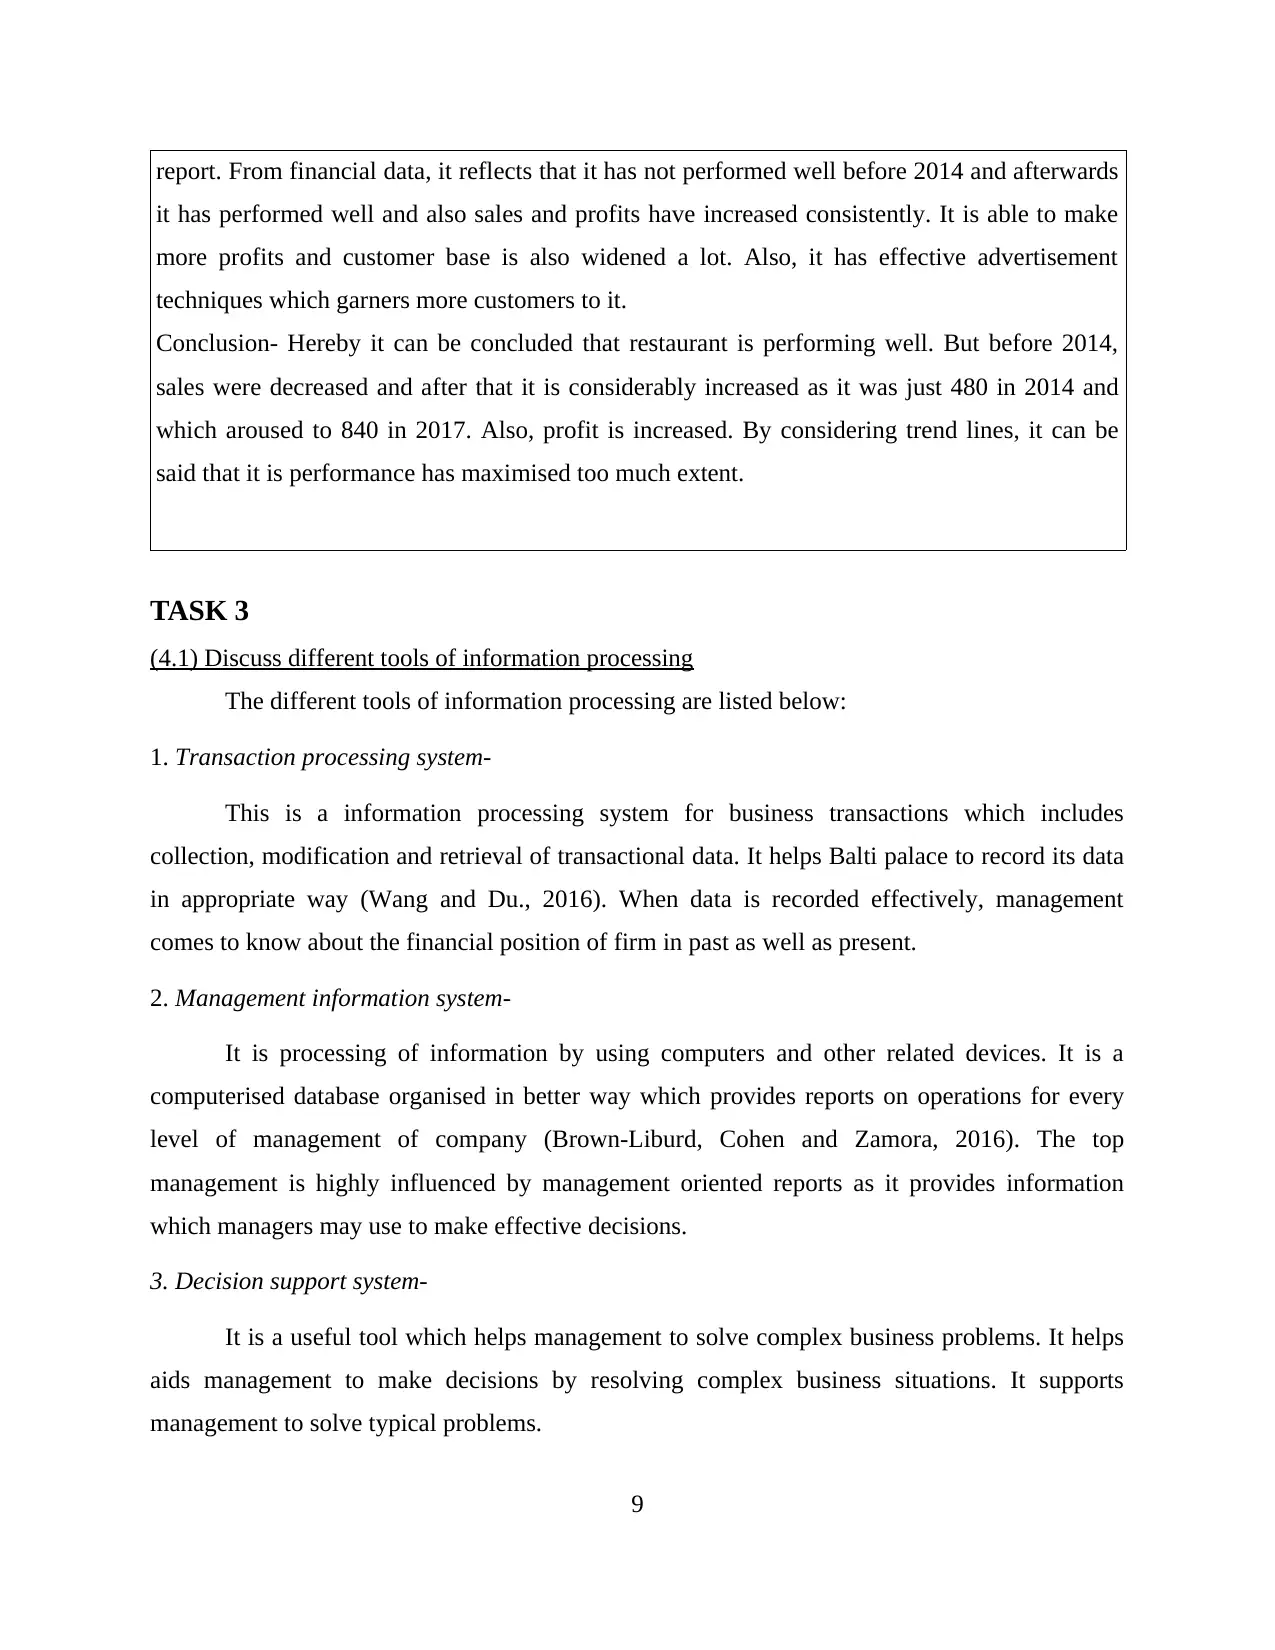
report. From financial data, it reflects that it has not performed well before 2014 and afterwards
it has performed well and also sales and profits have increased consistently. It is able to make
more profits and customer base is also widened a lot. Also, it has effective advertisement
techniques which garners more customers to it.
Conclusion- Hereby it can be concluded that restaurant is performing well. But before 2014,
sales were decreased and after that it is considerably increased as it was just 480 in 2014 and
which aroused to 840 in 2017. Also, profit is increased. By considering trend lines, it can be
said that it is performance has maximised too much extent.
TASK 3
(4.1) Discuss different tools of information processing
The different tools of information processing are listed below:
1. Transaction processing system-
This is a information processing system for business transactions which includes
collection, modification and retrieval of transactional data. It helps Balti palace to record its data
in appropriate way (Wang and Du., 2016). When data is recorded effectively, management
comes to know about the financial position of firm in past as well as present.
2. Management information system-
It is processing of information by using computers and other related devices. It is a
computerised database organised in better way which provides reports on operations for every
level of management of company (Brown-Liburd, Cohen and Zamora, 2016). The top
management is highly influenced by management oriented reports as it provides information
which managers may use to make effective decisions.
3. Decision support system-
It is a useful tool which helps management to solve complex business problems. It helps
aids management to make decisions by resolving complex business situations. It supports
management to solve typical problems.
9
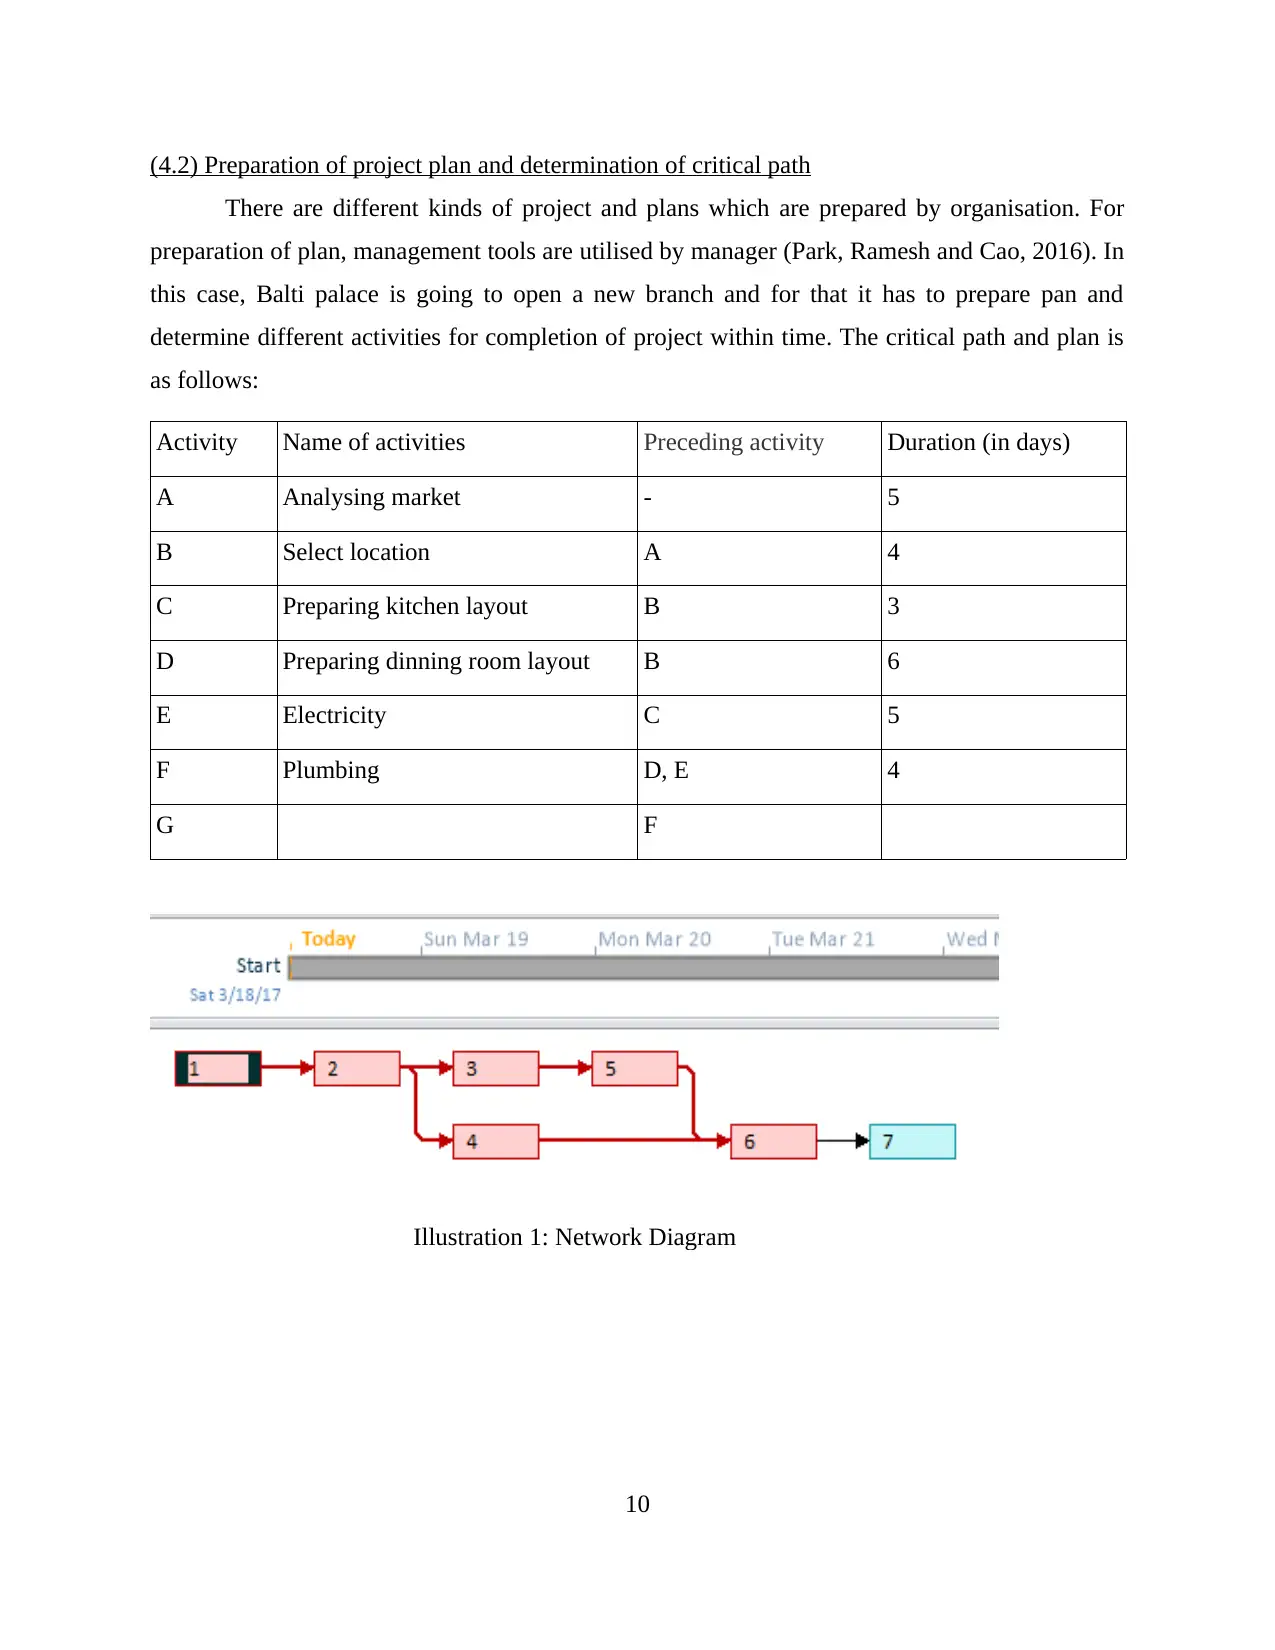
(4.2) Preparation of project plan and determination of critical path
There are different kinds of project and plans which are prepared by organisation. For
preparation of plan, management tools are utilised by manager (Park, Ramesh and Cao, 2016). In
this case, Balti palace is going to open a new branch and for that it has to prepare pan and
determine different activities for completion of project within time. The critical path and plan is
as follows:
Activity Name of activities Preceding activity Duration (in days)
A Analysing market - 5
B Select location A 4
C Preparing kitchen layout B 3
D Preparing dinning room layout B 6
E Electricity C 5
F Plumbing D, E 4
G F
Illustration 1: Network Diagram
10
⊘ This is a preview!⊘
Do you want full access?
Subscribe today to unlock all pages.
Trusted by 1+ million students worldwide
1 out of 16
Related Documents


Your All-in-One AI-Powered Toolkit for Academic Success.
+13062052269
info@desklib.com
Available 24*7 on WhatsApp / Email
![[object Object]](/_next/static/media/star-bottom.7253800d.svg)
Unlock your academic potential
Copyright © 2020–2026 A2Z Services. All Rights Reserved. Developed and managed by ZUCOL.