Business Decision-Making Report: Data Analysis and Statistics
VerifiedAdded on 2019/12/28
|21
|4491
|358
Report
AI Summary
This report delves into the multifaceted realm of business decision-making, employing data analysis and statistical techniques to assess various business scenarios. It begins by exploring data collection methods, differentiating between primary and secondary sources, and discussing survey methodologies and sampling frames. The report then applies statistical techniques to analyze data, including measures of central tendency, dispersion, quartiles, percentiles, and correlation coefficients, to draw valid conclusions. Graphical representations of business sales and trend line analysis are also incorporated. Furthermore, the report examines the advantages of intranet systems, project plan implementation, and the application of investment appraisal techniques in the decision-making process. The analysis is illustrated with examples related to Transport for London and Days Lane Motors, culminating in a formal business report and PowerPoint presentation summarizing the findings and recommendations.

BUSINESS DECISION-
MAKING
MAKING
Paraphrase This Document
Need a fresh take? Get an instant paraphrase of this document with our AI Paraphraser
Table of Contents
INTRODUCTION......................................................................................................................1
TASK 1......................................................................................................................................1
a) Collection of primary and secondary data........................................................................1
b) Survey methodology and sampling frame.........................................................................2
c) Designing a questionnaire.................................................................................................3
TASK 2......................................................................................................................................4
a) Application of statistical techniques..................................................................................4
b) Measurement of dispersion...............................................................................................5
c) Analysis of the results.......................................................................................................5
d) Quartile, percentile, interquartile range and correlation coefficient to draw valid
conclusion..............................................................................................................................5
1. Quartile and Inter-quartile range.......................................................................................5
2. 40th percentile...................................................................................................................6
3. Correlation coefficient.......................................................................................................6
TASK 3......................................................................................................................................6
a) Graphical representation of business sales........................................................................6
b) Trend line..........................................................................................................................9
c) Formal business report....................................................................................................12
d) Power point presentation.................................................................................................13
TASK 4....................................................................................................................................13
a) Advantageous of Intranet system for Days Lane Motors................................................13
b) Implementation of project plan.......................................................................................13
c) Application of Investment appraisal techniques in decision-making process.................15
CONCLUSION........................................................................................................................17
REFERENCES.........................................................................................................................18
INTRODUCTION
Decision making plays a significant role in the organisation growth. It is a process of
gathering required information and takes qualified and strategic decisions for the business
success. Transport for London often shortened to TFL is the local government body that is
responsible for making effective transport system in UK. The role of TFL is to implement
transport strategy and manage the UK transport system in an effective way. Headquarter of
TFL is established in Windor House, Victoria street, Westminster, London. In this report, the
role of primary as well as secondary research analysis has been discussed for TFL. Moreover,
various statistical as well as financial tools have been applied to take effective business
decisions.
TASK 1
a) Collection of primary and secondary data
Transport for London organization should collect data from two sources that are
primary and secondary; they are described here as under:
Primary sources: It is the direct way of gathering business information as it is
collected by researcher for the first time. Research conductor gathers required information to
find the best solution for a particular business problem. There are various sources available to
collect primary information that includes survey methodology, interviews, fieldworks, case
study and observations. It requires a lot of time and money to collect information (Thomsen,
2016). The benefit of this way of data collection is that it provides more reliable and accurate
information to the researcher. Conducting surveys is the best way of collecting primary
information. Under this technique, investigator needs to decide their target market first. It is a
market at which research has been taken place. Thereafter, information can be collected by
making questionnaire. It is a cost effective method and provides more reliable and prominent
information and fulfil researcher’s objective in the best way. Transport for London can gather
necessary information to know the level of customer satisfaction through conducting surveys.
The method helps to deliver significant and more accurate information to the organization.
Secondary sources: Secondary source of information are the published sources as it
has been collected previously by the other investigators for their own purposes. There are
numerous ways available to gather information such as censuses, historical organizational
records, interview reviews, literature reviews, web searching, television, magazines, journals
and newspapers (Nastasi and Borja, 2016). Moreover, it can be collected by the published
sources such as trade association reports, published commercial reports, governmental and
1 | P a g e
⊘ This is a preview!⊘
Do you want full access?
Subscribe today to unlock all pages.
Trusted by 1+ million students worldwide
agencies reports and other published economic reports. The benefit of the sources is that it
consume less time and spent less money in data collection process. TFL will be able to gather
information about the customer satisfaction from the historical organization records,
economic reports and other published government reports.
b) Survey methodology and sampling frame
The role of survey methodology and sampling frame in data collection process for
TFL has been discussed here as under:
Survey methodology: It is a way of studying a sample of units from overall
population. It provides assistance to the researcher in satisfying their data collection
requirements. There are numerous ways available to TFL for conducting survey methodology
that is questionnaire, interviews and online surveys. Questionnaire consists of making a series
of questions for gathering all the required information about the respondents. The benefits of
this method it is a quicker and cheaper source of data collection. Researcher can construct
number of questions and gather information from the respondent (Lowes and et. al., 2016).
Another benefit of this method is it filled by respondent themselves hence, provide correct
and fact information to the organization. Moreover, web questionnaire may be designed and
sent through e-mails to the consumers helps to collect wider space information. Thus, helps to
collect information for a large number of samples. Moreover, interviews may also be
conducted for data collection. In context to TFL, it can take telephone interviews and
personal interviews also known as face to face interviews. In this method, researcher can ask
questions to the respondents and gather necessary information. Furthermore, online surveys
can also be organized by TFL through using web technology.
Sampling frame: Sample consist a number of units that has been selected from the
total population or universe. In context to TFL, universe consists of all the persons who are
using the company services for travelling purpose. Thus, it is not possible for the researcher
to study the entire universe as it takes a lot of time and the money. Therefore, sampling frame
is a best technique that mitigates the requirement of study the universe through selecting a
sample. The sampling method is a way in which TFL needs to select an appropriate size of
sample that represents all the characteristics of the universe. The advantage of this method is
that it save researcher times and cost (Mintz and Wayne, 2016). Moreover, universe can be
analysed through making analysis of the representative sample only. Thus, it does not require
addressing all the units for research purpose. Sample can be selected by two ways that are
probability sampling method and non-probability sampling. Under the probability sampling
2 | P a g e
Paraphrase This Document
Need a fresh take? Get an instant paraphrase of this document with our AI Paraphraser
technique, all the persons have an equal chance of being selection in the sample. However,
under the non-probability sampling, each unit do not have an equal probability of inclusion in
sample (Beamish and Lupton, 2016). Under the given scenario, sample has been selected for
TFL using probability method. In this method, units are selected on a random basis to
construct a sample.
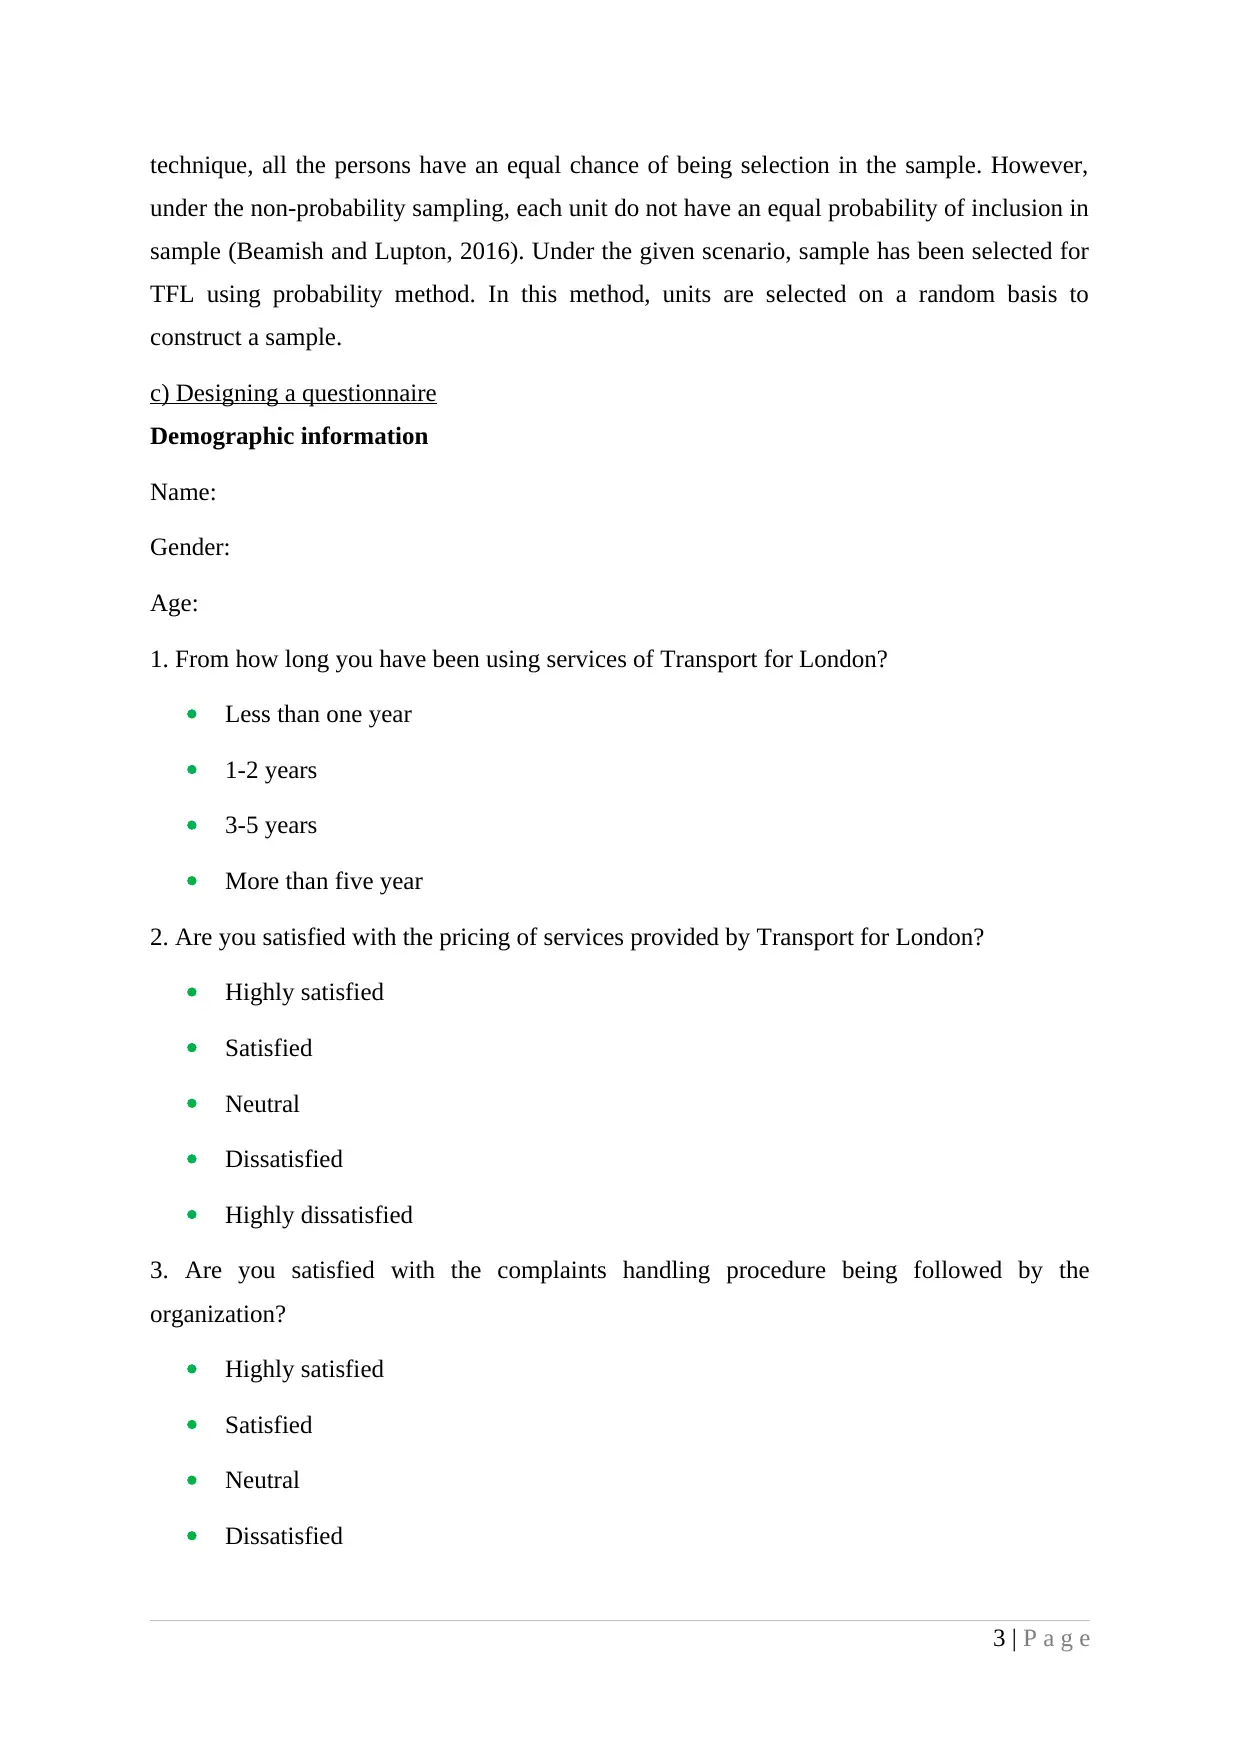
c) Designing a questionnaire
Demographic information
Name:
Gender:
Age:
1. From how long you have been using services of Transport for London?
Less than one year
1-2 years
3-5 years
More than five year
2. Are you satisfied with the pricing of services provided by Transport for London?
Highly satisfied
Satisfied
Neutral
Dissatisfied
Highly dissatisfied
3. Are you satisfied with the complaints handling procedure being followed by the
organization?
Highly satisfied
Satisfied
Neutral
Dissatisfied
3 | P a g e
under the non-probability sampling, each unit do not have an equal probability of inclusion in
sample (Beamish and Lupton, 2016). Under the given scenario, sample has been selected for
TFL using probability method. In this method, units are selected on a random basis to
construct a sample.
c) Designing a questionnaire
Demographic information
Name:
Gender:
Age:
1. From how long you have been using services of Transport for London?
Less than one year
1-2 years
3-5 years
More than five year
2. Are you satisfied with the pricing of services provided by Transport for London?
Highly satisfied
Satisfied
Neutral
Dissatisfied
Highly dissatisfied
3. Are you satisfied with the complaints handling procedure being followed by the
organization?
Highly satisfied
Satisfied
Neutral
Dissatisfied
3 | P a g e
Highly dissatisfied
4. What is your level of agreement to the behaviour of employees at Transport of London?
Yes
No
5. Recommend that changes that is needed within the services of Transport for London?
TASK 2
a) Application of statistical techniques
Days Lane Motors is the owner of a local independent garage facing severe
competition from big national servicing chains in the market. Therefore, company owner
decides to reduce their service prices in order to compete effectively. Before implementing
such business plan, owner needs to review the service cost. There are number of statistical
tools can be applied to Days Lane Motors for cost analysis purpose. It includes measurement
of central tendency such as range, mean, mode and median. The costs of 54 cars are given
here:
225 237 470 319 209 430
475 277 241 447 430 211
243 310 345 214 265 389
489 257 475 259 493 278
234 490 237 346 240 278
460 478 350 326 459 220
Mean: It is one of the most appropriate measurements of central tendency. It represent
the average value of the given data series (Jackson and et.al, 2014). In context to DLM, it
helps the owner to determine the average cost of each car that is serviced by company.
Mean = Total service cost/Number of cars
= 18075£/54 cars
= 334.72£
Median: It represents the middle value of the data series. The median for the given
service cost sheet for DLM is 322.5£.
4 | P a g e
⊘ This is a preview!⊘
Do you want full access?
Subscribe today to unlock all pages.
Trusted by 1+ million students worldwide
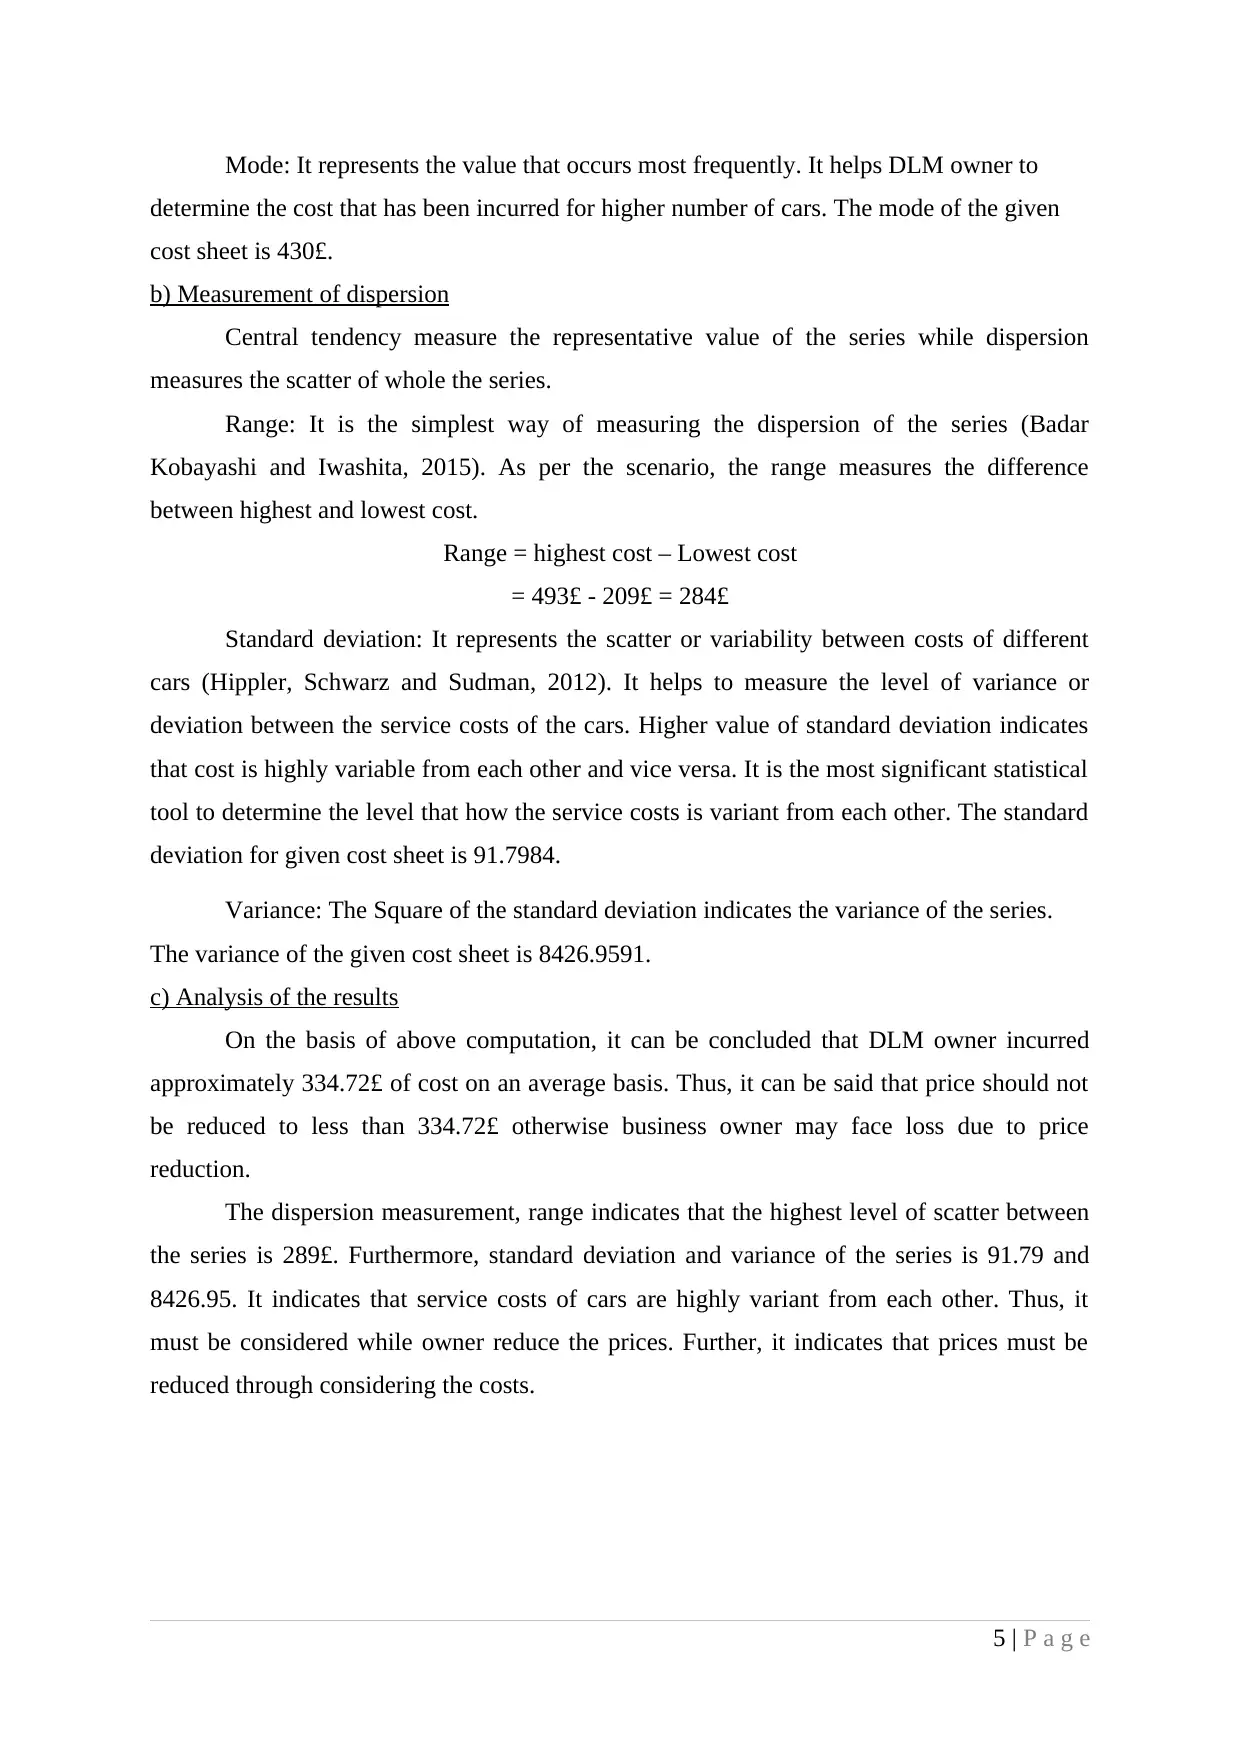
Mode: It represents the value that occurs most frequently. It helps DLM owner to
determine the cost that has been incurred for higher number of cars. The mode of the given
cost sheet is 430£.
b) Measurement of dispersion
Central tendency measure the representative value of the series while dispersion
measures the scatter of whole the series.
Range: It is the simplest way of measuring the dispersion of the series (Badar
Kobayashi and Iwashita, 2015). As per the scenario, the range measures the difference
between highest and lowest cost.
Range = highest cost – Lowest cost
= 493£ - 209£ = 284£
Standard deviation: It represents the scatter or variability between costs of different
cars (Hippler, Schwarz and Sudman, 2012). It helps to measure the level of variance or
deviation between the service costs of the cars. Higher value of standard deviation indicates
that cost is highly variable from each other and vice versa. It is the most significant statistical
tool to determine the level that how the service costs is variant from each other. The standard
deviation for given cost sheet is 91.7984.
Variance: The Square of the standard deviation indicates the variance of the series.
The variance of the given cost sheet is 8426.9591.
c) Analysis of the results
On the basis of above computation, it can be concluded that DLM owner incurred
approximately 334.72£ of cost on an average basis. Thus, it can be said that price should not
be reduced to less than 334.72£ otherwise business owner may face loss due to price
reduction.
The dispersion measurement, range indicates that the highest level of scatter between
the series is 289£. Furthermore, standard deviation and variance of the series is 91.79 and
8426.95. It indicates that service costs of cars are highly variant from each other. Thus, it
must be considered while owner reduce the prices. Further, it indicates that prices must be
reduced through considering the costs.
5 | P a g e
Paraphrase This Document
Need a fresh take? Get an instant paraphrase of this document with our AI Paraphraser
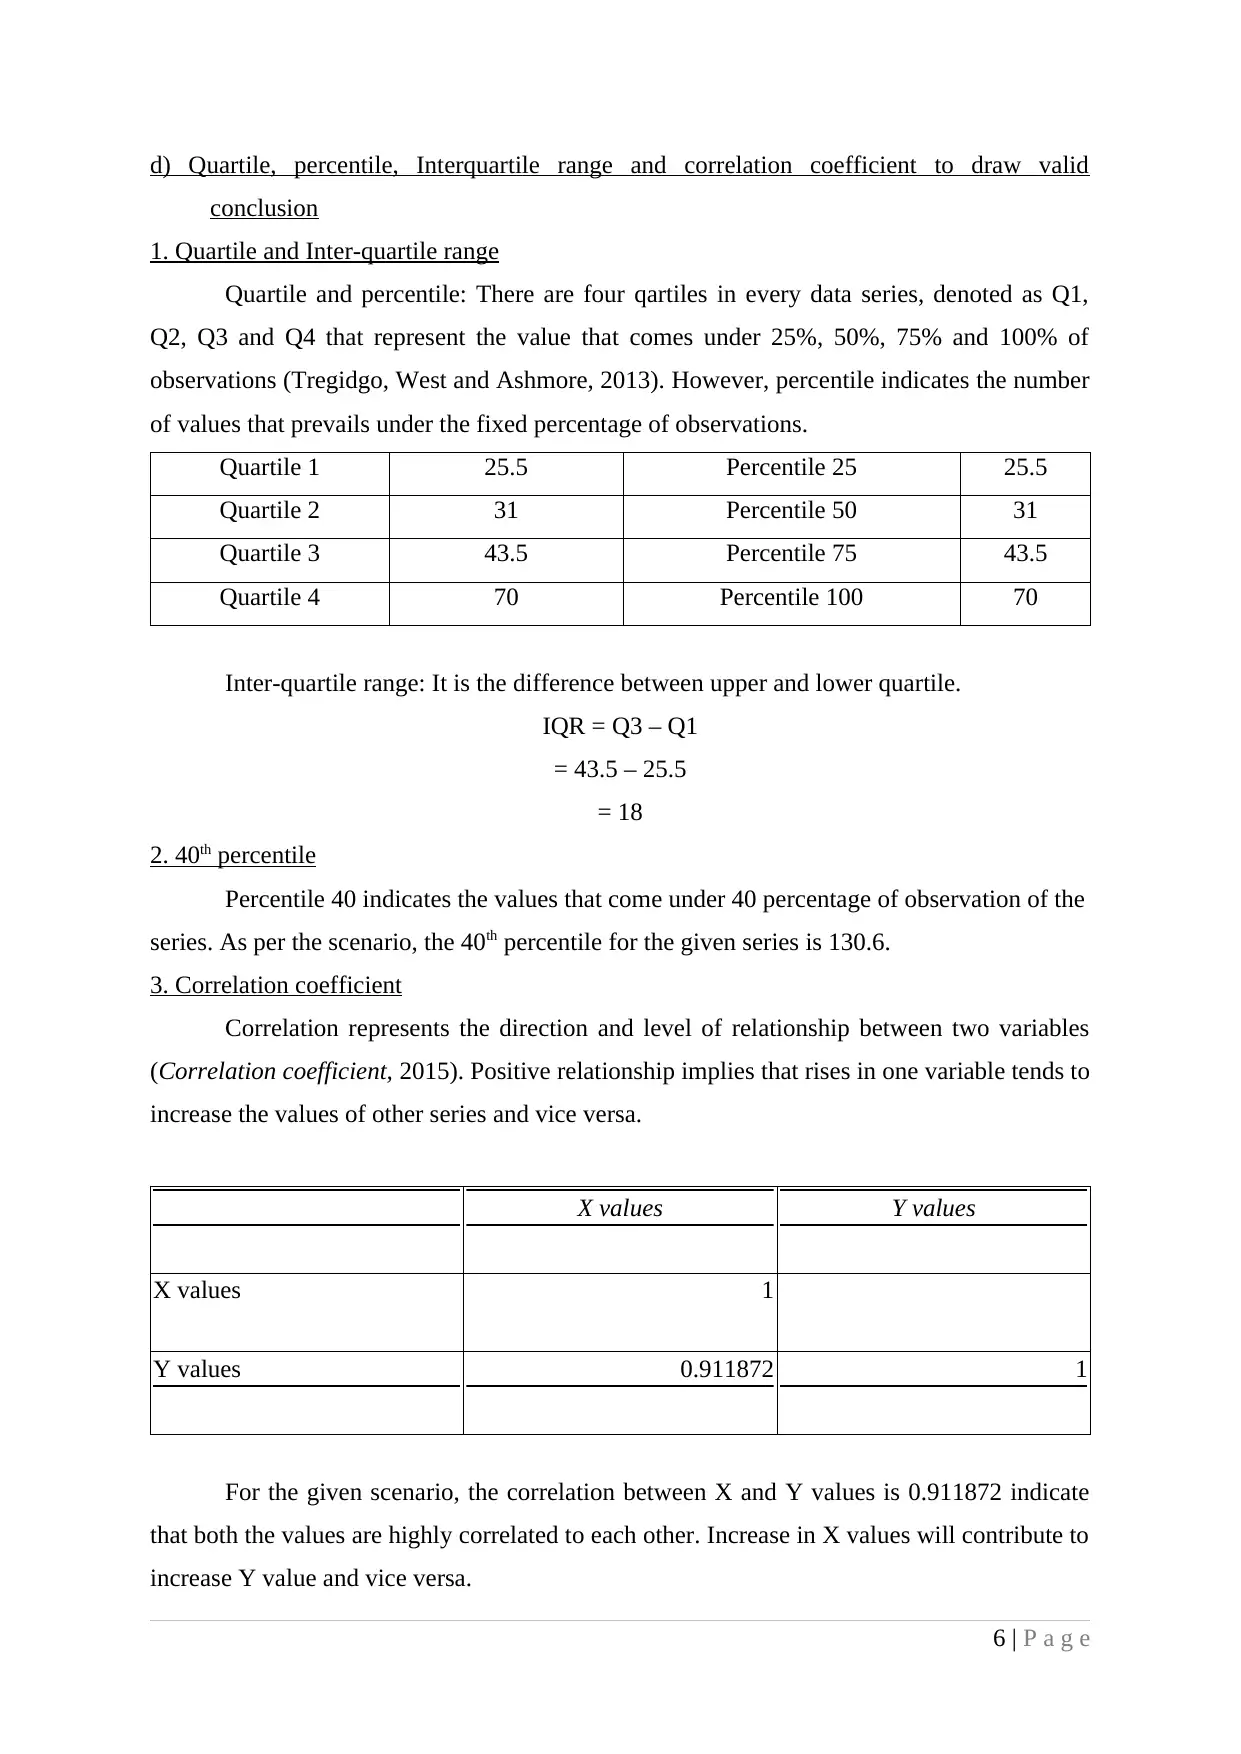
d) Quartile, percentile, Interquartile range and correlation coefficient to draw valid
conclusion
1. Quartile and Inter-quartile range
Quartile and percentile: There are four qartiles in every data series, denoted as Q1,
Q2, Q3 and Q4 that represent the value that comes under 25%, 50%, 75% and 100% of
observations (Tregidgo, West and Ashmore, 2013). However, percentile indicates the number
of values that prevails under the fixed percentage of observations.
Quartile 1 25.5 Percentile 25 25.5
Quartile 2 31 Percentile 50 31
Quartile 3 43.5 Percentile 75 43.5
Quartile 4 70 Percentile 100 70
Inter-quartile range: It is the difference between upper and lower quartile.
IQR = Q3 – Q1
= 43.5 – 25.5
= 18
2. 40th percentile
Percentile 40 indicates the values that come under 40 percentage of observation of the
series. As per the scenario, the 40th percentile for the given series is 130.6.
3. Correlation coefficient
Correlation represents the direction and level of relationship between two variables
(Correlation coefficient, 2015). Positive relationship implies that rises in one variable tends to
increase the values of other series and vice versa.
X values Y values
X values 1
Y values 0.911872 1
For the given scenario, the correlation between X and Y values is 0.911872 indicate
that both the values are highly correlated to each other. Increase in X values will contribute to
increase Y value and vice versa.
6 | P a g e
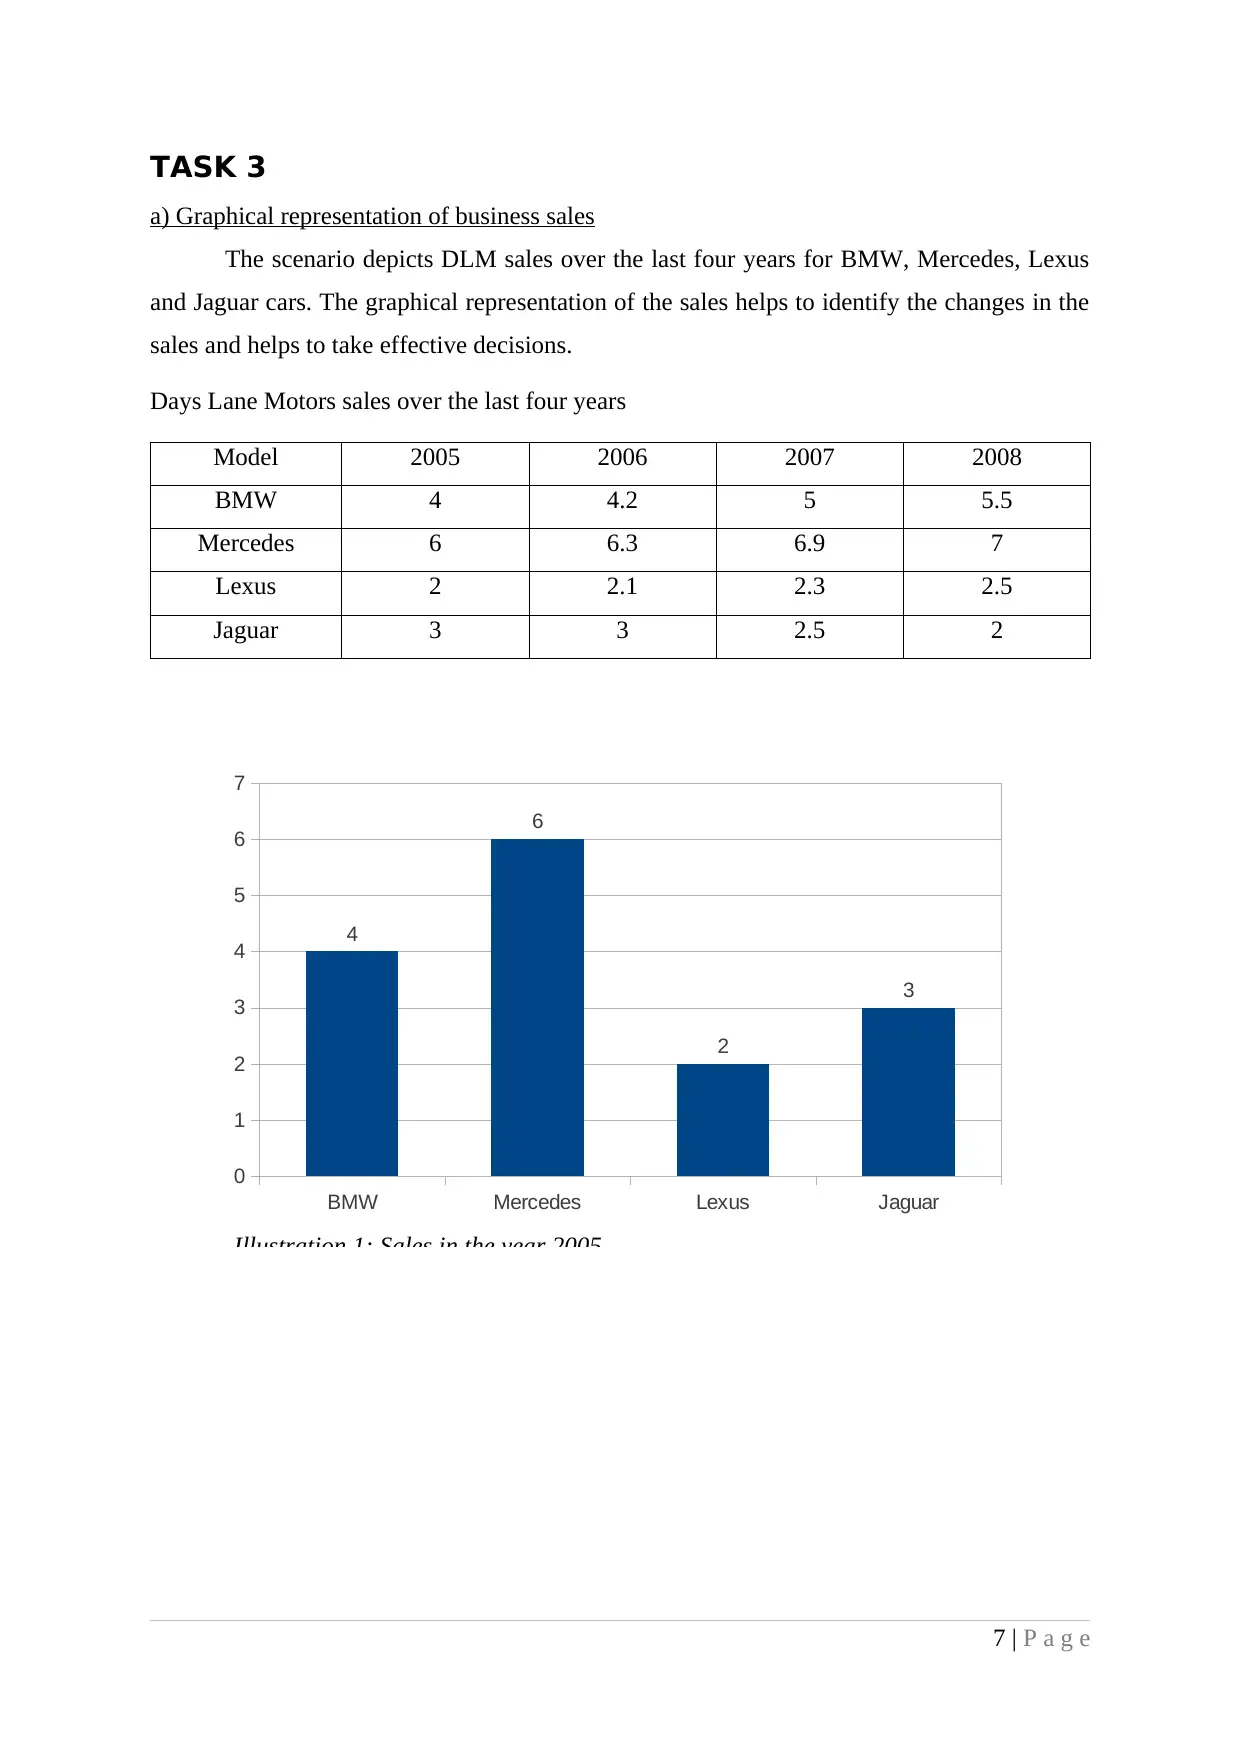
TASK 3
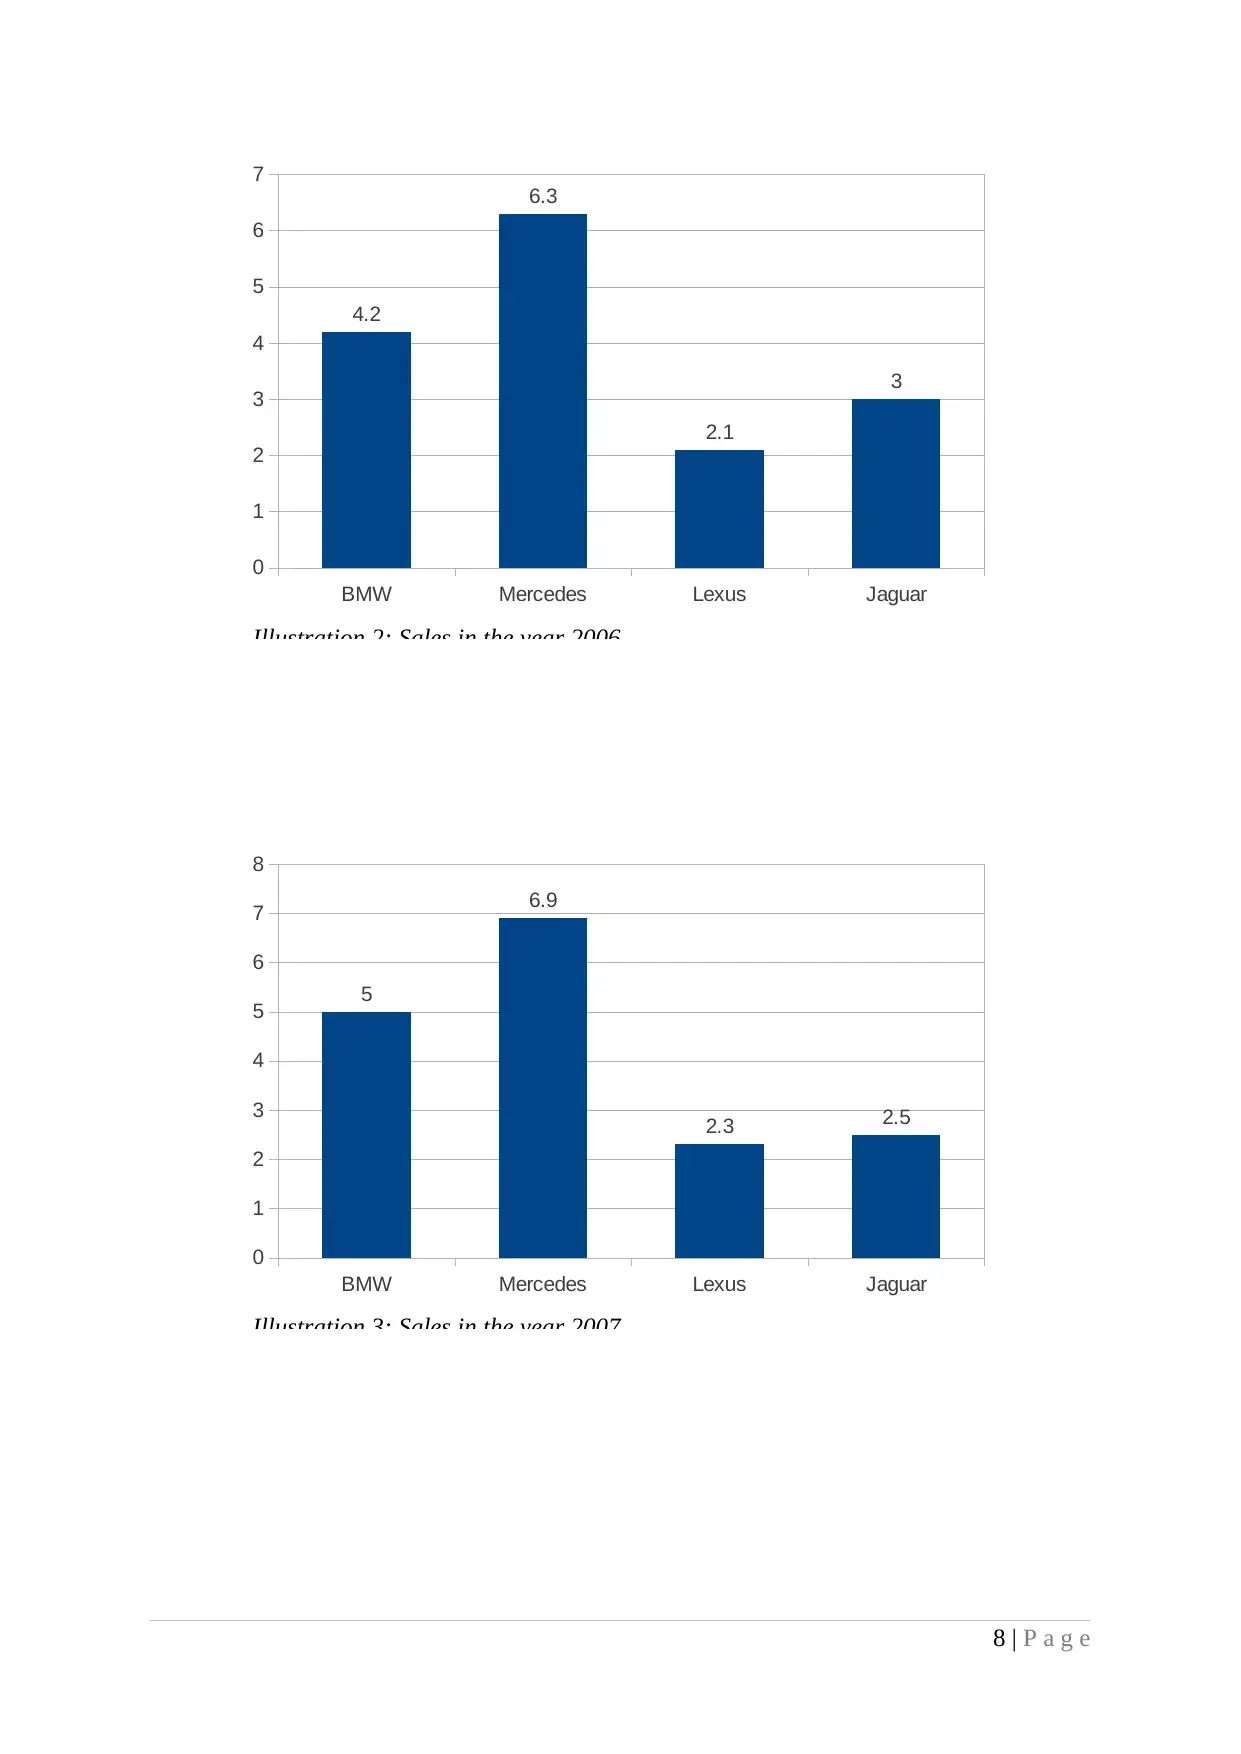
a) Graphical representation of business sales
The scenario depicts DLM sales over the last four years for BMW, Mercedes, Lexus
and Jaguar cars. The graphical representation of the sales helps to identify the changes in the
sales and helps to take effective decisions.
Days Lane Motors sales over the last four years
Model 2005 2006 2007 2008
BMW 4 4.2 5 5.5
Mercedes 6 6.3 6.9 7
Lexus 2 2.1 2.3 2.5
Jaguar 3 3 2.5 2
7 | P a g e
BMW Mercedes Lexus Jaguar
0
1
2
3
4
5
6
7
4
6
2
3
Illustration 1: Sales in the year 2005
⊘ This is a preview!⊘
Do you want full access?
Subscribe today to unlock all pages.
Trusted by 1+ million students worldwide
8 | P a g e
BMW Mercedes Lexus Jaguar
0
1
2
3
4
5
6
7
4.2
6.3
2.1
3
Illustration 2: Sales in the year 2006
BMW Mercedes Lexus Jaguar
0
1
2
3
4
5
6
7
8
5
6.9
2.3 2.5
Illustration 3: Sales in the year 2007
BMW Mercedes Lexus Jaguar
0
1
2
3
4
5
6
7
4.2
6.3
2.1
3
Illustration 2: Sales in the year 2006
BMW Mercedes Lexus Jaguar
0
1
2
3
4
5
6
7
8
5
6.9
2.3 2.5
Illustration 3: Sales in the year 2007
Paraphrase This Document
Need a fresh take? Get an instant paraphrase of this document with our AI Paraphraser
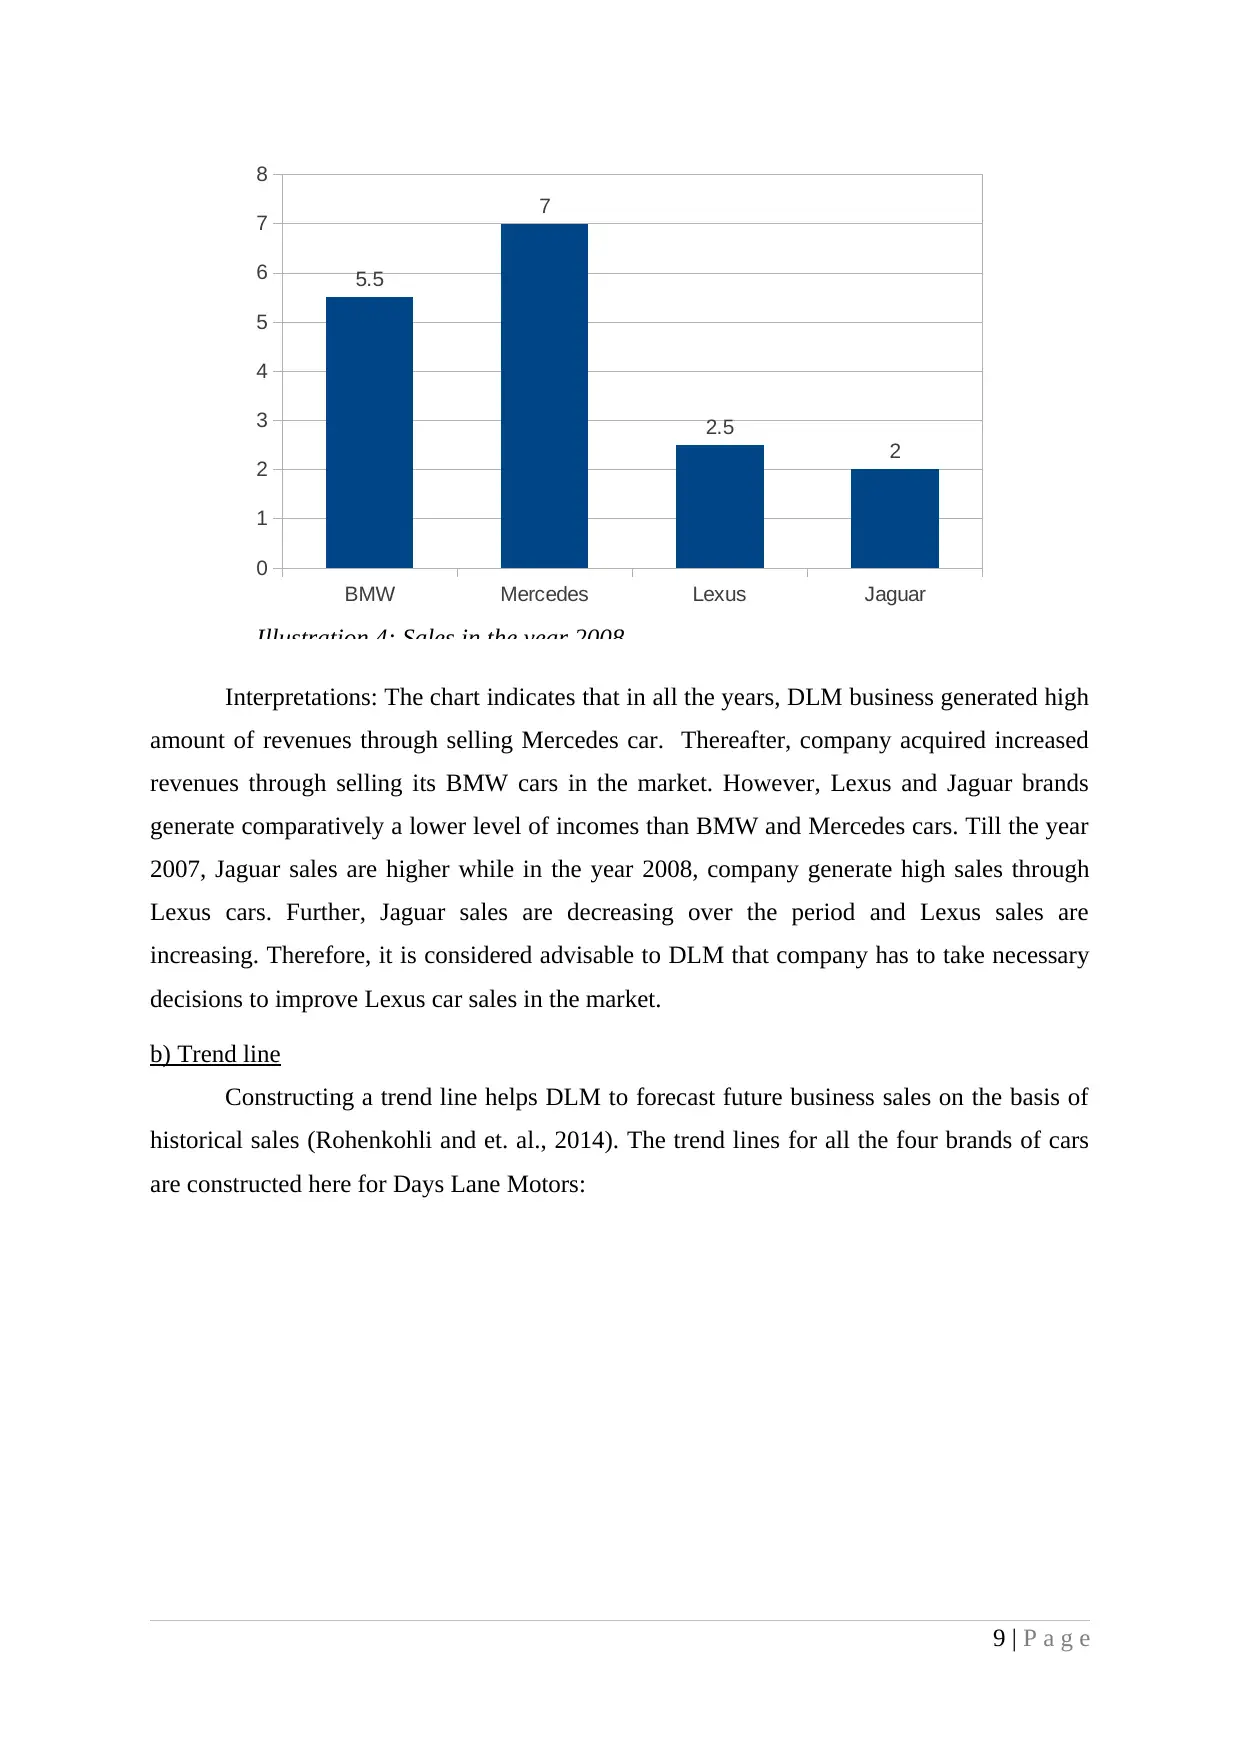
Interpretations: The chart indicates that in all the years, DLM business generated high
amount of revenues through selling Mercedes car. Thereafter, company acquired increased
revenues through selling its BMW cars in the market. However, Lexus and Jaguar brands
generate comparatively a lower level of incomes than BMW and Mercedes cars. Till the year
2007, Jaguar sales are higher while in the year 2008, company generate high sales through
Lexus cars. Further, Jaguar sales are decreasing over the period and Lexus sales are
increasing. Therefore, it is considered advisable to DLM that company has to take necessary
decisions to improve Lexus car sales in the market.
b) Trend line
Constructing a trend line helps DLM to forecast future business sales on the basis of
historical sales (Rohenkohli and et. al., 2014). The trend lines for all the four brands of cars
are constructed here for Days Lane Motors:
9 | P a g e
BMW Mercedes Lexus Jaguar
0
1
2
3
4
5
6
7
8
5.5
7
2.5
2
Illustration 4: Sales in the year 2008
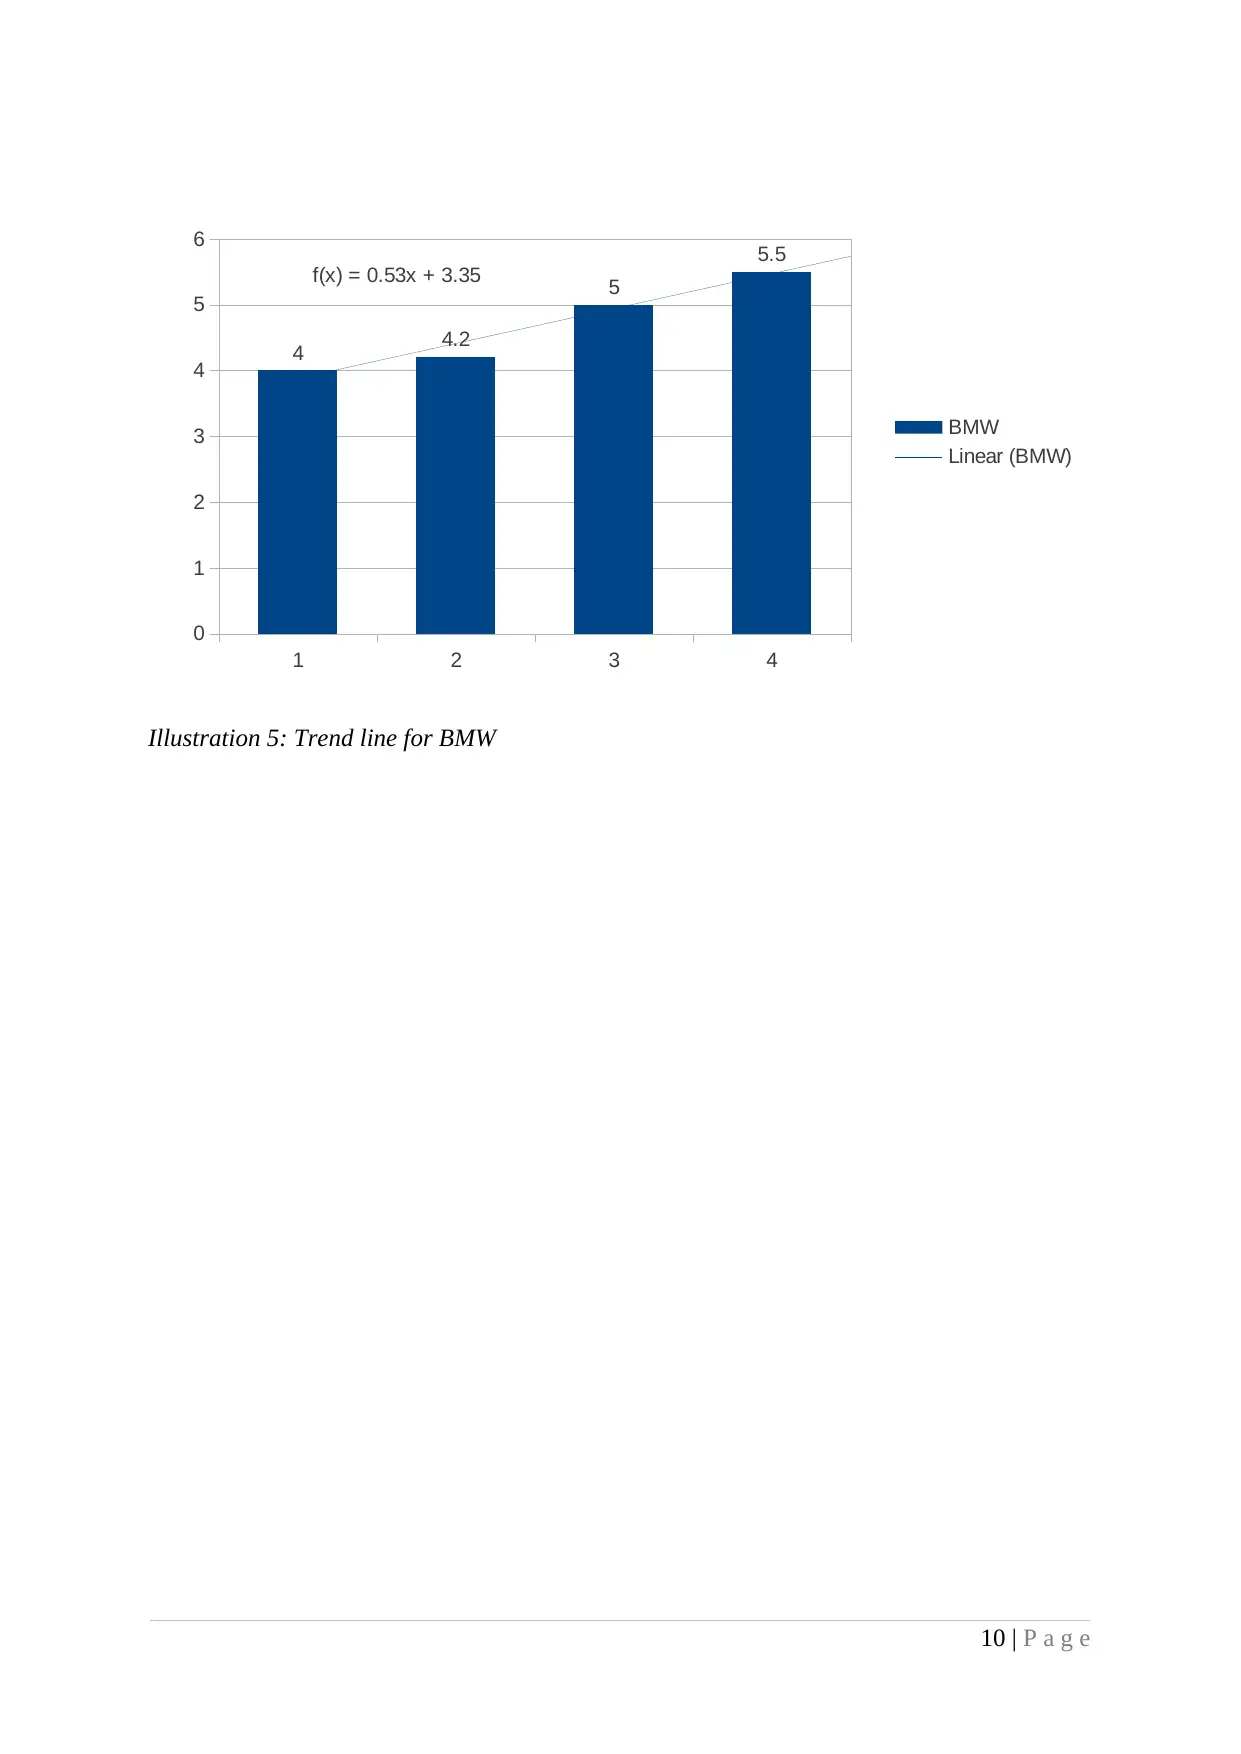
10 | P a g e
1 2 3 4
0
1
2
3
4
5
6
4 4.2
5
5.5
f(x) = 0.53x + 3.35
BMW
Linear (BMW)
Illustration 5: Trend line for BMW
1 2 3 4
0
1
2
3
4
5
6
4 4.2
5
5.5
f(x) = 0.53x + 3.35
BMW
Linear (BMW)
Illustration 5: Trend line for BMW
⊘ This is a preview!⊘
Do you want full access?
Subscribe today to unlock all pages.
Trusted by 1+ million students worldwide
1 out of 21
Related Documents


Your All-in-One AI-Powered Toolkit for Academic Success.
+13062052269
info@desklib.com
Available 24*7 on WhatsApp / Email
![[object Object]](/_next/static/media/star-bottom.7253800d.svg)
Unlock your academic potential
Copyright © 2020–2026 A2Z Services. All Rights Reserved. Developed and managed by ZUCOL.