Business Decision Making Project: Data Analysis and Strategies
VerifiedAdded on 2020/01/28
|17
|4273
|77
Project
AI Summary
This project delves into the core principles of business decision-making, encompassing the collection of primary and secondary data through strategic planning. It explores survey methodologies, questionnaire design, and the creation of informative datasets for analysis. The project utilizes measures of dispersion, quartiles, percentiles, and correlation coefficients to draw valid business conclusions. Furthermore, it demonstrates the use of spreadsheets to generate graphs and trend lines, alongside project planning and financial tools. The project emphasizes critical evaluation, innovative ideas, and effective communication of findings, culminating in a comprehensive analysis of financial viability and strategic decision-making processes. The project covers data analysis, questionnaire design, and project planning to enhance business decision-making skills. The project analyzes financial viability and strategic decision-making processes.

BUSINESS DECISION
MAKING
MAKING
Paraphrase This Document
Need a fresh take? Get an instant paraphrase of this document with our AI Paraphraser
Table of Contents
INTRODUCTION...........................................................................................................................3
TASK 1............................................................................................................................................3
1.1 Creation of a plan for the collection of primary and secondary data...............................3
M 1 Identification of strategies to find appropriate solution..................................................4
D 2 Responsibility for managing and organizing activities...................................................4
1.2 Survey methodology with appropriate sampling frame and strategy...............................5
1.3 Design a questionnaire for the give problem of the company:.........................................5
TASK 2............................................................................................................................................5
2.1 Create information for decision making...........................................................................5
2.2 Analyse the results to draw valid conclusions in a business context...............................8
2.3 Analysation using measures of dispersion.......................................................................9
M 2 Design and apply appropriate methods and techniques..................................................9
D1 Critical evaluation on own work and justification............................................................9
2.4 Quartiles, percentiles, and the correlation coefficient....................................................10
TASK 3..........................................................................................................................................10
3.1 Produce graphs using spreadsheets..........................................................................................10
3.2 Create trend lines in spreadsheet graphs ......................................................................12
M 3 Present and communicate appropriate findings............................................................13
3.3 Covered in ppt ...............................................................................................................13
TASK 4 .........................................................................................................................................14
4.1 Use appropriate information processing tools................................................................14
4.2 Preparation of project plan and determination of critical path ......................................15
4.3 Use financial tools for decision making.........................................................................16
D 3 Demonstration of innovative and creative ideas applied in analysing the financial viability
..............................................................................................................................................17
CONCLUSION..............................................................................................................................17
REFERENCES .............................................................................................................................18
INTRODUCTION
A decision making is a term describe as a course of action specifically selected from a
various alternatives to achieve their organizational goals and targets. Basically overall business is
depend upon the effective decision of an entrepreneur which means decision making is a very
indispensable part and continuous for the business activities. Mainly business decision making is
all about collection of appropriate data either from secondary or primary which act as very useful
while decision making process (Ho, 2010). In other words business decision making explains all
the necessary factors whatever is required while making useful decision for the betterment of
enterprise. In addition a perfect and appropriate plan must required for the organization just to
take correct decision with the help of various graphs, pie-charts and by using various useful data
or information in business decision making. So the business decision making is all about taking
of a useful decision for the organization.
TASK 1
1.1 Creation of a plan for the collection of primary and secondary data
Planning is a term by which an organization can easily meet their organization objectives
by making effective plans to avoid various upcoming mistakes and errors which may occur while
planning period. Primary and secondary data are the various sources by which an organization
can easily collect relevant data and information (Dey, 2010).
Primary data are also known as first hand information which means the information
collected by researcher itself and it also known real time data. In fact this data are based on
personal experiences and observations to get accurate results.
Whereas secondary data are known as second hand data collected by other person for the
use of business to make effective decision. Secondary data can save the time of a an organization
because they are already find by other member for example literatures, evidences, social sciences
or any past records (Li, 2010).
Effective plan for data collection:-
Identify the indispensable topic of data collection
Create an appropriate
Select the type of research
follow the steps
⊘ This is a preview!⊘
Do you want full access?
Subscribe today to unlock all pages.
Trusted by 1+ million students worldwide
Analysis
Evaluate
Implement and execute the plan by using the relevant data.
Primary and secondary data both the methods are very much different from each other
because both are collected from different sources due to their features.
Source of a primary data:-
Conduct research or investigation programmes.
Personal interviews.
Past artefacts, pictures and symbols.
Eyewitness.
Sources of secondary data:-
Literatures written by scholars.
Magazines, newspapers,
Past records of universities, foundations.
Social media as well as trade associations.
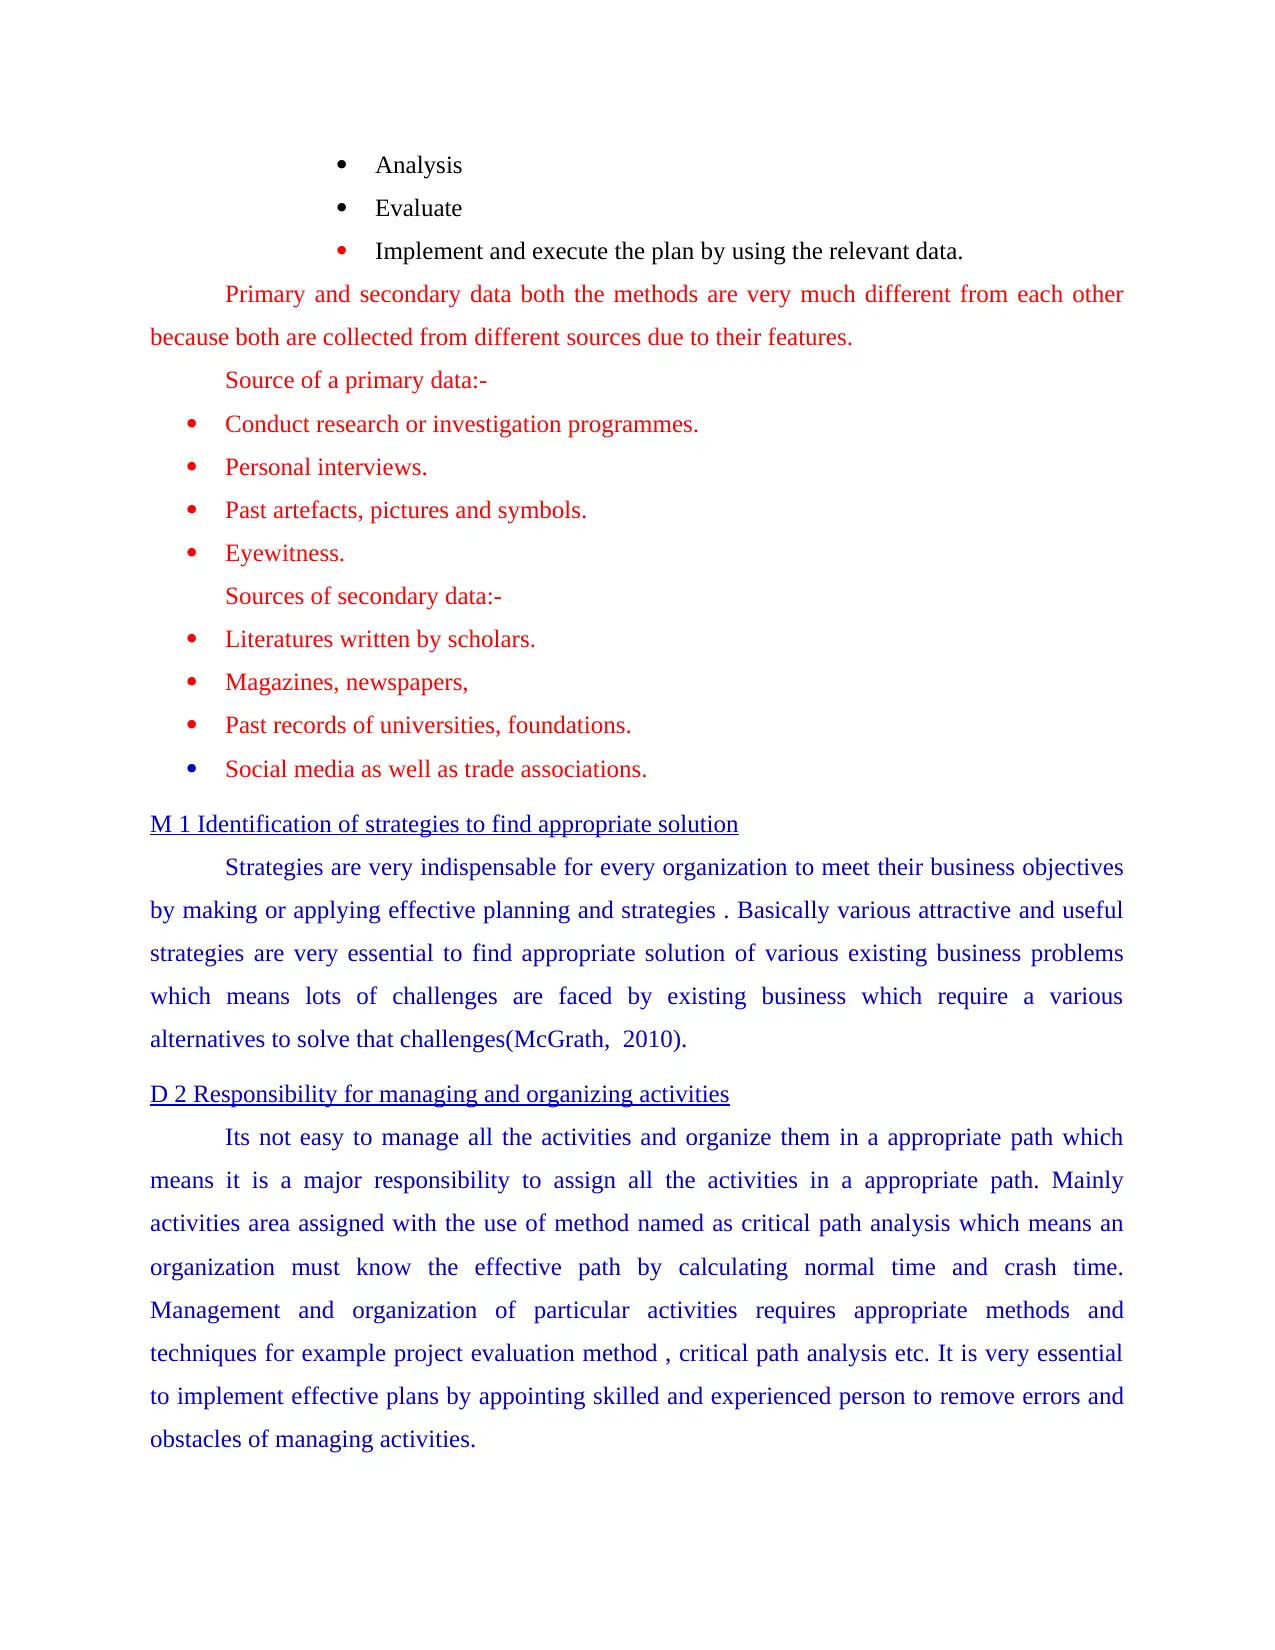
M 1 Identification of strategies to find appropriate solution
Strategies are very indispensable for every organization to meet their business objectives
by making or applying effective planning and strategies . Basically various attractive and useful
strategies are very essential to find appropriate solution of various existing business problems
which means lots of challenges are faced by existing business which require a various
alternatives to solve that challenges(McGrath, 2010).
D 2 Responsibility for managing and organizing activities
Its not easy to manage all the activities and organize them in a appropriate path which
means it is a major responsibility to assign all the activities in a appropriate path. Mainly
activities area assigned with the use of method named as critical path analysis which means an
organization must know the effective path by calculating normal time and crash time.
Management and organization of particular activities requires appropriate methods and
techniques for example project evaluation method , critical path analysis etc. It is very essential
to implement effective plans by appointing skilled and experienced person to remove errors and
obstacles of managing activities.
Evaluate
Implement and execute the plan by using the relevant data.
Primary and secondary data both the methods are very much different from each other
because both are collected from different sources due to their features.
Source of a primary data:-
Conduct research or investigation programmes.
Personal interviews.
Past artefacts, pictures and symbols.
Eyewitness.
Sources of secondary data:-
Literatures written by scholars.
Magazines, newspapers,
Past records of universities, foundations.
Social media as well as trade associations.
M 1 Identification of strategies to find appropriate solution
Strategies are very indispensable for every organization to meet their business objectives
by making or applying effective planning and strategies . Basically various attractive and useful
strategies are very essential to find appropriate solution of various existing business problems
which means lots of challenges are faced by existing business which require a various
alternatives to solve that challenges(McGrath, 2010).
D 2 Responsibility for managing and organizing activities
Its not easy to manage all the activities and organize them in a appropriate path which
means it is a major responsibility to assign all the activities in a appropriate path. Mainly
activities area assigned with the use of method named as critical path analysis which means an
organization must know the effective path by calculating normal time and crash time.
Management and organization of particular activities requires appropriate methods and
techniques for example project evaluation method , critical path analysis etc. It is very essential
to implement effective plans by appointing skilled and experienced person to remove errors and
obstacles of managing activities.
Paraphrase This Document
Need a fresh take? Get an instant paraphrase of this document with our AI Paraphraser
1.2 Survey methodology with appropriate sampling frame and strategy
Research methodology is the term which means to find a relevant information by
adopting various effective strategy to attain their goals. Basically research methodology express
the overall advantages and disadvantages applied in the above data collection plan. In fact
sampling is one of the very effective and useful technique applied by the organization to gather
useful information to make use them in the business. Sampling frame is a word or is a source by
which an enterprise can select an appropriate alternatives from a large one which means
sampling frame is a method of sudden selection from various data ( Burritt, 2010).
In fact with the help of sampling method an organization can easily gather qualitative and
quantitative data according to the requirement in business process. Basically which means survey
is mainly shows all the essentials technique and method which is useful while making plans by
considering all the factors like consumer products, preferences, attitude and buying behaviour of
their customers as well as products of their competitors(Smith, 2010).
1.3 Design a questionnaire for the give problem of the company:
Q.1 From where the customers got to know about the company?
(a) Social media (b) Print media
Q.2 Are customers satisfied with the services of the company?
(a)yes (b) no
Q.3 Is the cost of the cited company is equal to the other companies?
(a)yes (b)no
Q.4 Does the company provide customers with extra benefits?
(a)yes (b)no
TASK 2
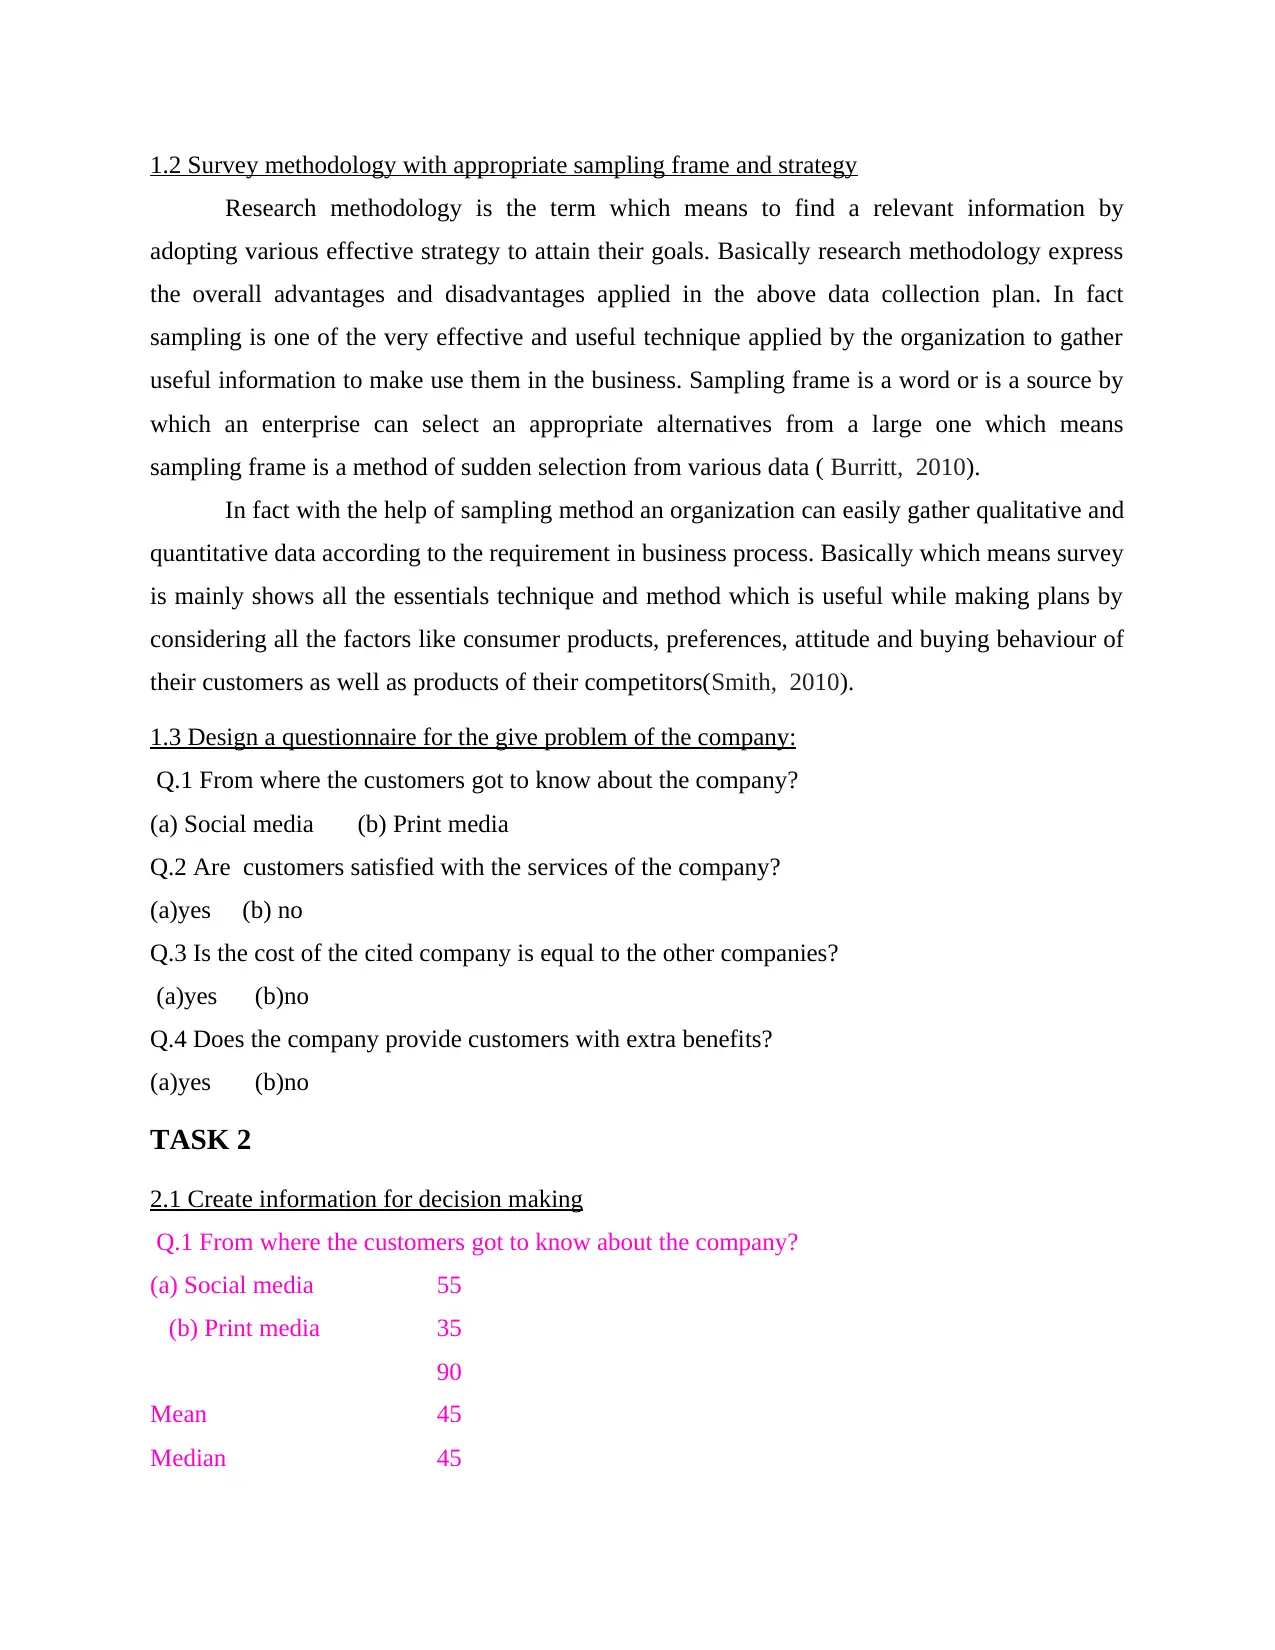
2.1 Create information for decision making
Q.1 From where the customers got to know about the company?
(a) Social media 55
(b) Print media 35
90
Mean 45
Median 45
Research methodology is the term which means to find a relevant information by
adopting various effective strategy to attain their goals. Basically research methodology express
the overall advantages and disadvantages applied in the above data collection plan. In fact
sampling is one of the very effective and useful technique applied by the organization to gather
useful information to make use them in the business. Sampling frame is a word or is a source by
which an enterprise can select an appropriate alternatives from a large one which means
sampling frame is a method of sudden selection from various data ( Burritt, 2010).
In fact with the help of sampling method an organization can easily gather qualitative and
quantitative data according to the requirement in business process. Basically which means survey
is mainly shows all the essentials technique and method which is useful while making plans by
considering all the factors like consumer products, preferences, attitude and buying behaviour of
their customers as well as products of their competitors(Smith, 2010).
1.3 Design a questionnaire for the give problem of the company:
Q.1 From where the customers got to know about the company?
(a) Social media (b) Print media
Q.2 Are customers satisfied with the services of the company?
(a)yes (b) no
Q.3 Is the cost of the cited company is equal to the other companies?
(a)yes (b)no
Q.4 Does the company provide customers with extra benefits?
(a)yes (b)no
TASK 2
2.1 Create information for decision making
Q.1 From where the customers got to know about the company?
(a) Social media 55
(b) Print media 35
90
Mean 45
Median 45
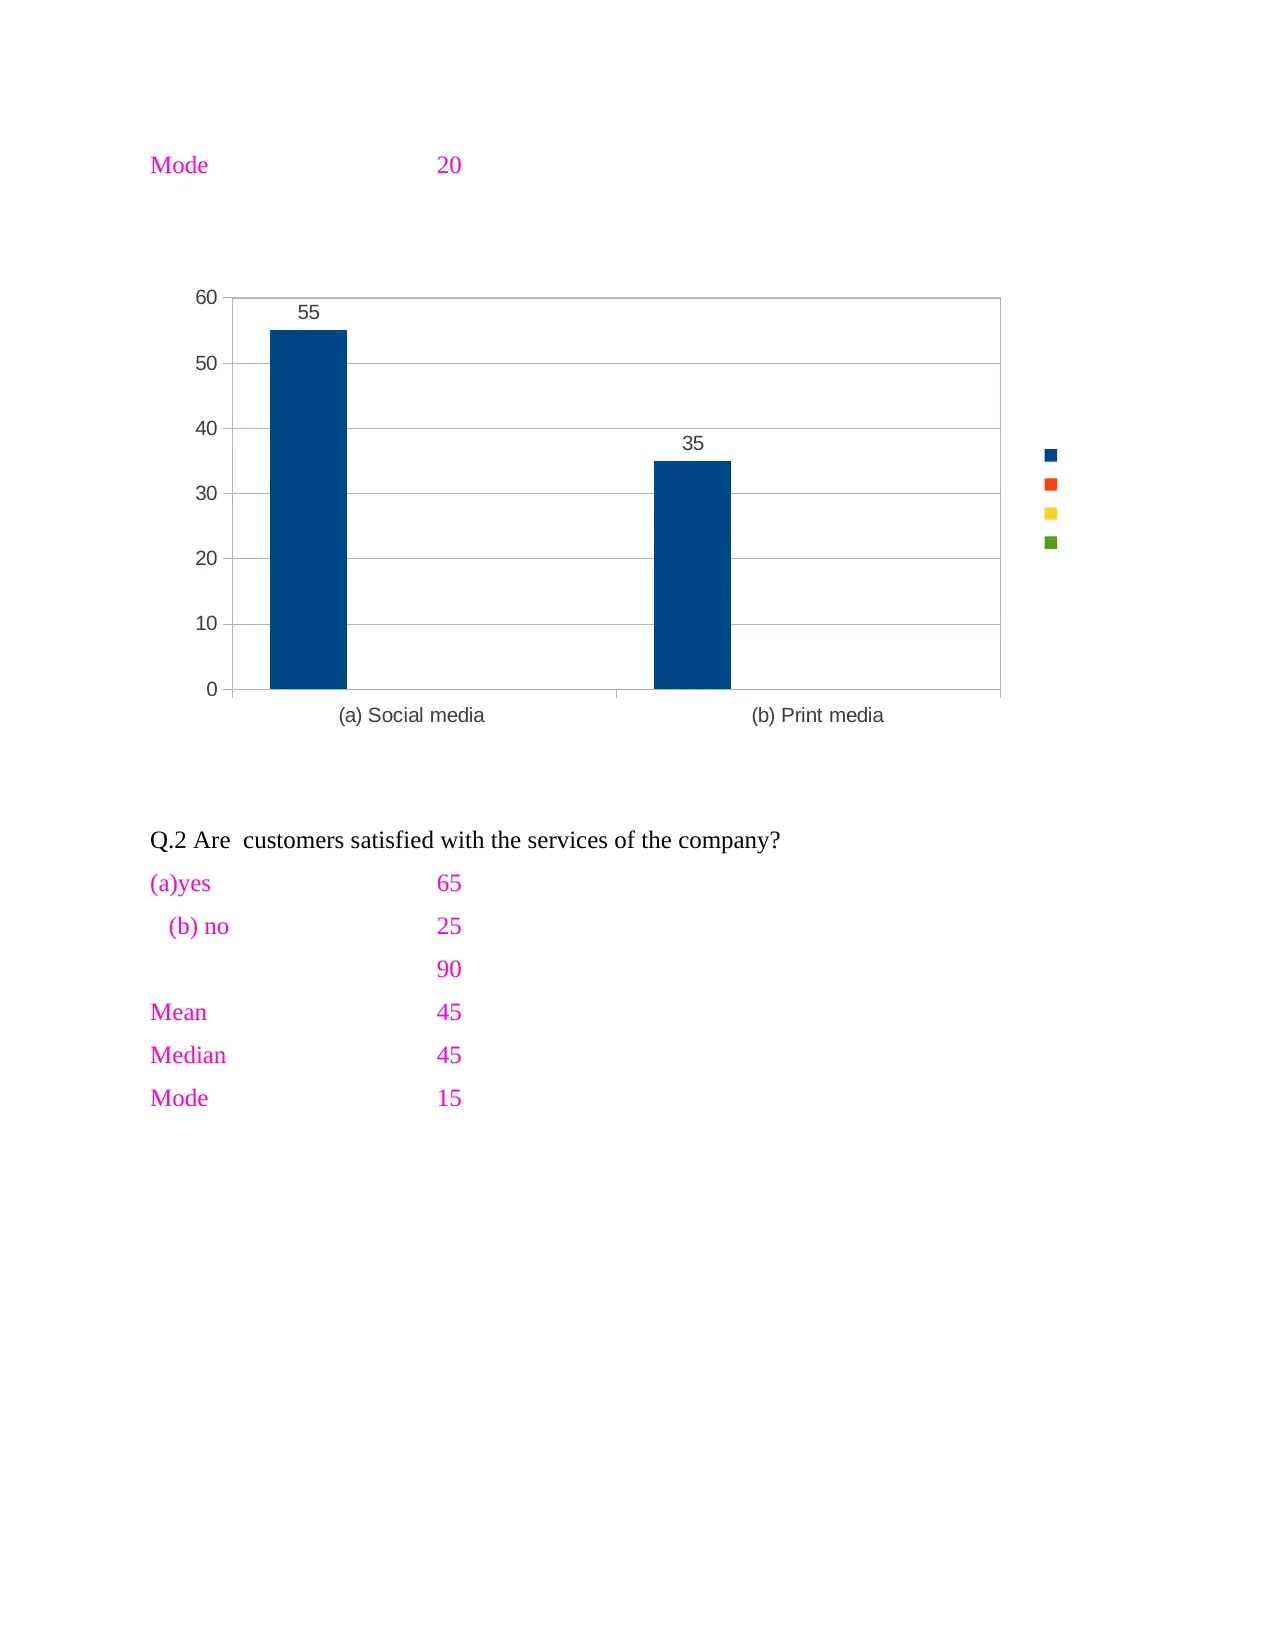
Mode 20
(a) Social media (b) Print media
0
10
20
30
40
50
60 55
35
Q.2 Are customers satisfied with the services of the company?
(a)yes 65
(b) no 25
90
Mean 45
Median 45
Mode 15
(a) Social media (b) Print media
0
10
20
30
40
50
60 55
35
Q.2 Are customers satisfied with the services of the company?
(a)yes 65
(b) no 25
90
Mean 45
Median 45
Mode 15
⊘ This is a preview!⊘
Do you want full access?
Subscribe today to unlock all pages.
Trusted by 1+ million students worldwide
65
25
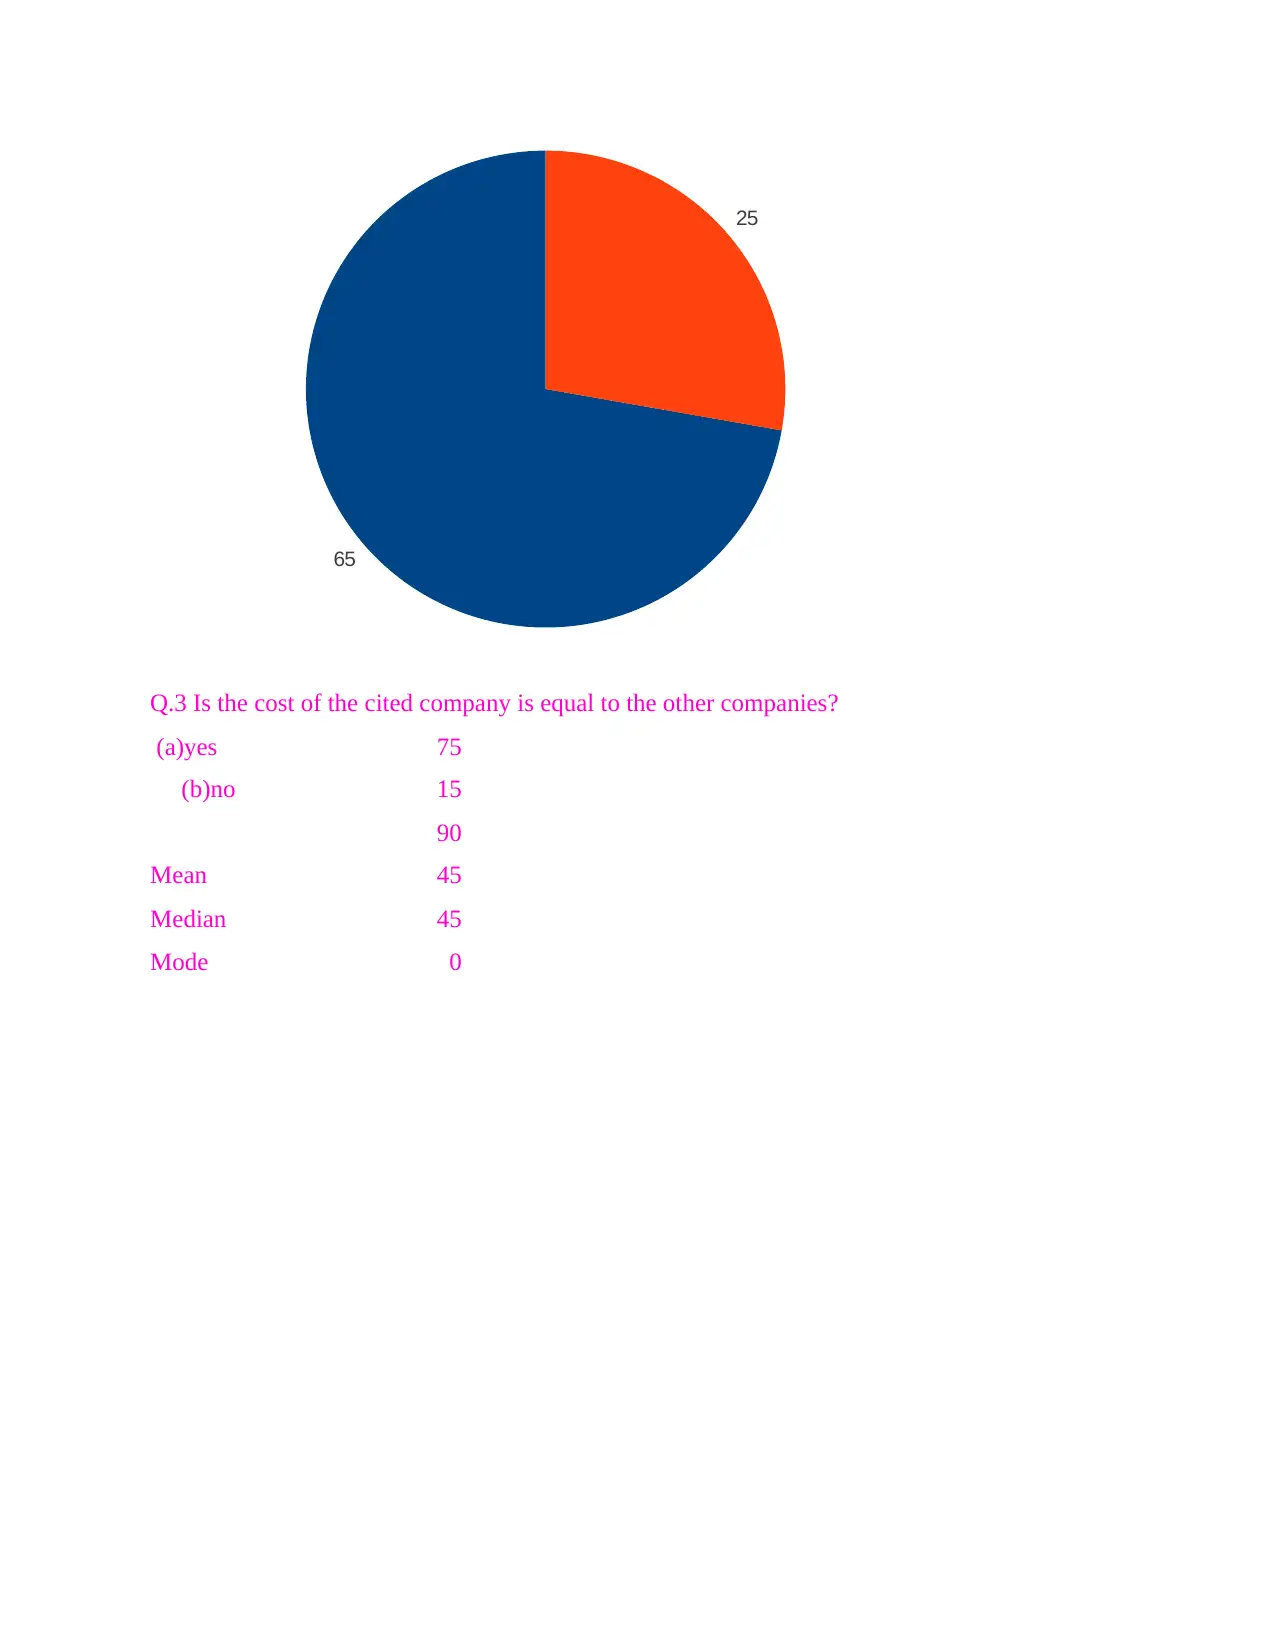
Q.3 Is the cost of the cited company is equal to the other companies?
(a)yes 75
(b)no 15
90
Mean 45
Median 45
Mode 0
25
Q.3 Is the cost of the cited company is equal to the other companies?
(a)yes 75
(b)no 15
90
Mean 45
Median 45
Mode 0
Paraphrase This Document
Need a fresh take? Get an instant paraphrase of this document with our AI Paraphraser
(a)yes (b)no
0
10
20
30
40
50
60
70
80 75
15
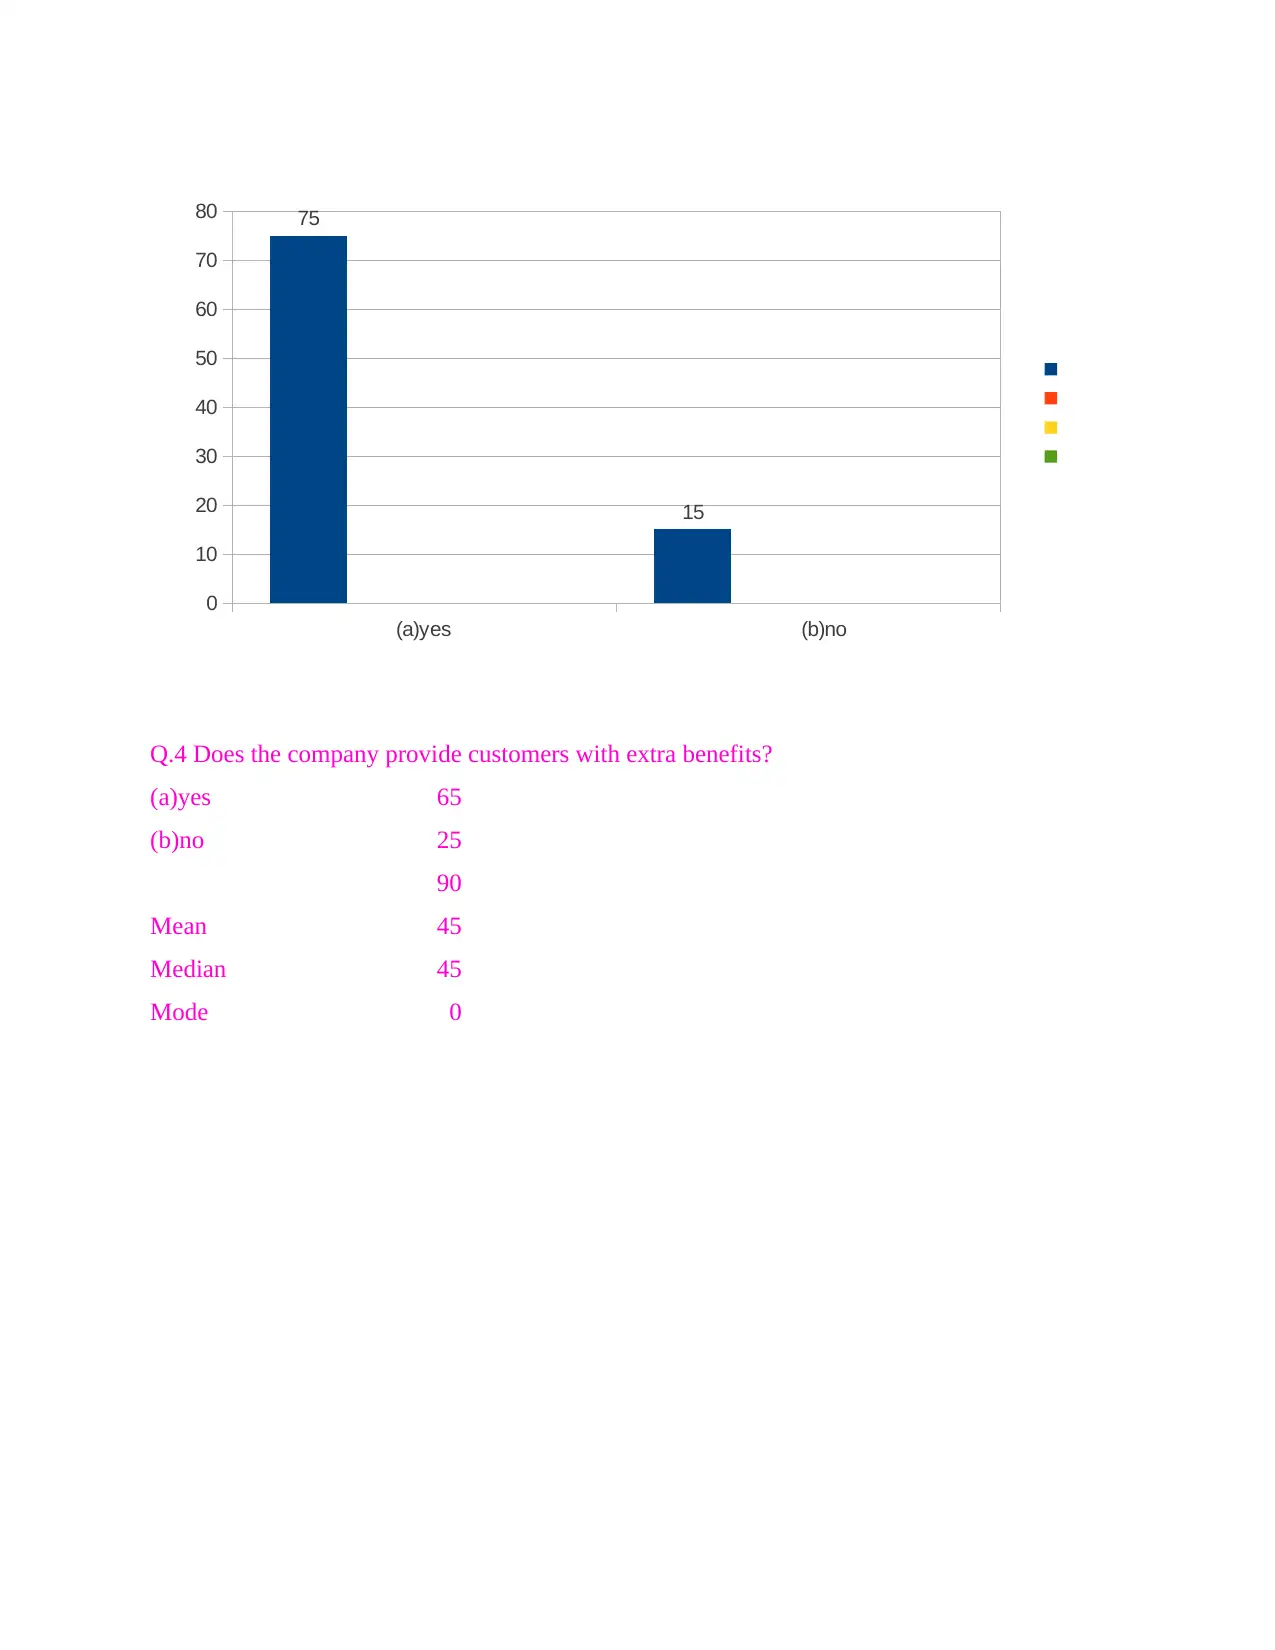
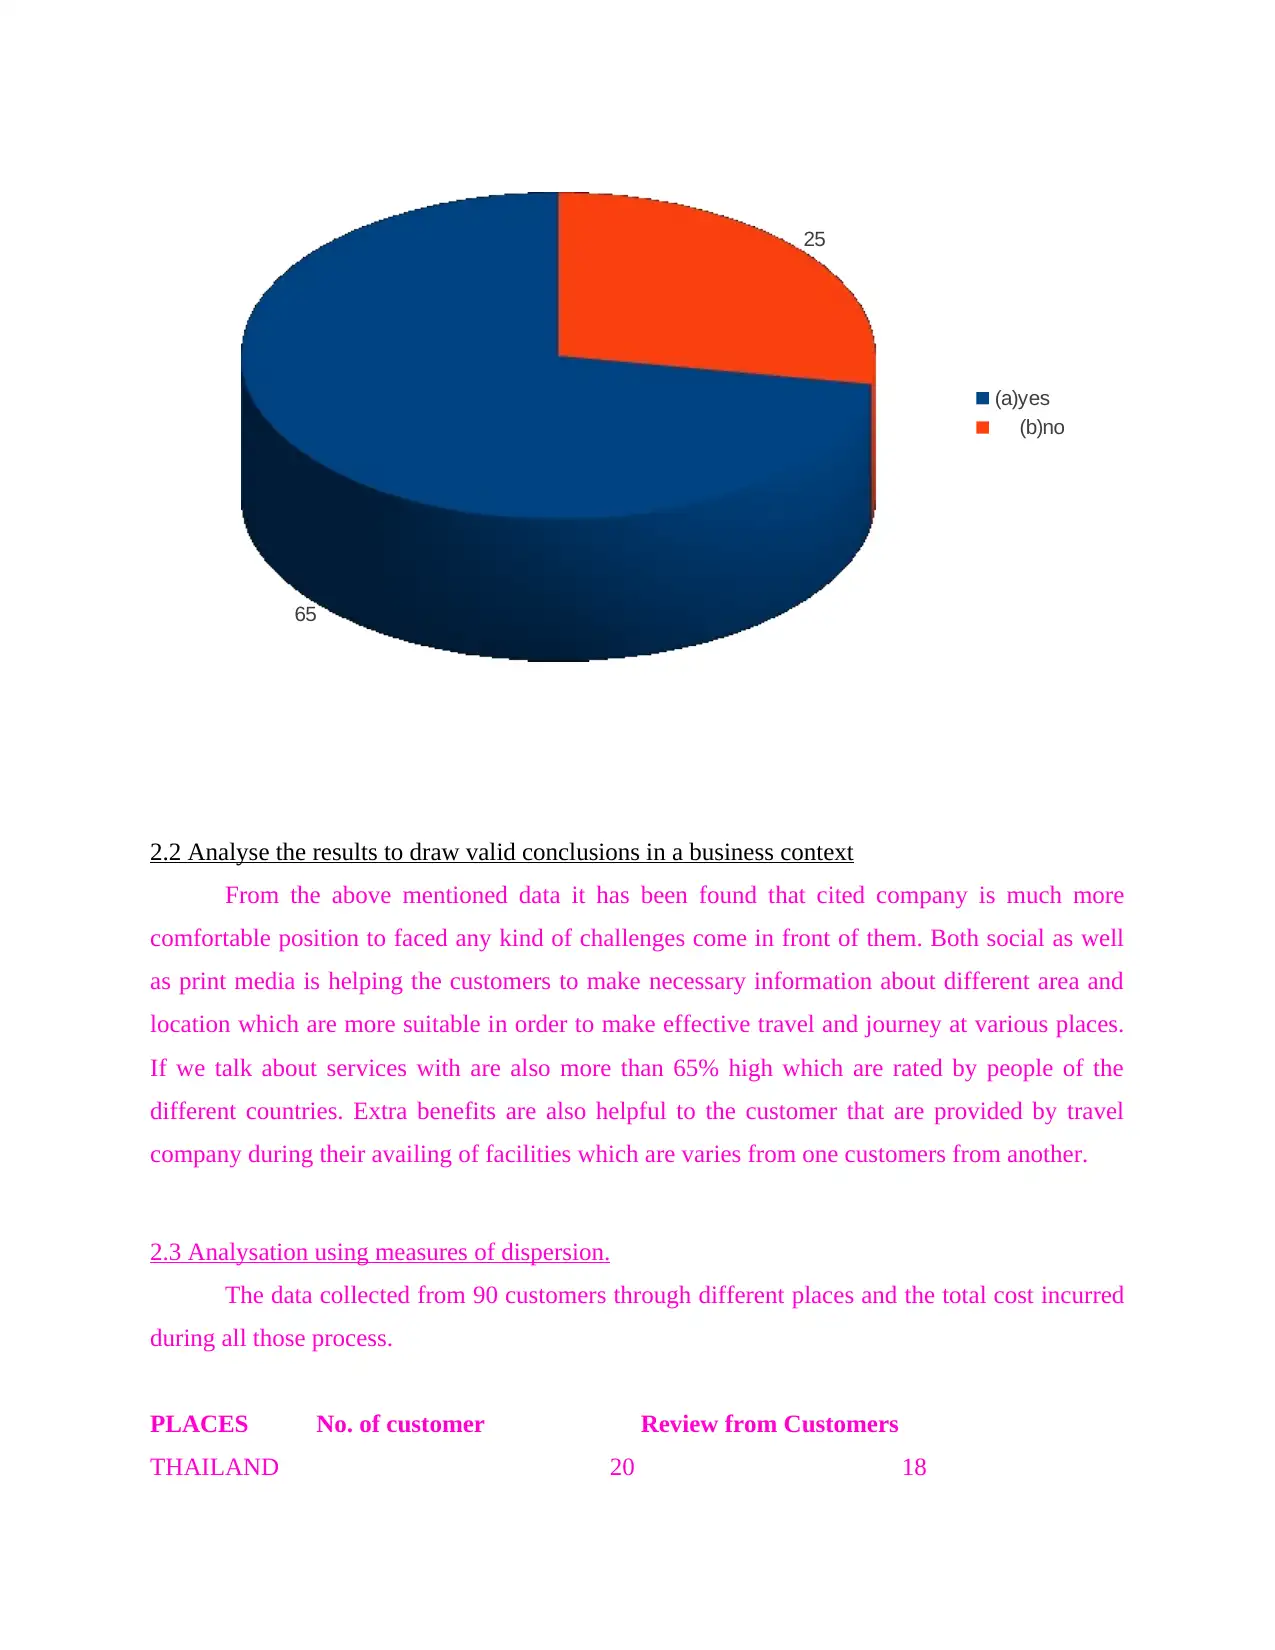
Q.4 Does the company provide customers with extra benefits?
(a)yes 65
(b)no 25
90
Mean 45
Median 45
Mode 0
0
10
20
30
40
50
60
70
80 75
15
Q.4 Does the company provide customers with extra benefits?
(a)yes 65
(b)no 25
90
Mean 45
Median 45
Mode 0
65
25
(a)yes
(b)no
2.2 Analyse the results to draw valid conclusions in a business context
From the above mentioned data it has been found that cited company is much more
comfortable position to faced any kind of challenges come in front of them. Both social as well
as print media is helping the customers to make necessary information about different area and
location which are more suitable in order to make effective travel and journey at various places.
If we talk about services with are also more than 65% high which are rated by people of the
different countries. Extra benefits are also helpful to the customer that are provided by travel
company during their availing of facilities which are varies from one customers from another.
2.3 Analysation using measures of dispersion.
The data collected from 90 customers through different places and the total cost incurred
during all those process.
PLACES No. of customer Review from Customers
THAILAND 20 18
⊘ This is a preview!⊘
Do you want full access?
Subscribe today to unlock all pages.
Trusted by 1+ million students worldwide
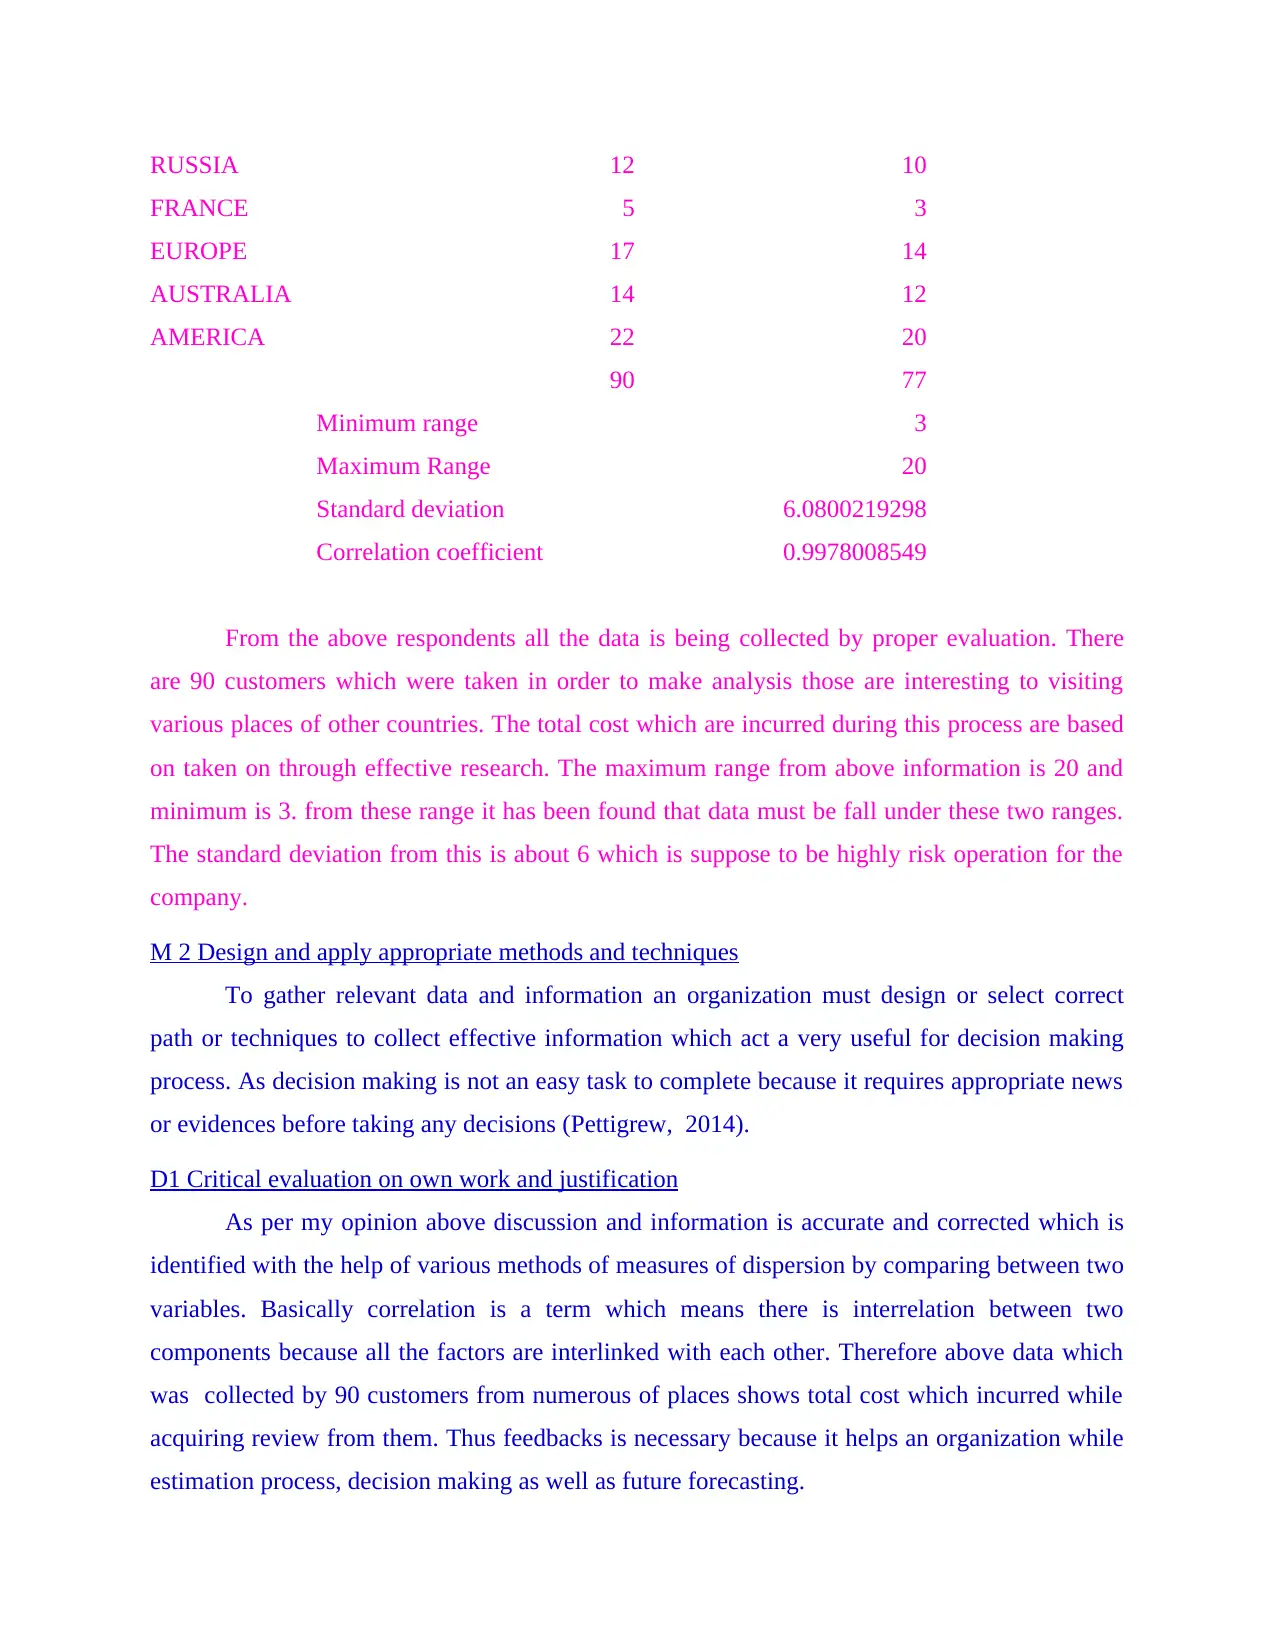
RUSSIA 12 10
FRANCE 5 3
EUROPE 17 14
AUSTRALIA 14 12
AMERICA 22 20
90 77
Minimum range 3
Maximum Range 20
Standard deviation 6.0800219298
Correlation coefficient 0.9978008549
From the above respondents all the data is being collected by proper evaluation. There
are 90 customers which were taken in order to make analysis those are interesting to visiting
various places of other countries. The total cost which are incurred during this process are based
on taken on through effective research. The maximum range from above information is 20 and
minimum is 3. from these range it has been found that data must be fall under these two ranges.
The standard deviation from this is about 6 which is suppose to be highly risk operation for the
company.
M 2 Design and apply appropriate methods and techniques
To gather relevant data and information an organization must design or select correct
path or techniques to collect effective information which act a very useful for decision making
process. As decision making is not an easy task to complete because it requires appropriate news
or evidences before taking any decisions (Pettigrew, 2014).
D1 Critical evaluation on own work and justification
As per my opinion above discussion and information is accurate and corrected which is
identified with the help of various methods of measures of dispersion by comparing between two
variables. Basically correlation is a term which means there is interrelation between two
components because all the factors are interlinked with each other. Therefore above data which
was collected by 90 customers from numerous of places shows total cost which incurred while
acquiring review from them. Thus feedbacks is necessary because it helps an organization while
estimation process, decision making as well as future forecasting.
Paraphrase This Document
Need a fresh take? Get an instant paraphrase of this document with our AI Paraphraser
2.4 Quartiles, percentiles, and the correlation coefficient
Quartile- These are the three points which help in splinting the total data into four equal
parts. Quartile is also a type of quantile. The first quartile splits the lowest 25% of data from the
other highest 75%. The second quartile divides divides the total data into half and the last
quartile divides the highest of 25% of data from the other lowest of 75%.The other is the fourth
quartile which represents 100% value of the data.
Percentiles: This indicates the total percentage of the distribution that is equal to or
below hundred. Seventy five is considered as the above normal percentile and percentile
between twenty five and seventy five is considered as normal and the less than the twenty five is
considered as below normal.
Co relation Coefficient – It tells how well the regression is representing in the data. All
the variations if crossing through the all points it is said that the regression is presented well. If
the data is scatter from the points than it tells the total variations in the same data.
Semi quartile range is the measurement done of the spread or the dispersion values. This
is effected by the extreme score therefore this makes it a good measure of spread for the skewed
data(Wu, and Pagell 2011). From the above data a clear idea of the semi inter quartile range is
make out as it is 20 for the given observation.
TASK 3
3.1 Produce graphs using spreadsheets
Bar graph:
THAILAND
RUSSIA
FRANCE
EUROPE
AUSTRALIA
AMERICA
0 5000 10000 15000 20000 25000
5253
5265
10212
22562
14256
19356
Cost (in pound)
no. of customer
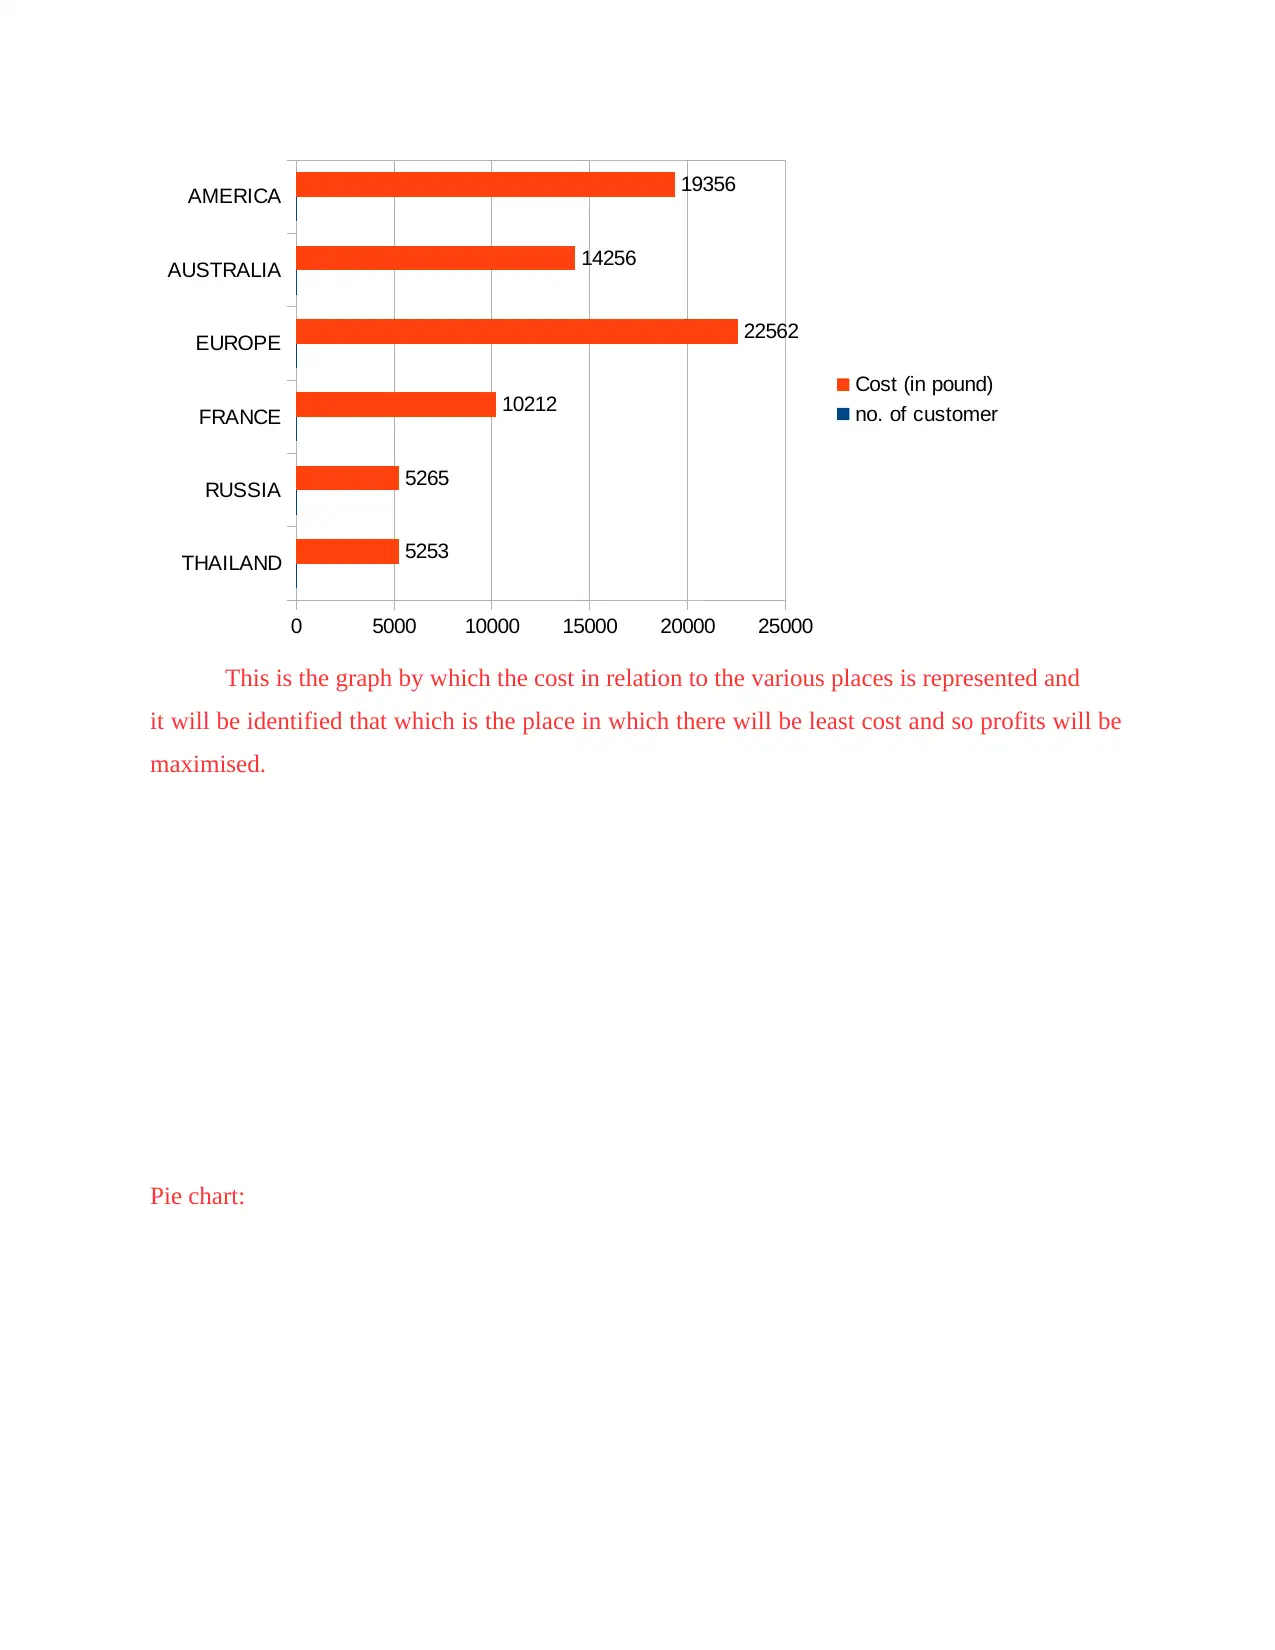
This is the graph by which the cost in relation to the various places is represented and
it will be identified that which is the place in which there will be least cost and so profits will be
maximised.
Pie chart:
RUSSIA
FRANCE
EUROPE
AUSTRALIA
AMERICA
0 5000 10000 15000 20000 25000
5253
5265
10212
22562
14256
19356
Cost (in pound)
no. of customer
This is the graph by which the cost in relation to the various places is represented and
it will be identified that which is the place in which there will be least cost and so profits will be
maximised.
Pie chart:
⊘ This is a preview!⊘
Do you want full access?
Subscribe today to unlock all pages.
Trusted by 1+ million students worldwide
1 out of 17
Related Documents


Your All-in-One AI-Powered Toolkit for Academic Success.
+13062052269
info@desklib.com
Available 24*7 on WhatsApp / Email
![[object Object]](/_next/static/media/star-bottom.7253800d.svg)
Unlock your academic potential
Copyright © 2020–2026 A2Z Services. All Rights Reserved. Developed and managed by ZUCOL.