Business Decision Making Report: Data Analysis, Research, and Findings
VerifiedAdded on 2019/12/28
|26
|6333
|54
Report
AI Summary
This report presents a comprehensive analysis of business decision-making, incorporating statistical tools and research methodologies. The report begins with an introduction to business statistics, followed by an overview of data collection methods, including primary and secondary data sources, and sampling techniques. A questionnaire is included to gather data. The analysis then delves into statistical tools such as mean, median, and mode, along with interpretations of the collected data. The report also covers data visualization through charts and graphs, trend line analysis, and project evaluation methods. The report concludes with a discussion of information processing tools, network diagrams, and project evaluation methods to assess the project's viability. Tables and illustrations are used to support the analysis, and the report provides a thorough examination of business decision-making processes.

BUSINESS DECISION
MAKING
MAKING
Paraphrase This Document
Need a fresh take? Get an instant paraphrase of this document with our AI Paraphraser
TABLE OF CONTENTS
INTRODUCTION...........................................................................................................................3
TASK 1............................................................................................................................................3
1.1 Sources of information for conducting a research................................................................3
1.2 Sampling methods in the research........................................................................................4
1.3 Questionnaire for research....................................................................................................5
Name : ____________................................................................................................................5
TASK 2............................................................................................................................................7
2.1 Information for decision making..........................................................................................7
2.2 Interpretation of data.............................................................................................................8
2.3 Interpretation of standard deviation......................................................................................9
2.4 Interpretation of quartile and correlation............................................................................10
TASK 3..........................................................................................................................................11
3.1 Graph and chart on the collected data.................................................................................11
3.2 Trend line for Tesco............................................................................................................16
3.3 Covered in PPT...................................................................................................................17
3.4 Formal business report........................................................................................................17
TASK 4..........................................................................................................................................18
4.1 Information processing tools for the business....................................................................18
4.2 Network diagram................................................................................................................19
4.3 Project evaluation methods.................................................................................................22
CONCLCUSION...........................................................................................................................23
REFERENCES..............................................................................................................................24
INDEX OF TABLES
Table 1: Calculation of statistical tools...........................................................................................8
Table 2: Calculation of correlation................................................................................................11
Table 3: Calculation of NPV.........................................................................................................22
Table 4: Calculation of IRR..........................................................................................................22
ILLUSTRATION INDEX
Illustration 1: People response on sale of products by Tesco at cheaper price.............................12
Illustration 2: People response of price policy that is adopted by Tesco......................................13
Illustration 3: People response on future competitive scenario for Tesco ....................................14
Illustration 4: Respondents experience at Tesco...........................................................................15
Illustration 5: Column chart trend line..........................................................................................16
Illustration 6: Scatter diagram trend line.......................................................................................16
Illustration 7: GANTT chart..........................................................................................................21
Illustration 8: Network diagram....................................................................................................21
⊘ This is a preview!⊘
Do you want full access?
Subscribe today to unlock all pages.
Trusted by 1+ million students worldwide
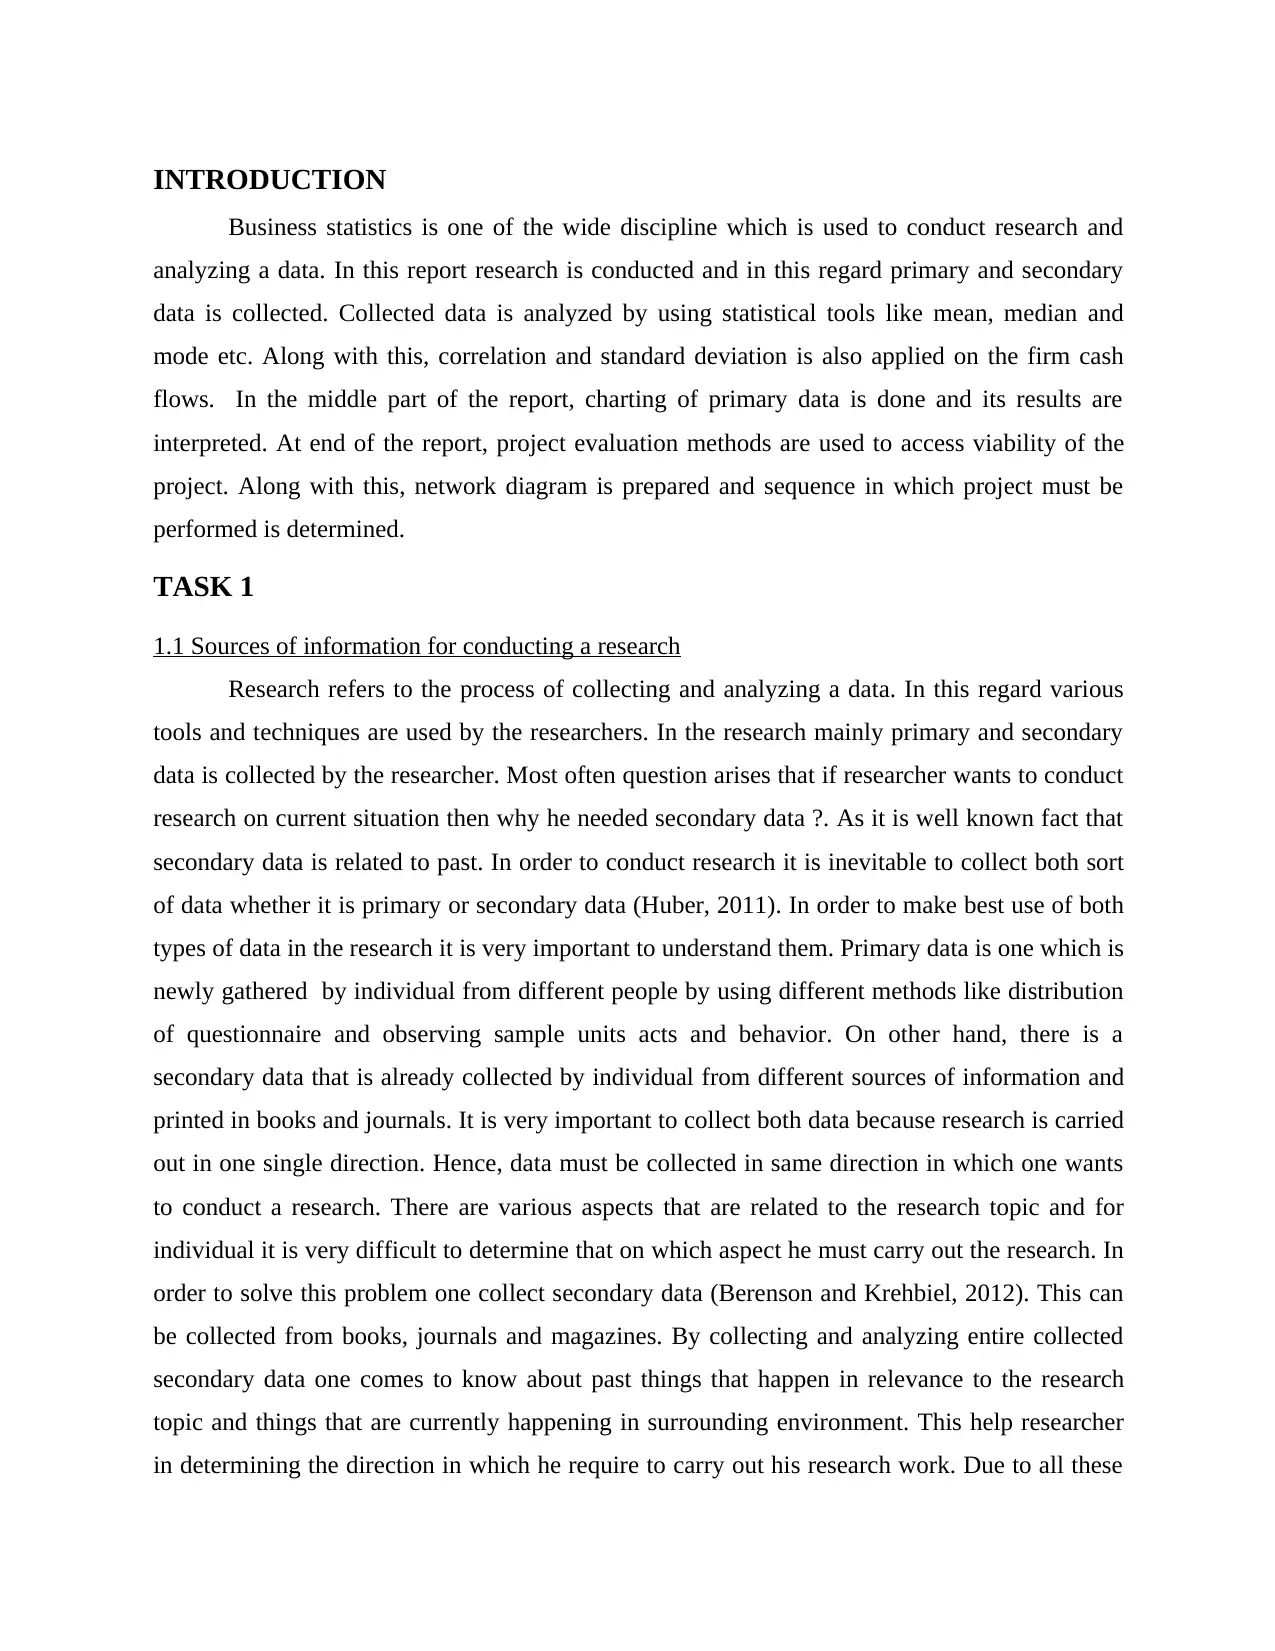
INTRODUCTION
Business statistics is one of the wide discipline which is used to conduct research and
analyzing a data. In this report research is conducted and in this regard primary and secondary
data is collected. Collected data is analyzed by using statistical tools like mean, median and
mode etc. Along with this, correlation and standard deviation is also applied on the firm cash
flows. In the middle part of the report, charting of primary data is done and its results are
interpreted. At end of the report, project evaluation methods are used to access viability of the
project. Along with this, network diagram is prepared and sequence in which project must be
performed is determined.
TASK 1
1.1 Sources of information for conducting a research
Research refers to the process of collecting and analyzing a data. In this regard various
tools and techniques are used by the researchers. In the research mainly primary and secondary
data is collected by the researcher. Most often question arises that if researcher wants to conduct
research on current situation then why he needed secondary data ?. As it is well known fact that
secondary data is related to past. In order to conduct research it is inevitable to collect both sort
of data whether it is primary or secondary data (Huber, 2011). In order to make best use of both
types of data in the research it is very important to understand them. Primary data is one which is
newly gathered by individual from different people by using different methods like distribution
of questionnaire and observing sample units acts and behavior. On other hand, there is a
secondary data that is already collected by individual from different sources of information and
printed in books and journals. It is very important to collect both data because research is carried
out in one single direction. Hence, data must be collected in same direction in which one wants
to conduct a research. There are various aspects that are related to the research topic and for
individual it is very difficult to determine that on which aspect he must carry out the research. In
order to solve this problem one collect secondary data (Berenson and Krehbiel, 2012). This can
be collected from books, journals and magazines. By collecting and analyzing entire collected
secondary data one comes to know about past things that happen in relevance to the research
topic and things that are currently happening in surrounding environment. This help researcher
in determining the direction in which he require to carry out his research work. Due to all these
Paraphrase This Document
Need a fresh take? Get an instant paraphrase of this document with our AI Paraphraser
reasons it is very important to collect secondary data in the research. Along with this it is also
very important to collect primary data because main aim of research is to evaluate current
conditions. Hence, one collect fresh data related to the research topic. In this way it become
necessary for one to collect both sort of data in the research. In present study sample of 60
people will be taken that resides in different borough of London. Questionnaires will distributed
among them. Apart from this secondary data will be collected from books and journals. In this
way entire research will be collected by researcher.
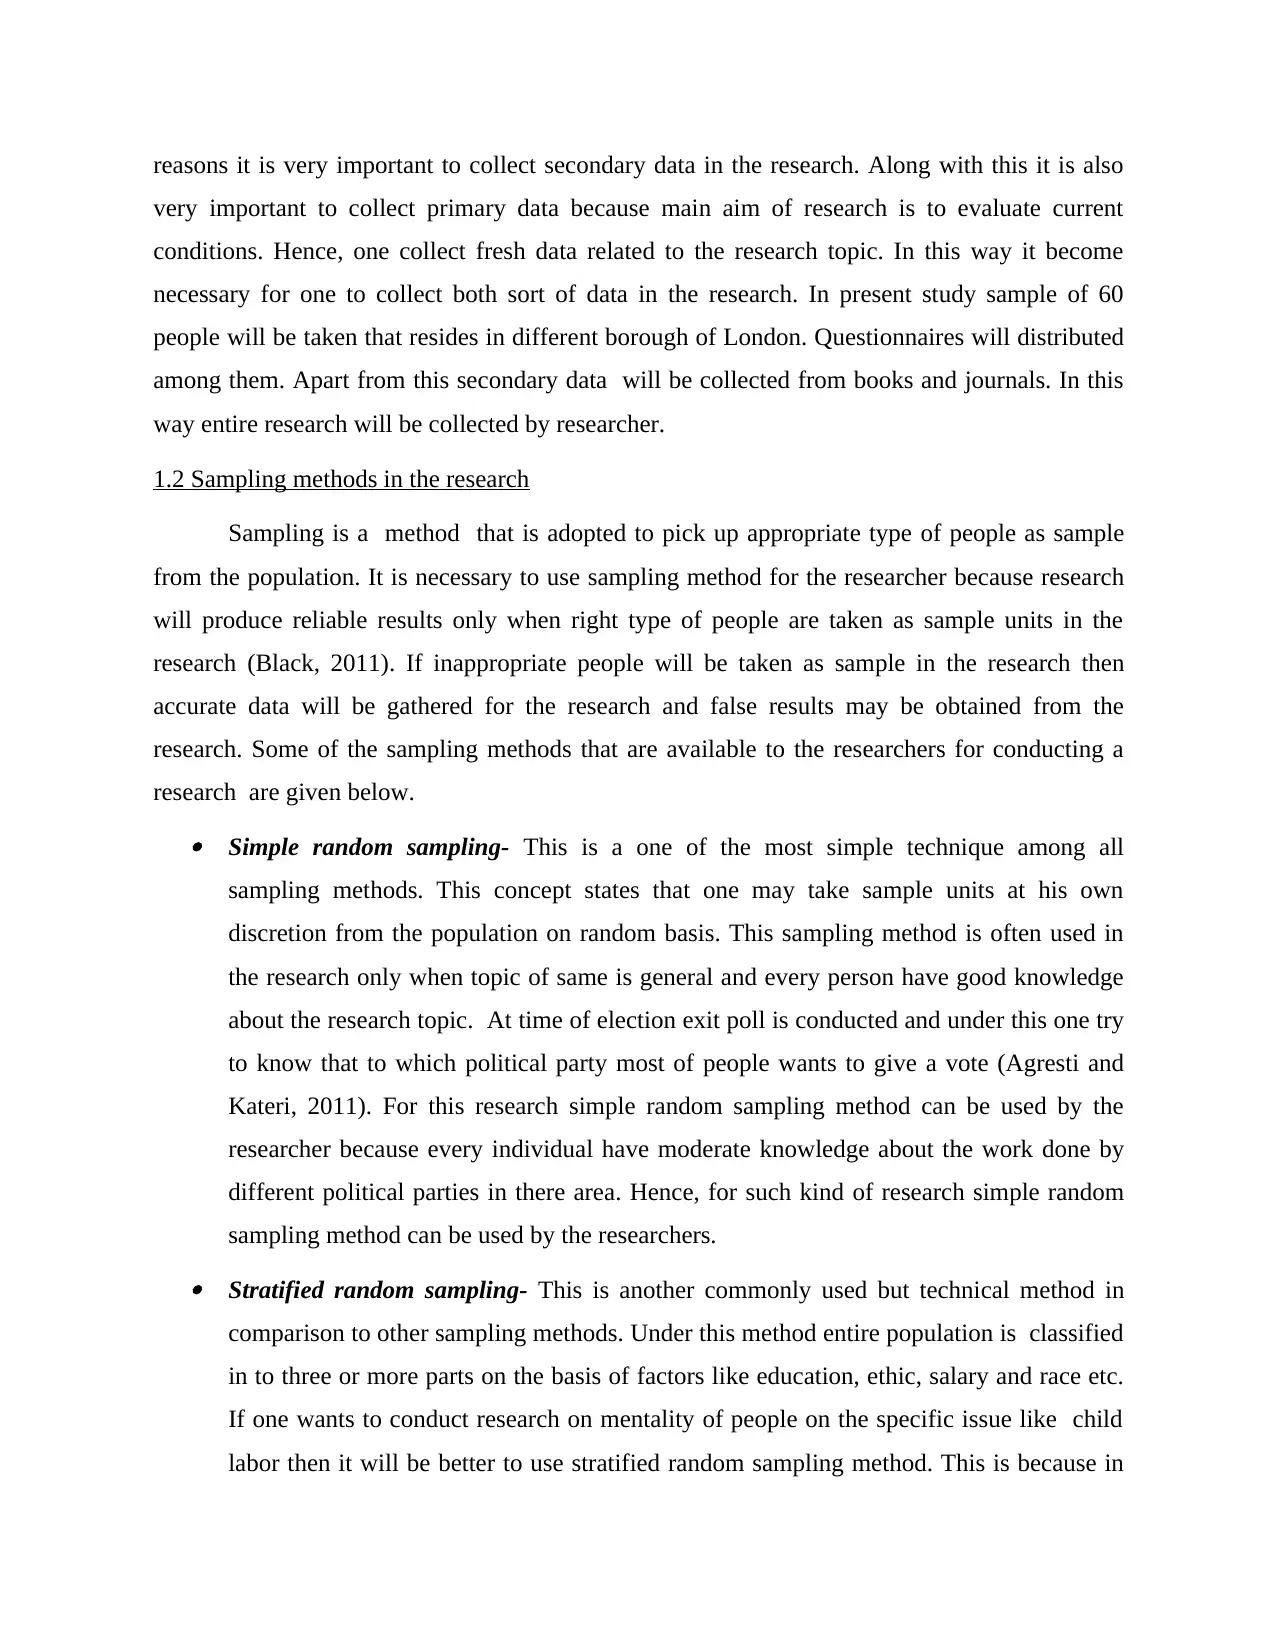
1.2 Sampling methods in the research
Sampling is a method that is adopted to pick up appropriate type of people as sample
from the population. It is necessary to use sampling method for the researcher because research
will produce reliable results only when right type of people are taken as sample units in the
research (Black, 2011). If inappropriate people will be taken as sample in the research then
accurate data will be gathered for the research and false results may be obtained from the
research. Some of the sampling methods that are available to the researchers for conducting a
research are given below. Simple random sampling- This is a one of the most simple technique among all
sampling methods. This concept states that one may take sample units at his own
discretion from the population on random basis. This sampling method is often used in
the research only when topic of same is general and every person have good knowledge
about the research topic. At time of election exit poll is conducted and under this one try
to know that to which political party most of people wants to give a vote (Agresti and
Kateri, 2011). For this research simple random sampling method can be used by the
researcher because every individual have moderate knowledge about the work done by
different political parties in there area. Hence, for such kind of research simple random
sampling method can be used by the researchers. Stratified random sampling- This is another commonly used but technical method in
comparison to other sampling methods. Under this method entire population is classified
in to three or more parts on the basis of factors like education, ethic, salary and race etc.
If one wants to conduct research on mentality of people on the specific issue like child
labor then it will be better to use stratified random sampling method. This is because in
very important to collect primary data because main aim of research is to evaluate current
conditions. Hence, one collect fresh data related to the research topic. In this way it become
necessary for one to collect both sort of data in the research. In present study sample of 60
people will be taken that resides in different borough of London. Questionnaires will distributed
among them. Apart from this secondary data will be collected from books and journals. In this
way entire research will be collected by researcher.
1.2 Sampling methods in the research
Sampling is a method that is adopted to pick up appropriate type of people as sample
from the population. It is necessary to use sampling method for the researcher because research
will produce reliable results only when right type of people are taken as sample units in the
research (Black, 2011). If inappropriate people will be taken as sample in the research then
accurate data will be gathered for the research and false results may be obtained from the
research. Some of the sampling methods that are available to the researchers for conducting a
research are given below. Simple random sampling- This is a one of the most simple technique among all
sampling methods. This concept states that one may take sample units at his own
discretion from the population on random basis. This sampling method is often used in
the research only when topic of same is general and every person have good knowledge
about the research topic. At time of election exit poll is conducted and under this one try
to know that to which political party most of people wants to give a vote (Agresti and
Kateri, 2011). For this research simple random sampling method can be used by the
researcher because every individual have moderate knowledge about the work done by
different political parties in there area. Hence, for such kind of research simple random
sampling method can be used by the researchers. Stratified random sampling- This is another commonly used but technical method in
comparison to other sampling methods. Under this method entire population is classified
in to three or more parts on the basis of factors like education, ethic, salary and race etc.
If one wants to conduct research on mentality of people on the specific issue like child
labor then it will be better to use stratified random sampling method. This is because in
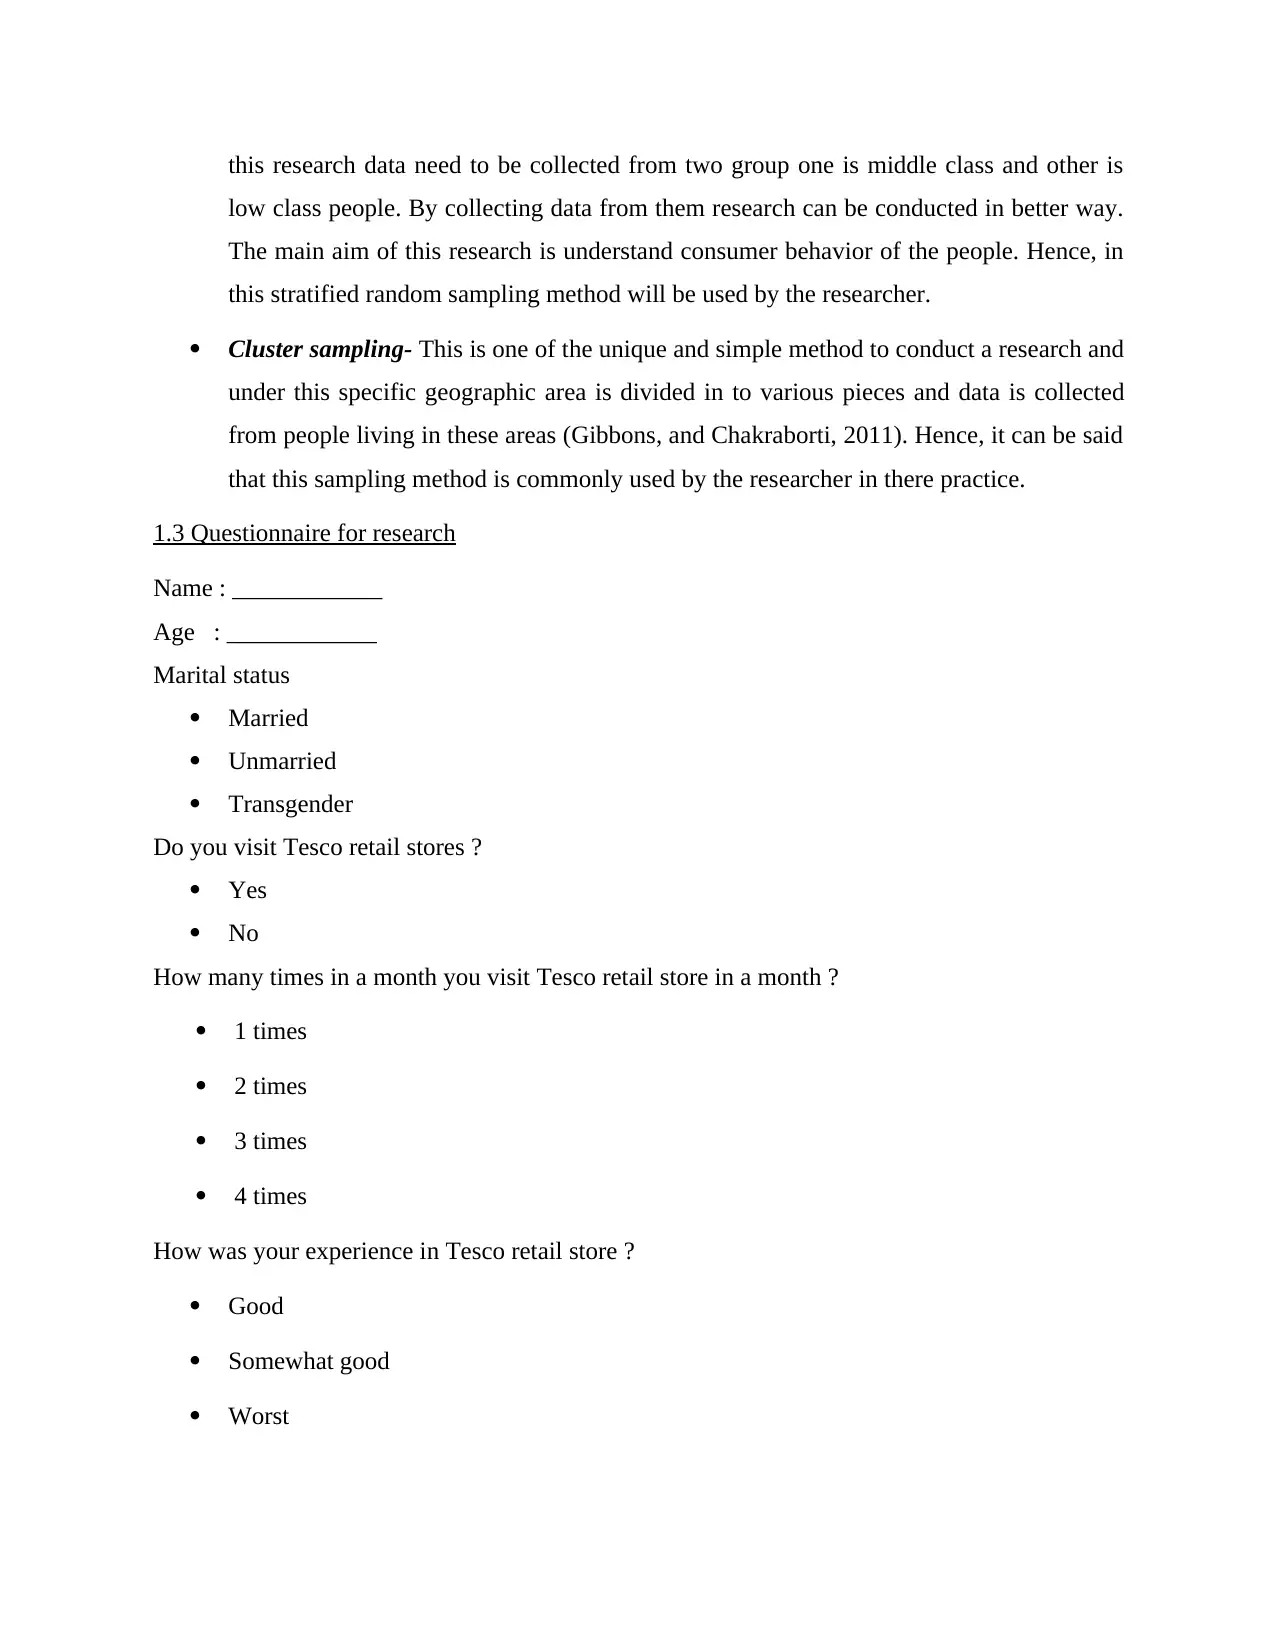
this research data need to be collected from two group one is middle class and other is
low class people. By collecting data from them research can be conducted in better way.
The main aim of this research is understand consumer behavior of the people. Hence, in
this stratified random sampling method will be used by the researcher.
Cluster sampling- This is one of the unique and simple method to conduct a research and
under this specific geographic area is divided in to various pieces and data is collected
from people living in these areas (Gibbons, and Chakraborti, 2011). Hence, it can be said
that this sampling method is commonly used by the researcher in there practice.
1.3 Questionnaire for research
Name : ____________
Age : ____________
Marital status
Married
Unmarried
Transgender
Do you visit Tesco retail stores ?
Yes
No
How many times in a month you visit Tesco retail store in a month ?
1 times
2 times
3 times
4 times
How was your experience in Tesco retail store ?
Good
Somewhat good
Worst
⊘ This is a preview!⊘
Do you want full access?
Subscribe today to unlock all pages.
Trusted by 1+ million students worldwide
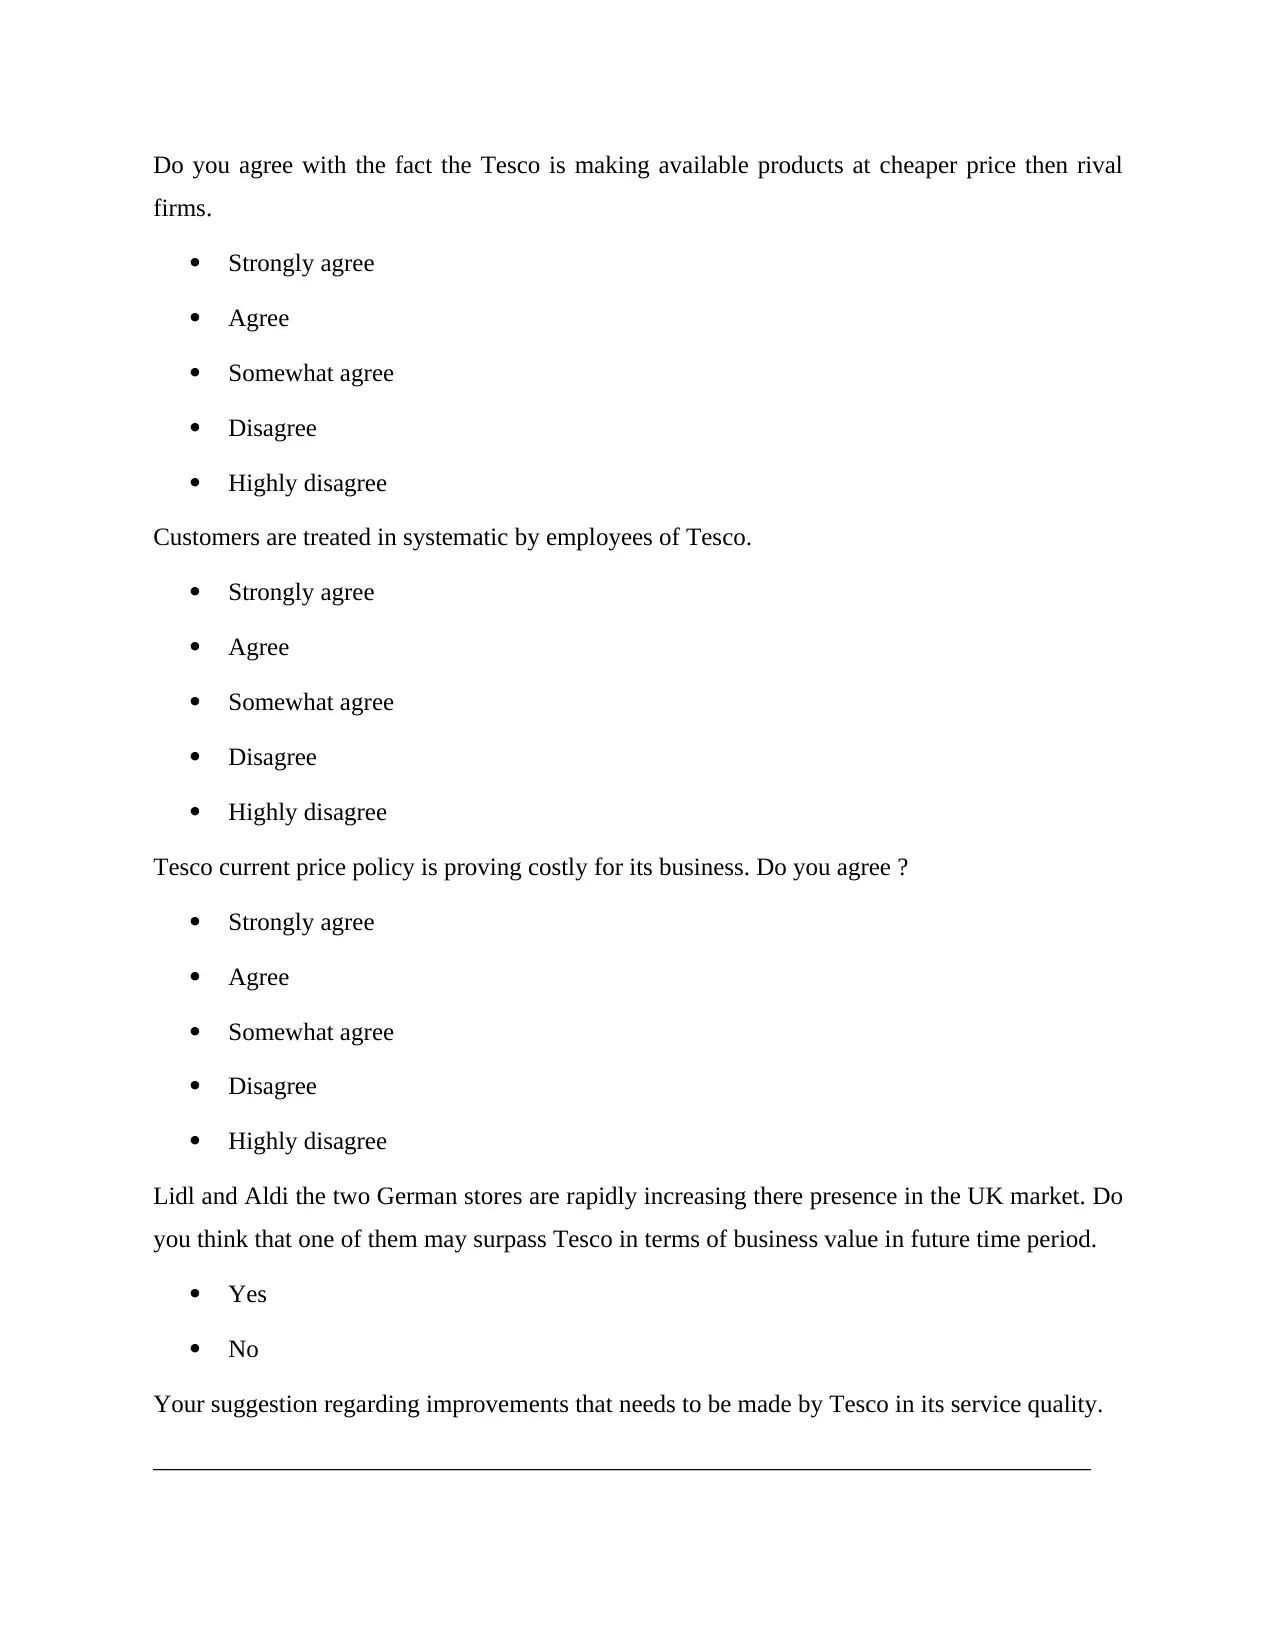
Do you agree with the fact the Tesco is making available products at cheaper price then rival
firms.
Strongly agree
Agree
Somewhat agree
Disagree
Highly disagree
Customers are treated in systematic by employees of Tesco.
Strongly agree
Agree
Somewhat agree
Disagree
Highly disagree
Tesco current price policy is proving costly for its business. Do you agree ?
Strongly agree
Agree
Somewhat agree
Disagree
Highly disagree
Lidl and Aldi the two German stores are rapidly increasing there presence in the UK market. Do
you think that one of them may surpass Tesco in terms of business value in future time period.
Yes
No
Your suggestion regarding improvements that needs to be made by Tesco in its service quality.
___________________________________________________________________________
Paraphrase This Document
Need a fresh take? Get an instant paraphrase of this document with our AI Paraphraser
TASK 2
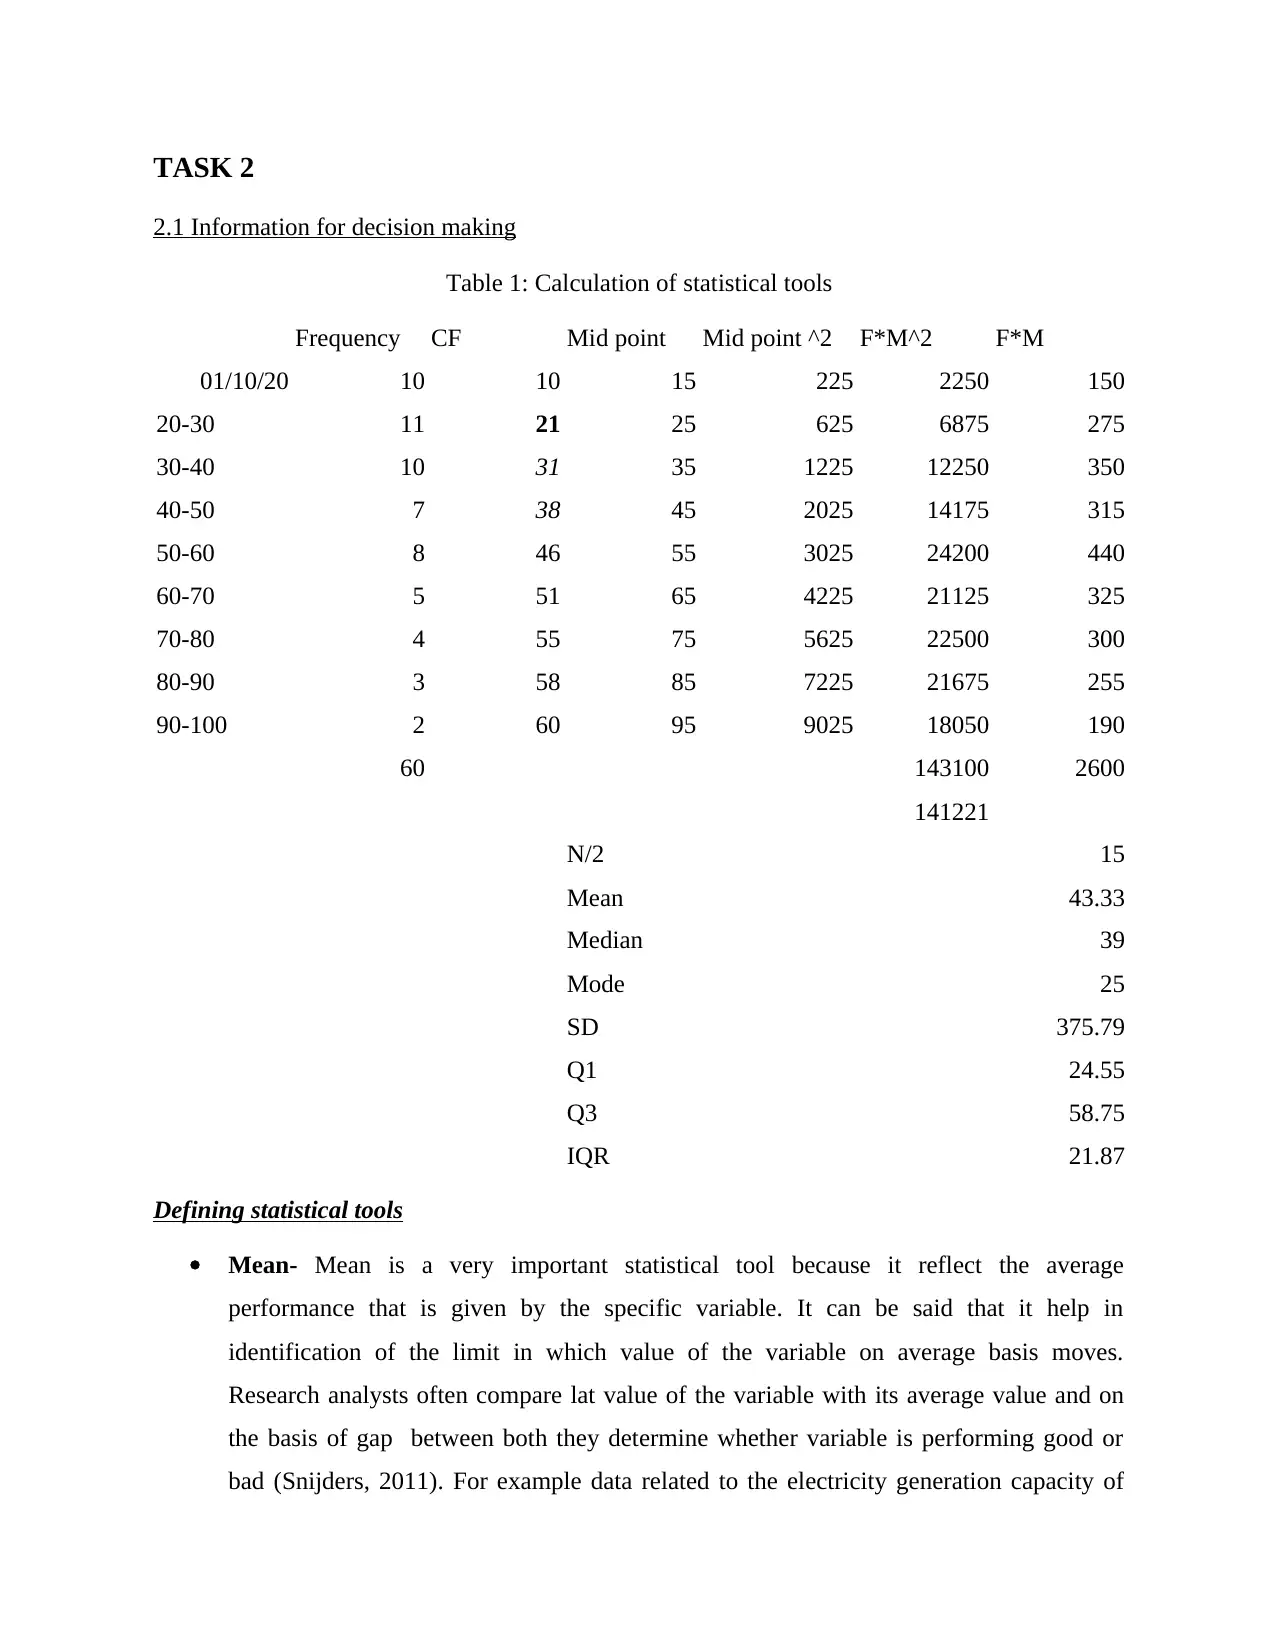
2.1 Information for decision making
Table 1: Calculation of statistical tools
Frequency CF Mid point Mid point ^2 F*M^2 F*M
01/10/20 10 10 15 225 2250 150
20-30 11 21 25 625 6875 275
30-40 10 31 35 1225 12250 350
40-50 7 38 45 2025 14175 315
50-60 8 46 55 3025 24200 440
60-70 5 51 65 4225 21125 325
70-80 4 55 75 5625 22500 300
80-90 3 58 85 7225 21675 255
90-100 2 60 95 9025 18050 190
60 143100 2600
141221
N/2 15
Mean 43.33
Median 39
Mode 25
SD 375.79
Q1 24.55
Q3 58.75
IQR 21.87
Defining statistical tools
Mean- Mean is a very important statistical tool because it reflect the average
performance that is given by the specific variable. It can be said that it help in
identification of the limit in which value of the variable on average basis moves.
Research analysts often compare lat value of the variable with its average value and on
the basis of gap between both they determine whether variable is performing good or
bad (Snijders, 2011). For example data related to the electricity generation capacity of
the firm is computed and it is identified that average electricity production capacity of the
firm is 300 MW but firm is currently producing 250 MW then it can be said that firm is
giving poor performance and it is even giving less then average performance.
Median- Median is another important tool that is used by the business firms and this tool
is widely used by them because this tool divide values of the variable in to multiple parts
and help in analyzing trend in proper way. It is possible that there may be different trends
in the data set. Merely by evaluating a data set in one attempt one can not track trends
that are occurring in the data set. Hence, median is used and different parts that are
divided by this value are analyzed to identify different patterns in which values of the
variable are moving. Hence, it can be said that this statistical tool have a great
importance for the business firms.
Mode- Mode is another commonly used tool of descriptive data and it indicate the value
of the data set that often repeated in the data set. This tool is often used by the equity
research analysts in there research work (Weiers, 2010). By using this tool they identify
price of share that is frequently appearing in the data set. After identification of value
then determine different price ranges on the basis of mode value and identify pattern in
which share price move in different time period.
2.2 Interpretation of data
Following are the interpretations of different statistical tools. Mean- Average value of the variable is 43.33 and it can be said that most of the people
are buying products in this price range. In the data set it can be observed that there are
different price ranges and class interval is 10. Value of mean is 43.33 which means that
most of people are making purchase of products from Tesco in this price range. This
means that if firm commence promotion offers on the purchase of more then 50 then
people may be convinced to make purchase above this average value from Tesco. This
strategy may enhance revenue of the firm. It is the power of this statistical tool and
merely by looking at class interval data one can not formulate such kind of effective
business strategy. Median- It can be seen that value of median is 39 which means that it is the value that is
dividing entire data in to two multiple parts. There may be different hidden trends in this
⊘ This is a preview!⊘
Do you want full access?
Subscribe today to unlock all pages.
Trusted by 1+ million students worldwide
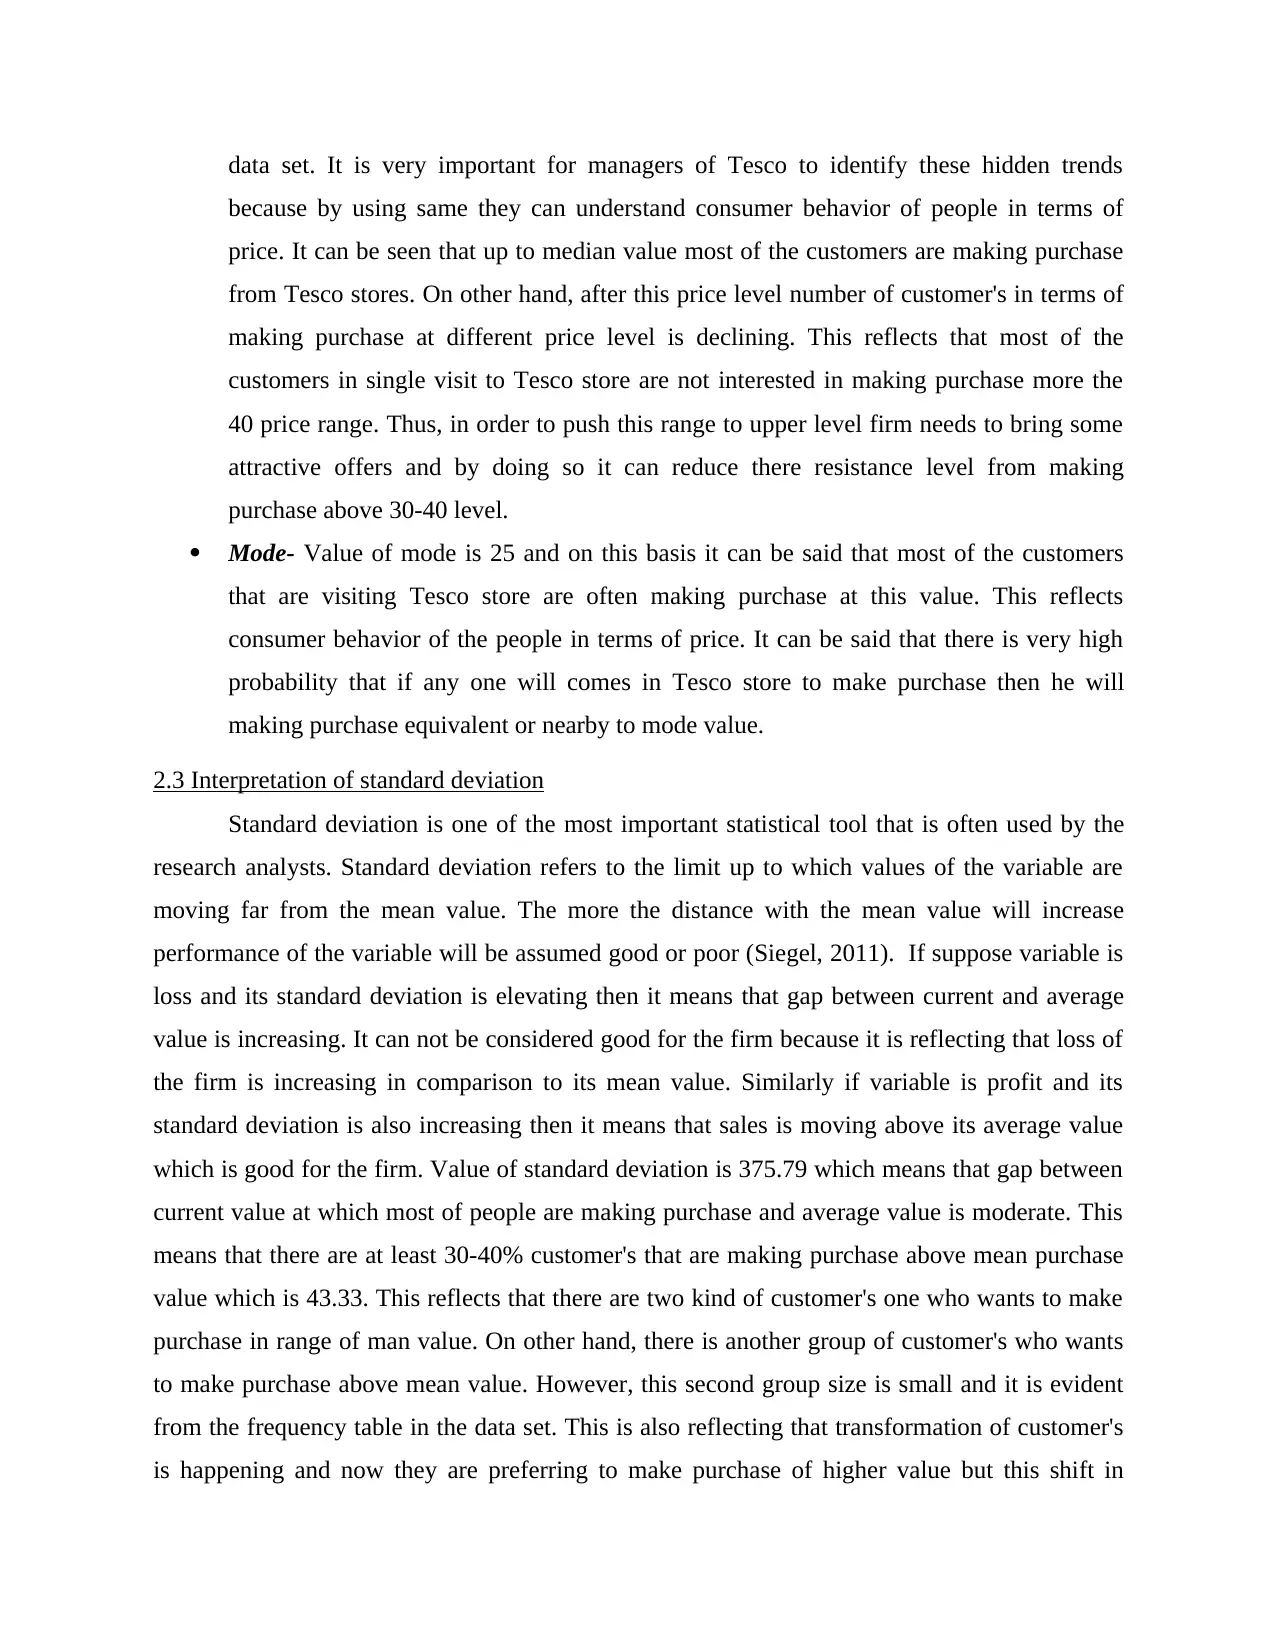
data set. It is very important for managers of Tesco to identify these hidden trends
because by using same they can understand consumer behavior of people in terms of
price. It can be seen that up to median value most of the customers are making purchase
from Tesco stores. On other hand, after this price level number of customer's in terms of
making purchase at different price level is declining. This reflects that most of the
customers in single visit to Tesco store are not interested in making purchase more the
40 price range. Thus, in order to push this range to upper level firm needs to bring some
attractive offers and by doing so it can reduce there resistance level from making
purchase above 30-40 level.
Mode- Value of mode is 25 and on this basis it can be said that most of the customers
that are visiting Tesco store are often making purchase at this value. This reflects
consumer behavior of the people in terms of price. It can be said that there is very high
probability that if any one will comes in Tesco store to make purchase then he will
making purchase equivalent or nearby to mode value.
2.3 Interpretation of standard deviation
Standard deviation is one of the most important statistical tool that is often used by the
research analysts. Standard deviation refers to the limit up to which values of the variable are
moving far from the mean value. The more the distance with the mean value will increase
performance of the variable will be assumed good or poor (Siegel, 2011). If suppose variable is
loss and its standard deviation is elevating then it means that gap between current and average
value is increasing. It can not be considered good for the firm because it is reflecting that loss of
the firm is increasing in comparison to its mean value. Similarly if variable is profit and its
standard deviation is also increasing then it means that sales is moving above its average value
which is good for the firm. Value of standard deviation is 375.79 which means that gap between
current value at which most of people are making purchase and average value is moderate. This
means that there are at least 30-40% customer's that are making purchase above mean purchase
value which is 43.33. This reflects that there are two kind of customer's one who wants to make
purchase in range of man value. On other hand, there is another group of customer's who wants
to make purchase above mean value. However, this second group size is small and it is evident
from the frequency table in the data set. This is also reflecting that transformation of customer's
is happening and now they are preferring to make purchase of higher value but this shift in
Paraphrase This Document
Need a fresh take? Get an instant paraphrase of this document with our AI Paraphraser
consumer behavior is at its initial stage (Grewal, 2011). This means that if Tesco from today
prepare and implement its promotion strategy which is discussed in above answers then it may
get first mover advantage and grab opportunity in comparison to its competitors so quickly.
Thus, it can be said that this statistical tool help firm in identification of opportunity that recently
comes in existence in the market and about which most of rival firms does not have any sort of
knowledge.
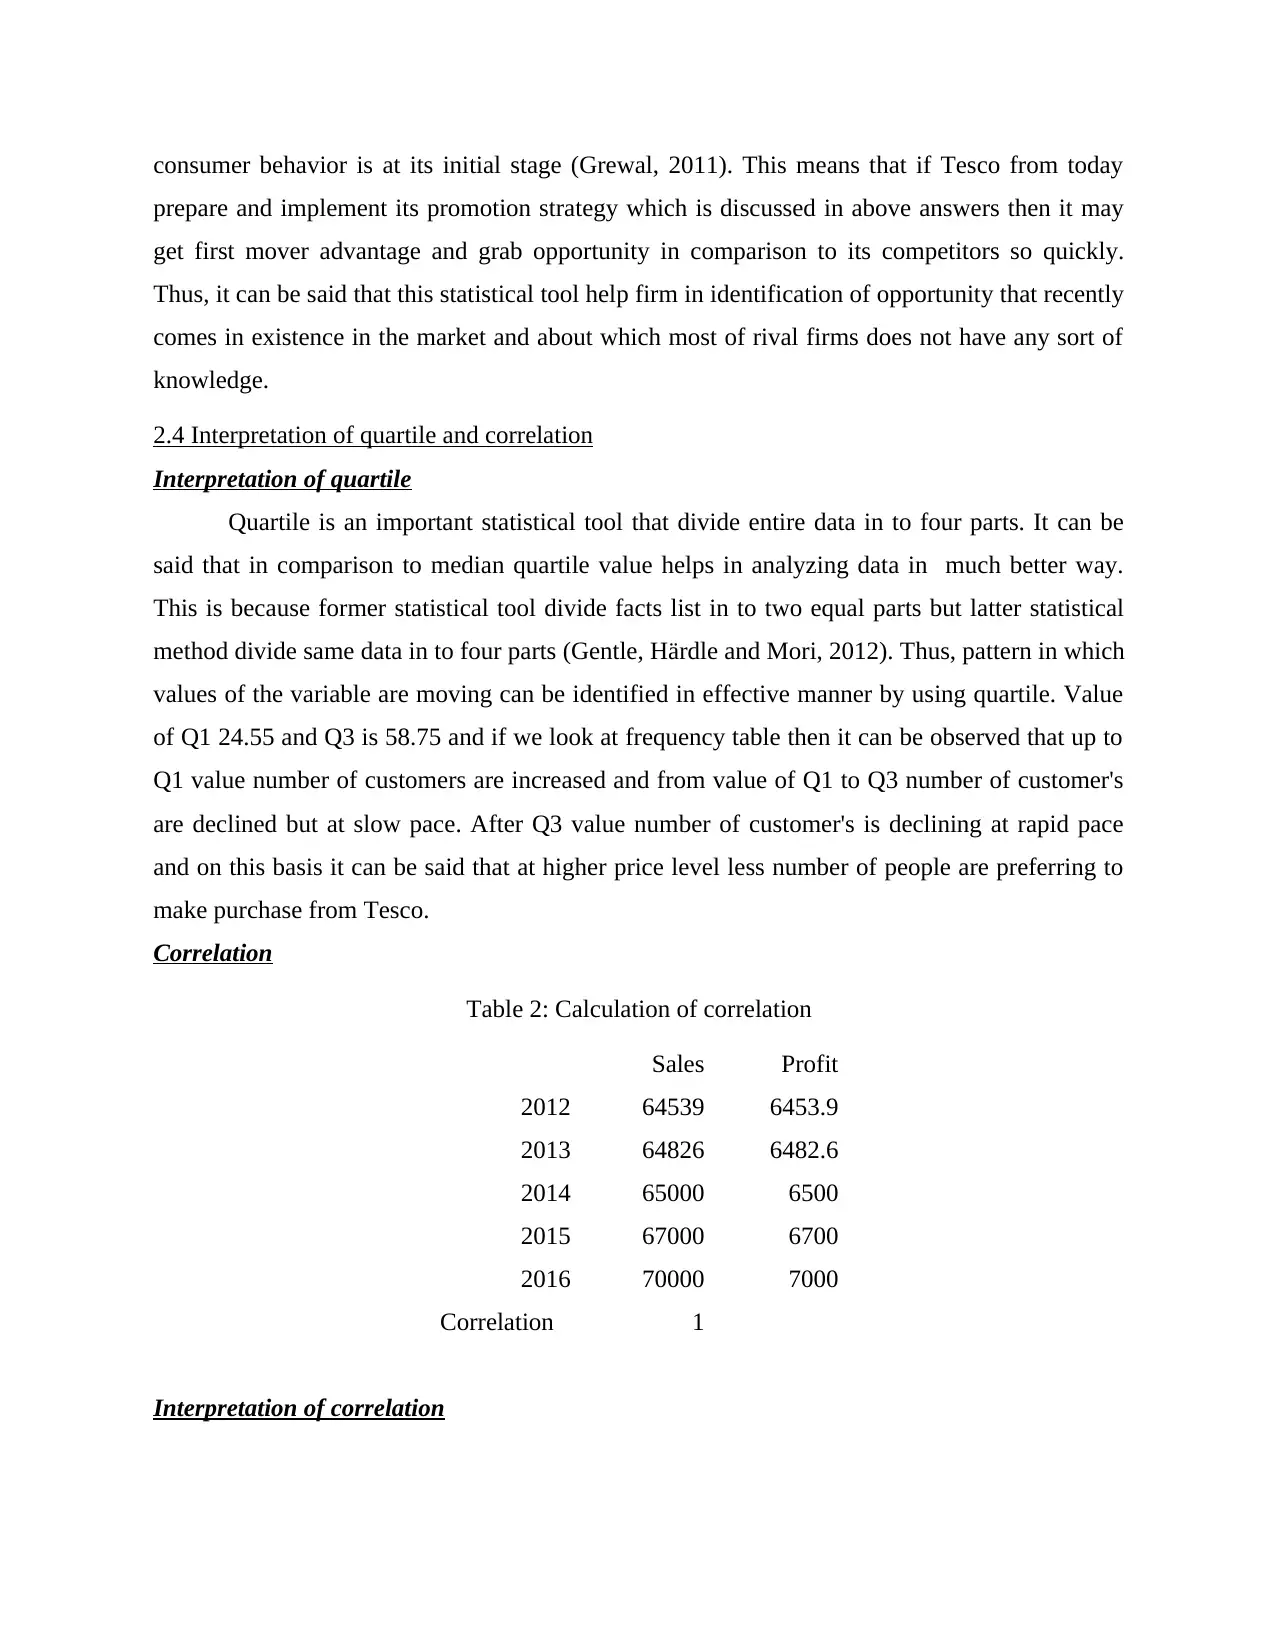
2.4 Interpretation of quartile and correlation
Interpretation of quartile
Quartile is an important statistical tool that divide entire data in to four parts. It can be
said that in comparison to median quartile value helps in analyzing data in much better way.
This is because former statistical tool divide facts list in to two equal parts but latter statistical
method divide same data in to four parts (Gentle, Härdle and Mori, 2012). Thus, pattern in which
values of the variable are moving can be identified in effective manner by using quartile. Value
of Q1 24.55 and Q3 is 58.75 and if we look at frequency table then it can be observed that up to
Q1 value number of customers are increased and from value of Q1 to Q3 number of customer's
are declined but at slow pace. After Q3 value number of customer's is declining at rapid pace
and on this basis it can be said that at higher price level less number of people are preferring to
make purchase from Tesco.
Correlation
Table 2: Calculation of correlation
Sales Profit
2012 64539 6453.9
2013 64826 6482.6
2014 65000 6500
2015 67000 6700
2016 70000 7000
Correlation 1
Interpretation of correlation
prepare and implement its promotion strategy which is discussed in above answers then it may
get first mover advantage and grab opportunity in comparison to its competitors so quickly.
Thus, it can be said that this statistical tool help firm in identification of opportunity that recently
comes in existence in the market and about which most of rival firms does not have any sort of
knowledge.
2.4 Interpretation of quartile and correlation
Interpretation of quartile
Quartile is an important statistical tool that divide entire data in to four parts. It can be
said that in comparison to median quartile value helps in analyzing data in much better way.
This is because former statistical tool divide facts list in to two equal parts but latter statistical
method divide same data in to four parts (Gentle, Härdle and Mori, 2012). Thus, pattern in which
values of the variable are moving can be identified in effective manner by using quartile. Value
of Q1 24.55 and Q3 is 58.75 and if we look at frequency table then it can be observed that up to
Q1 value number of customers are increased and from value of Q1 to Q3 number of customer's
are declined but at slow pace. After Q3 value number of customer's is declining at rapid pace
and on this basis it can be said that at higher price level less number of people are preferring to
make purchase from Tesco.
Correlation
Table 2: Calculation of correlation
Sales Profit
2012 64539 6453.9
2013 64826 6482.6
2014 65000 6500
2015 67000 6700
2016 70000 7000
Correlation 1
Interpretation of correlation
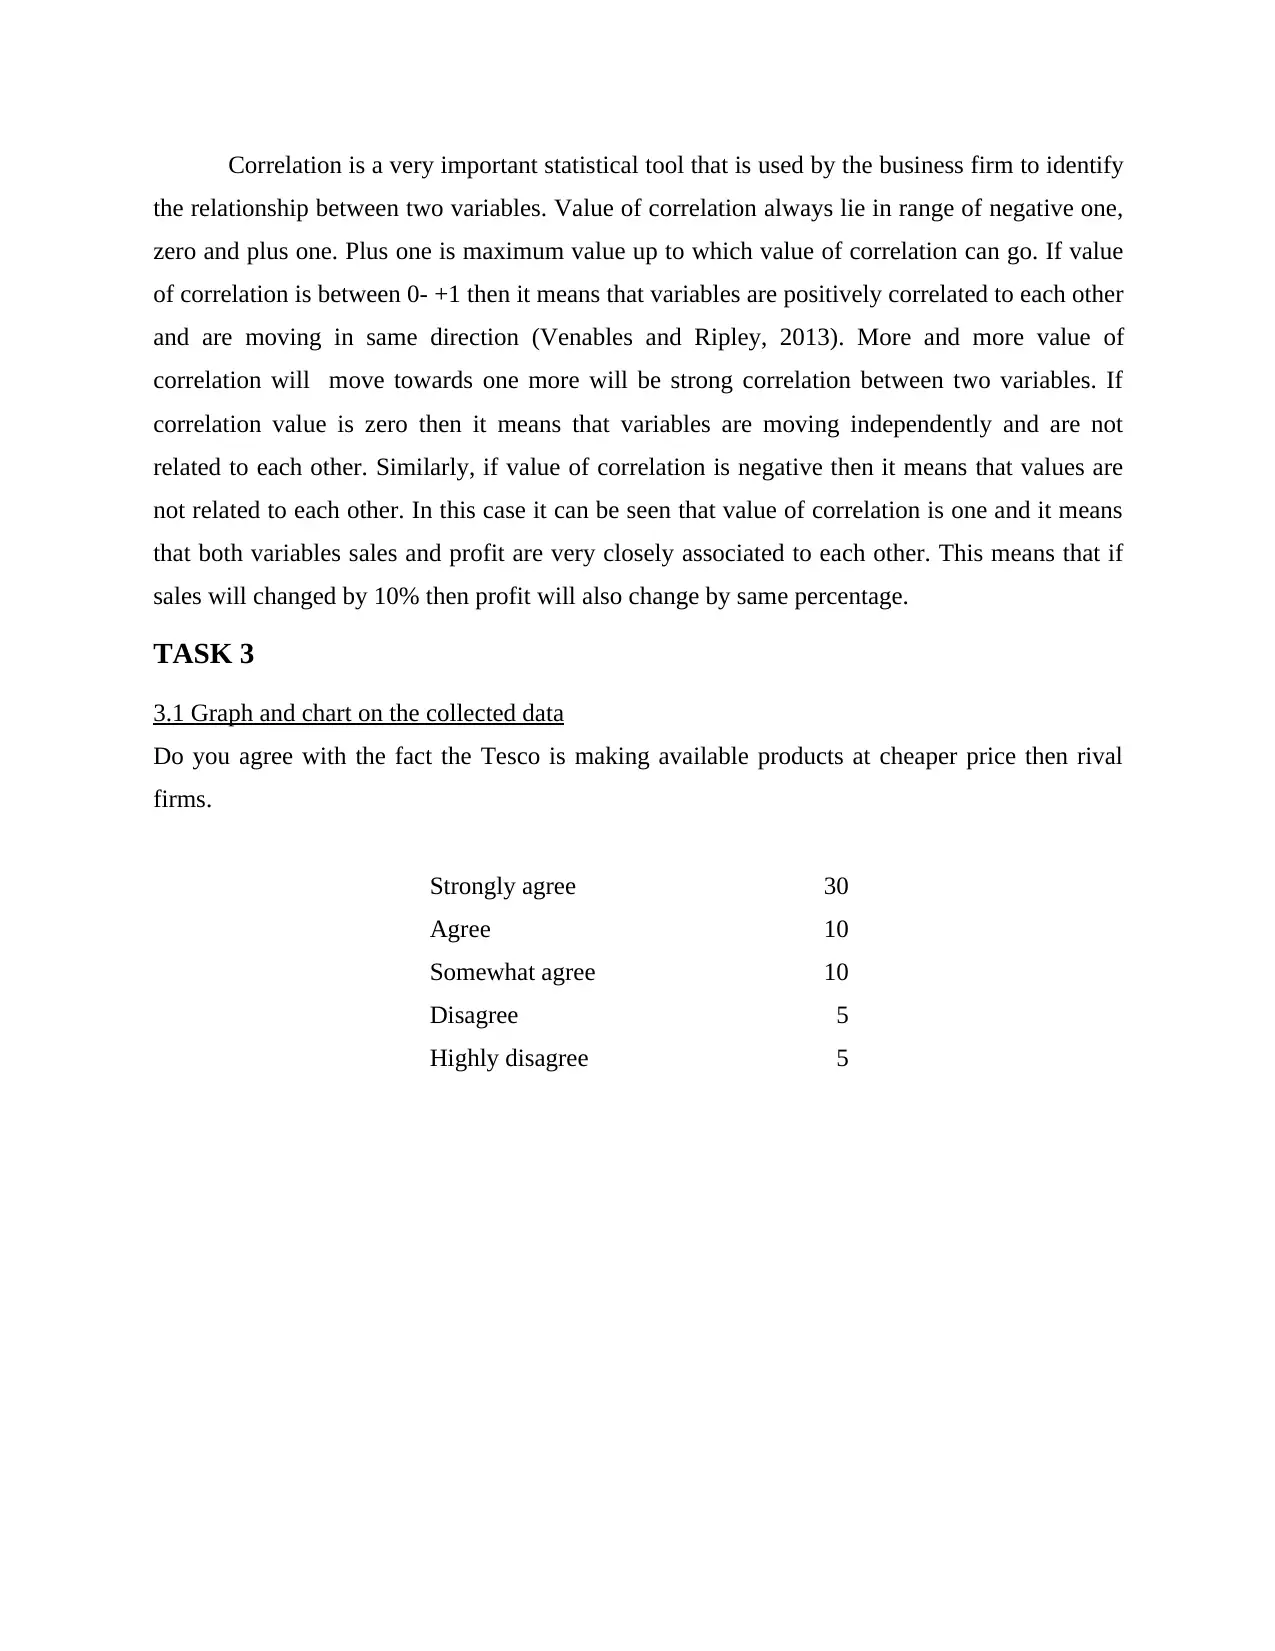
Correlation is a very important statistical tool that is used by the business firm to identify
the relationship between two variables. Value of correlation always lie in range of negative one,
zero and plus one. Plus one is maximum value up to which value of correlation can go. If value
of correlation is between 0- +1 then it means that variables are positively correlated to each other
and are moving in same direction (Venables and Ripley, 2013). More and more value of
correlation will move towards one more will be strong correlation between two variables. If
correlation value is zero then it means that variables are moving independently and are not
related to each other. Similarly, if value of correlation is negative then it means that values are
not related to each other. In this case it can be seen that value of correlation is one and it means
that both variables sales and profit are very closely associated to each other. This means that if
sales will changed by 10% then profit will also change by same percentage.
TASK 3
3.1 Graph and chart on the collected data
Do you agree with the fact the Tesco is making available products at cheaper price then rival
firms.
Strongly agree 30
Agree 10
Somewhat agree 10
Disagree 5
Highly disagree 5
⊘ This is a preview!⊘
Do you want full access?
Subscribe today to unlock all pages.
Trusted by 1+ million students worldwide
1 out of 26
Related Documents


Your All-in-One AI-Powered Toolkit for Academic Success.
+13062052269
info@desklib.com
Available 24*7 on WhatsApp / Email
![[object Object]](/_next/static/media/star-bottom.7253800d.svg)
Unlock your academic potential
Copyright © 2020–2026 A2Z Services. All Rights Reserved. Developed and managed by ZUCOL.