Business Decision Making Report: Data Collection, Analysis, and Tools
VerifiedAdded on 2020/10/04
|21
|4183
|59
Report
AI Summary
This report provides a comprehensive analysis of business decision-making, beginning with an introduction to the process and its significance. Task 1 focuses on data collection, outlining a detailed plan, survey methods, and the design of questionnaires used to gather customer feedback for the 'Food for Friends' restaurant. Task 2 involves the interpretation and analysis of the collected data, including the presentation of results, evaluation of measures of dispersion, and elaboration of percentiles, quartiles, and correlation coefficients. Task 3 employs various charts and graphs for data analysis, along with trend line representations, culminating in a formal report summarizing the findings. Finally, Task 4 explores the application of information processing tools, critical path analysis, and the analysis of financial tools used in decision-making. The report concludes with a summary of the findings and references.

BDM
Paraphrase This Document
Need a fresh take? Get an instant paraphrase of this document with our AI Paraphraser
Table of Contents
INTRODUCTION...........................................................................................................................1
TASK 1............................................................................................................................................1
1.1: Data collection plan.............................................................................................................1
1.2: Survey methods used under this project..............................................................................2
1.3: Designing a questionnaires..................................................................................................3
TASK 2............................................................................................................................................5
2.1 Interpretation of data collected..............................................................................................5
2.2: Results analysis....................................................................................................................8
2.3 Evaluation of measure of dispersion ....................................................................................8
2.4 Elaborate percentiles, quartile and coefficient correlation....................................................9
TASK 3..........................................................................................................................................10
3.1: Data analysis through using various charts and graphs.....................................................10
3.2: Representation through using trend line............................................................................14
3.3 Covered in PPT...................................................................................................................15
3.4 Formal report.......................................................................................................................15
TASK 4..........................................................................................................................................16
4.1: Use of information processing tools..................................................................................16
4.2: Critical path analysis..........................................................................................................16
4.3 Analysis of financial tools which are used in decision-making..........................................17
CONCLUSION..............................................................................................................................18
REFERENCES..............................................................................................................................19
INTRODUCTION
Business decision making is the process of examining company possible options,
comparing them and selecting corrective course of action. It is an important aspects of any
businesses entity to manage and control there day to day operations. In order to make a perfect
decision, an individual must weight the positives and negatives prospect of each option and
consider all the best alternatives. It is always observed that most of the decision are materialized
in the future. For, generating more positive results company need to analyse regular feedbacks.
Under this project report, various tasks are covered which are explaining the aims and objectives
of research (Ariely and Berns, 2010). The base of research is begun from data collection from
different sources. In order to achieve the desire goals researchers are used so many
methodologies and sampling frameworks in it. The questionnaire is prepared in order to get
customers review regarding the Food for Friends restaurant. The understanding of various,
different graphs and charts are discussed under this which are prepared from the collected data
from the research process. By taking the help of all the information a formal report is prepared to
summarised the entire results into a set format. At last, using of processing tools in research are
elaborated clearly and how financial instrument are used in effective decision making.
TASK 1
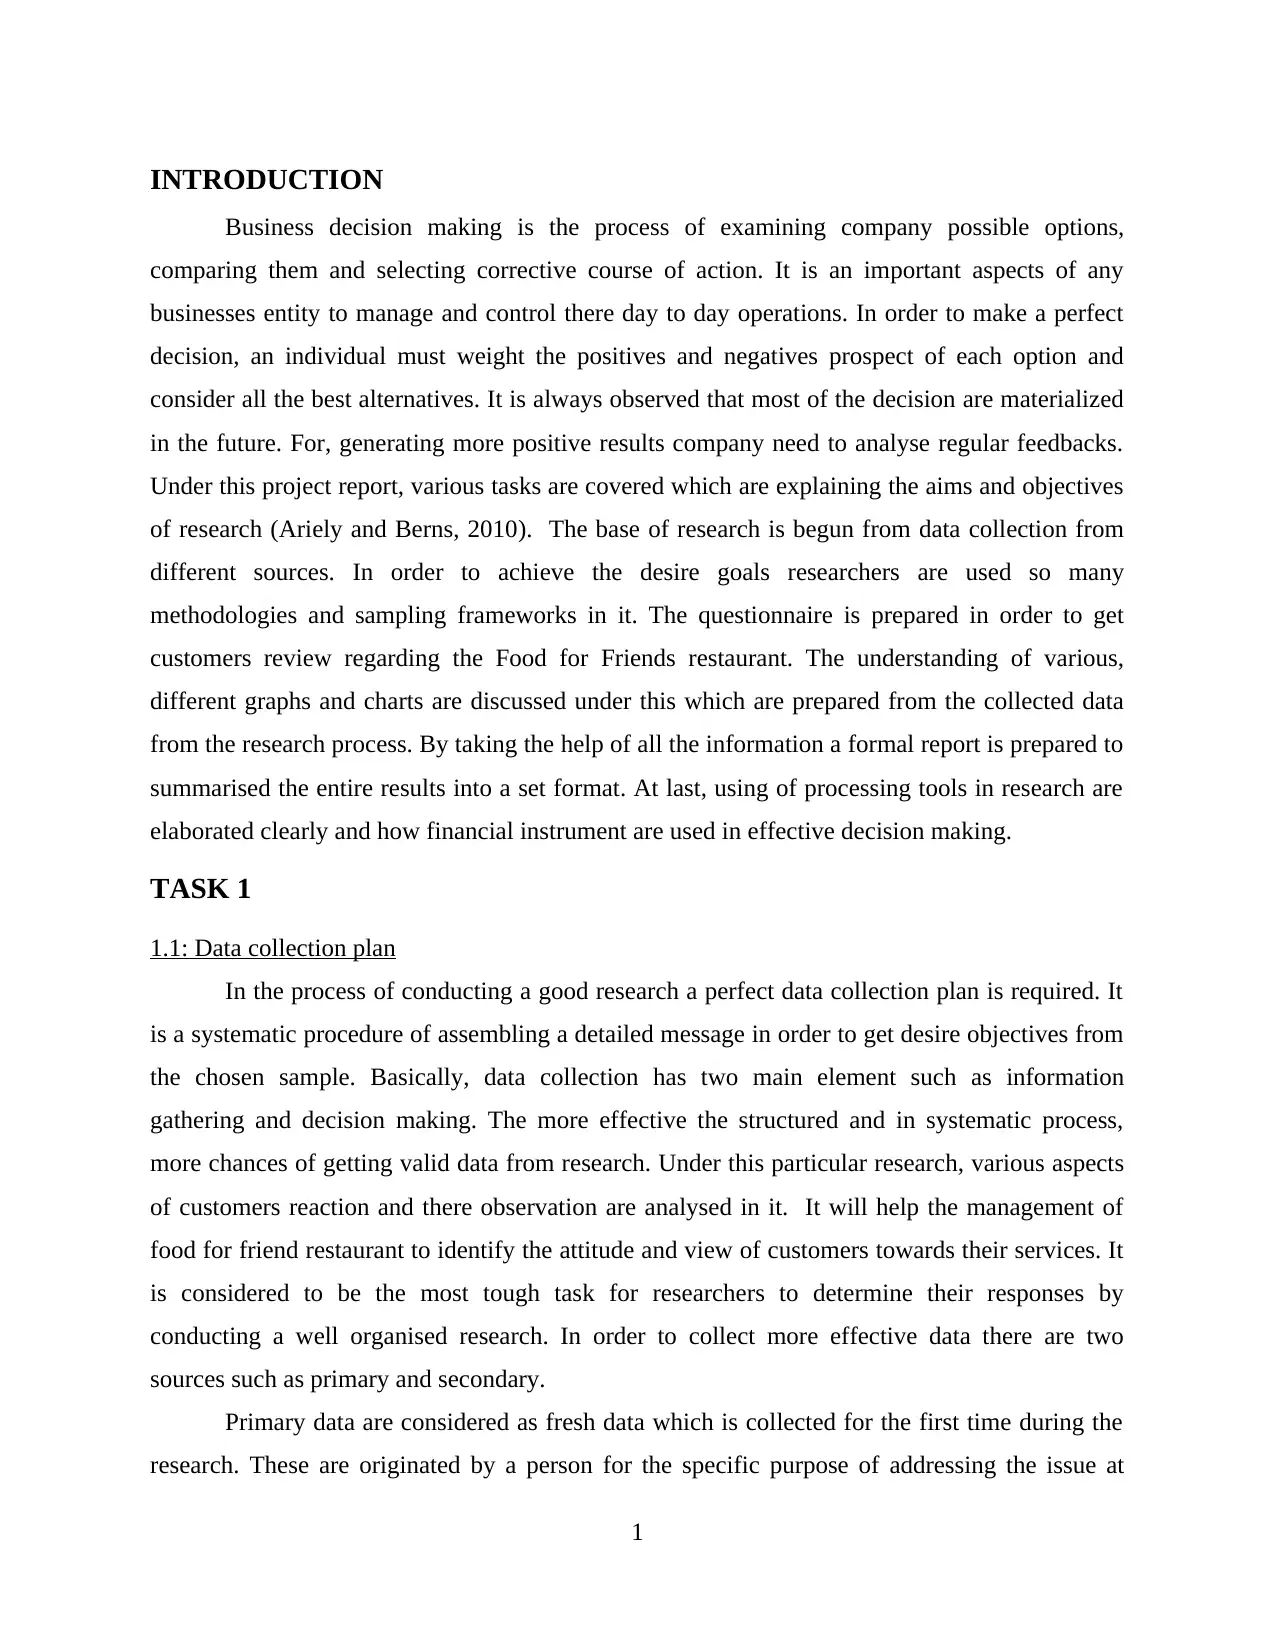
1.1: Data collection plan
In the process of conducting a good research a perfect data collection plan is required. It
is a systematic procedure of assembling a detailed message in order to get desire objectives from
the chosen sample. Basically, data collection has two main element such as information
gathering and decision making. The more effective the structured and in systematic process,
more chances of getting valid data from research. Under this particular research, various aspects
of customers reaction and there observation are analysed in it. It will help the management of
food for friend restaurant to identify the attitude and view of customers towards their services. It
is considered to be the most tough task for researchers to determine their responses by
conducting a well organised research. In order to collect more effective data there are two
sources such as primary and secondary.
Primary data are considered as fresh data which is collected for the first time during the
research. These are originated by a person for the specific purpose of addressing the issue at
1
Business decision making is the process of examining company possible options,
comparing them and selecting corrective course of action. It is an important aspects of any
businesses entity to manage and control there day to day operations. In order to make a perfect
decision, an individual must weight the positives and negatives prospect of each option and
consider all the best alternatives. It is always observed that most of the decision are materialized
in the future. For, generating more positive results company need to analyse regular feedbacks.
Under this project report, various tasks are covered which are explaining the aims and objectives
of research (Ariely and Berns, 2010). The base of research is begun from data collection from
different sources. In order to achieve the desire goals researchers are used so many
methodologies and sampling frameworks in it. The questionnaire is prepared in order to get
customers review regarding the Food for Friends restaurant. The understanding of various,
different graphs and charts are discussed under this which are prepared from the collected data
from the research process. By taking the help of all the information a formal report is prepared to
summarised the entire results into a set format. At last, using of processing tools in research are
elaborated clearly and how financial instrument are used in effective decision making.
TASK 1
1.1: Data collection plan
In the process of conducting a good research a perfect data collection plan is required. It
is a systematic procedure of assembling a detailed message in order to get desire objectives from
the chosen sample. Basically, data collection has two main element such as information
gathering and decision making. The more effective the structured and in systematic process,
more chances of getting valid data from research. Under this particular research, various aspects
of customers reaction and there observation are analysed in it. It will help the management of
food for friend restaurant to identify the attitude and view of customers towards their services. It
is considered to be the most tough task for researchers to determine their responses by
conducting a well organised research. In order to collect more effective data there are two
sources such as primary and secondary.
Primary data are considered as fresh data which is collected for the first time during the
research. These are originated by a person for the specific purpose of addressing the issue at
1
⊘ This is a preview!⊘
Do you want full access?
Subscribe today to unlock all pages.
Trusted by 1+ million students worldwide

hand. While, secondary data are based on the past data which are used to compared current year
information with the past. They are already been collected for objectives other than the problems.
Such kind of data can be located quickly and inexpensive (Bodie, 2013).
Under this data collection process wide range of information is collected from questionnaire,
interviews, contact techniques and through past data. The particular location for conducting a
search are those palaces were operations of food for friends are operating their businesses. Such
as:
Wolverhampton
womb well
Denby
Barnsley
The main objective of the research is focused on those customers which are visiting to
that particular restaurant. It is best way to get more reliable information as they are spending
more quality time in availing the services of restaurants. The time duration for conducting this
research is around 4-5 weeks. It is enough to calculated overall reaction of customers and at the
same time necessary suggestion can be drawn.
One of the more crucial aspect of research is fund which are required to conduct a perfect
research. It require around 5000 pounds for hiring skilled people those are visiting to various
location of restaurant in order to collect valuable information.
Under this process, different methodologies are used for data collection which consist of
a set of questionnaire and personal observation. Sampling is done prior to research in order to
know the impact of research work (Groebner and et. al., 2011). The total number of samples
selected for this research is about 60 which consist of hotel managers, public relation officers,
hotel staffs and customers. The quantitative and qualitative methods are also been used under
this project report. But the more effective one is the quantitative as the entire research is based on
numerical data. So in order to analyse those information various charts and graphs are designed.
1.2: Survey methods used under this project
In process of conducting a well planned research, an individual need to use effective
methodologies which can provide them perfect results. The main objectives of this research is to
achieve the aims and objectives in order to get make effective decision making for the coming
time. Because, it has been analysed that research is the process to find something new aspects
2
Paraphrase This Document
Need a fresh take? Get an instant paraphrase of this document with our AI Paraphraser
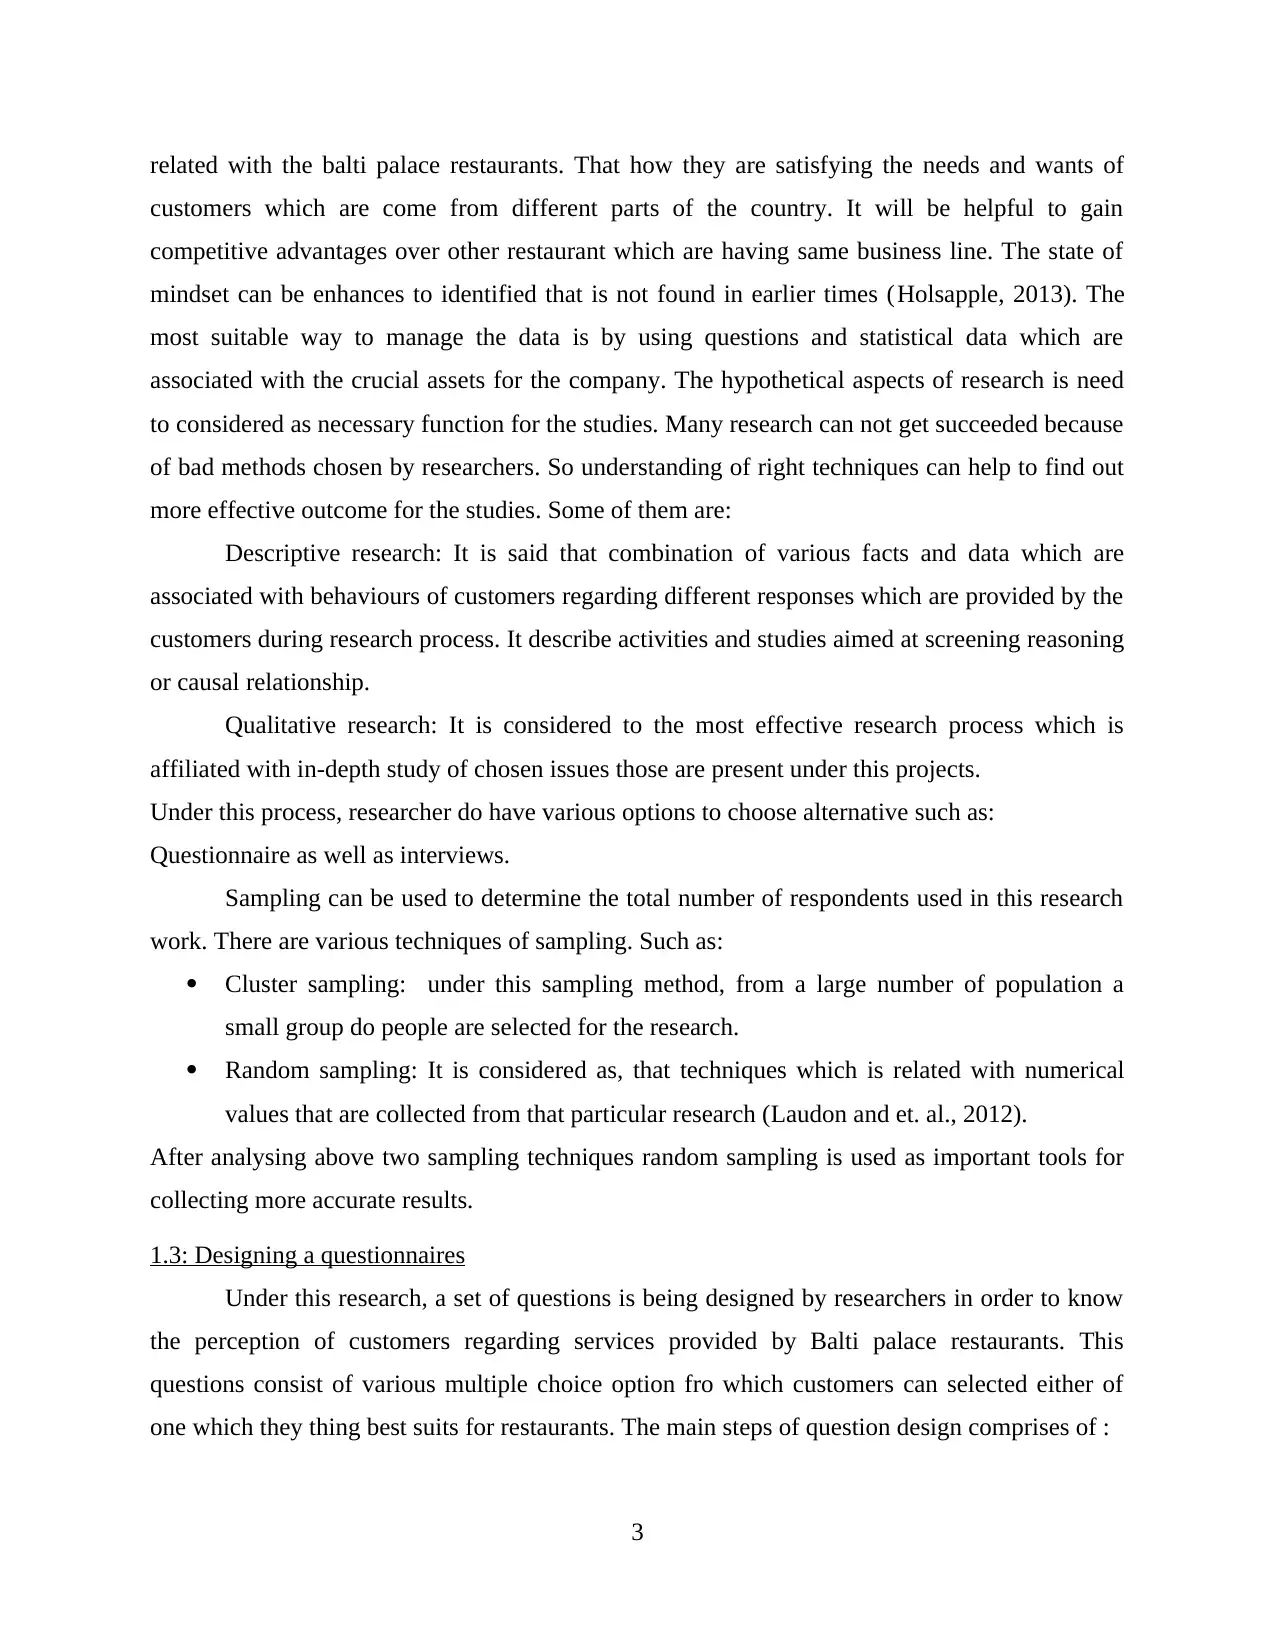
related with the balti palace restaurants. That how they are satisfying the needs and wants of
customers which are come from different parts of the country. It will be helpful to gain
competitive advantages over other restaurant which are having same business line. The state of
mindset can be enhances to identified that is not found in earlier times (Holsapple, 2013). The
most suitable way to manage the data is by using questions and statistical data which are
associated with the crucial assets for the company. The hypothetical aspects of research is need
to considered as necessary function for the studies. Many research can not get succeeded because
of bad methods chosen by researchers. So understanding of right techniques can help to find out
more effective outcome for the studies. Some of them are:
Descriptive research: It is said that combination of various facts and data which are
associated with behaviours of customers regarding different responses which are provided by the
customers during research process. It describe activities and studies aimed at screening reasoning
or causal relationship.
Qualitative research: It is considered to the most effective research process which is
affiliated with in-depth study of chosen issues those are present under this projects.
Under this process, researcher do have various options to choose alternative such as:
Questionnaire as well as interviews.
Sampling can be used to determine the total number of respondents used in this research
work. There are various techniques of sampling. Such as:
Cluster sampling: under this sampling method, from a large number of population a
small group do people are selected for the research.
Random sampling: It is considered as, that techniques which is related with numerical
values that are collected from that particular research (Laudon and et. al., 2012).
After analysing above two sampling techniques random sampling is used as important tools for
collecting more accurate results.
1.3: Designing a questionnaires
Under this research, a set of questions is being designed by researchers in order to know
the perception of customers regarding services provided by Balti palace restaurants. This
questions consist of various multiple choice option fro which customers can selected either of
one which they thing best suits for restaurants. The main steps of question design comprises of :
3
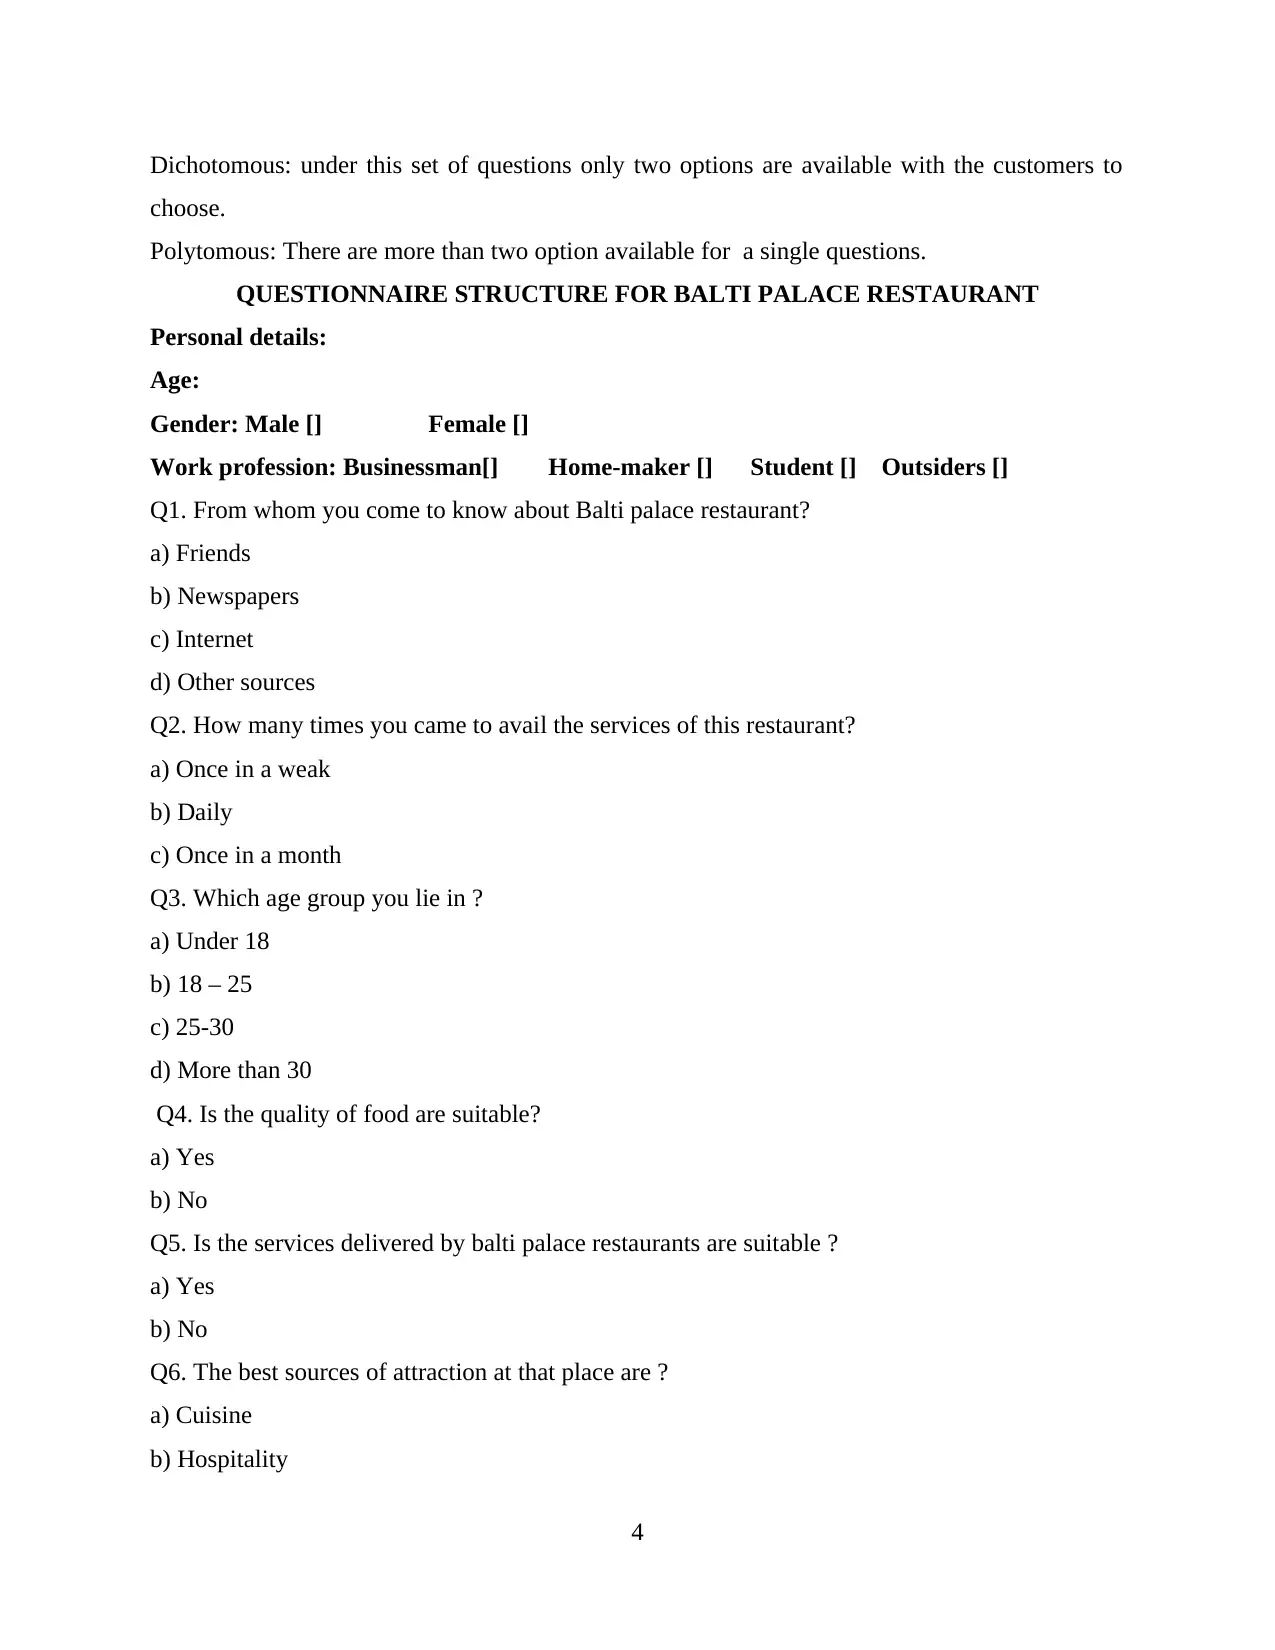
Dichotomous: under this set of questions only two options are available with the customers to
choose.
Polytomous: There are more than two option available for a single questions.
QUESTIONNAIRE STRUCTURE FOR BALTI PALACE RESTAURANT
Personal details:
Age:
Gender: Male [] Female []
Work profession: Businessman[] Home-maker [] Student [] Outsiders []
Q1. From whom you come to know about Balti palace restaurant?
a) Friends
b) Newspapers
c) Internet
d) Other sources
Q2. How many times you came to avail the services of this restaurant?
a) Once in a weak
b) Daily
c) Once in a month
Q3. Which age group you lie in ?
a) Under 18
b) 18 – 25
c) 25-30
d) More than 30
Q4. Is the quality of food are suitable?
a) Yes
b) No
Q5. Is the services delivered by balti palace restaurants are suitable ?
a) Yes
b) No
Q6. The best sources of attraction at that place are ?
a) Cuisine
b) Hospitality
4
⊘ This is a preview!⊘
Do you want full access?
Subscribe today to unlock all pages.
Trusted by 1+ million students worldwide
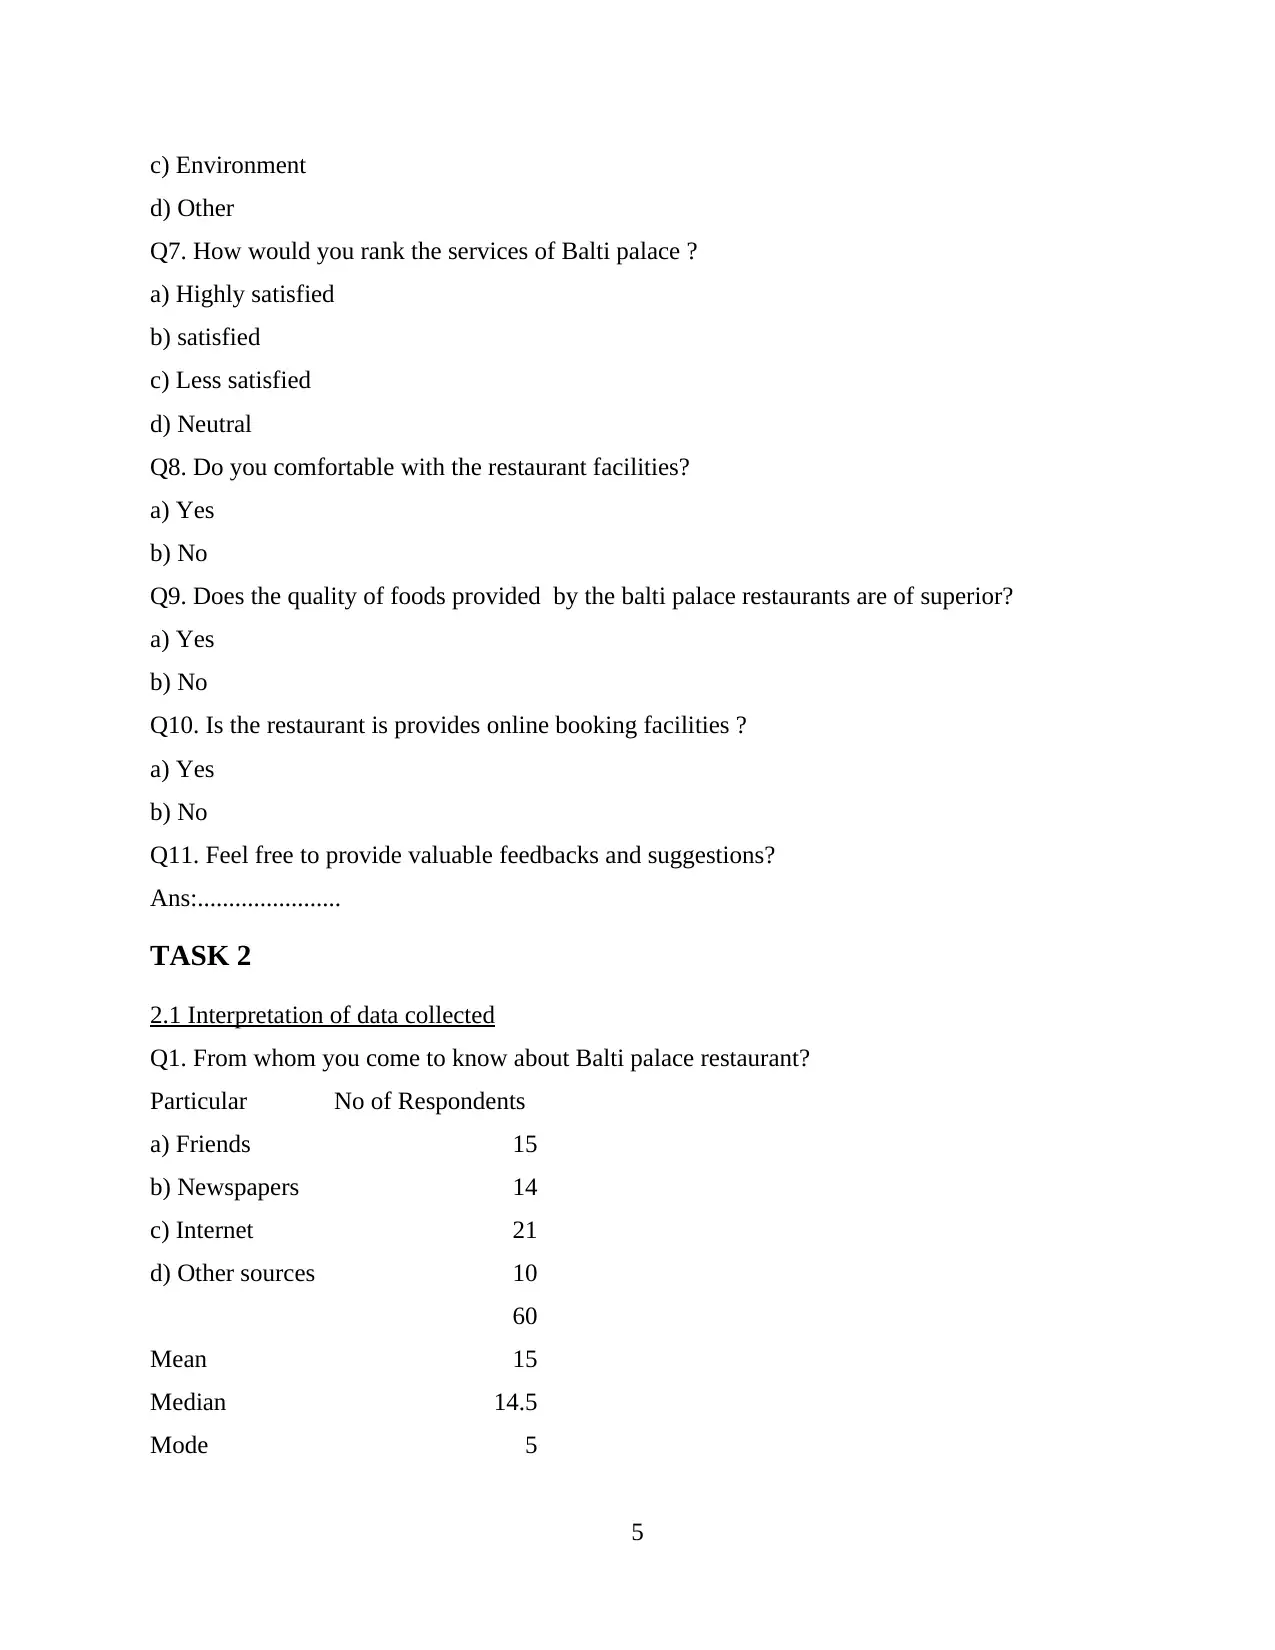
c) Environment
d) Other
Q7. How would you rank the services of Balti palace ?
a) Highly satisfied
b) satisfied
c) Less satisfied
d) Neutral
Q8. Do you comfortable with the restaurant facilities?
a) Yes
b) No
Q9. Does the quality of foods provided by the balti palace restaurants are of superior?
a) Yes
b) No
Q10. Is the restaurant is provides online booking facilities ?
a) Yes
b) No
Q11. Feel free to provide valuable feedbacks and suggestions?
Ans:.......................
TASK 2
2.1 Interpretation of data collected
Q1. From whom you come to know about Balti palace restaurant?
Particular No of Respondents
a) Friends 15
b) Newspapers 14
c) Internet 21
d) Other sources 10
60
Mean 15
Median 14.5
Mode 5
5
Paraphrase This Document
Need a fresh take? Get an instant paraphrase of this document with our AI Paraphraser
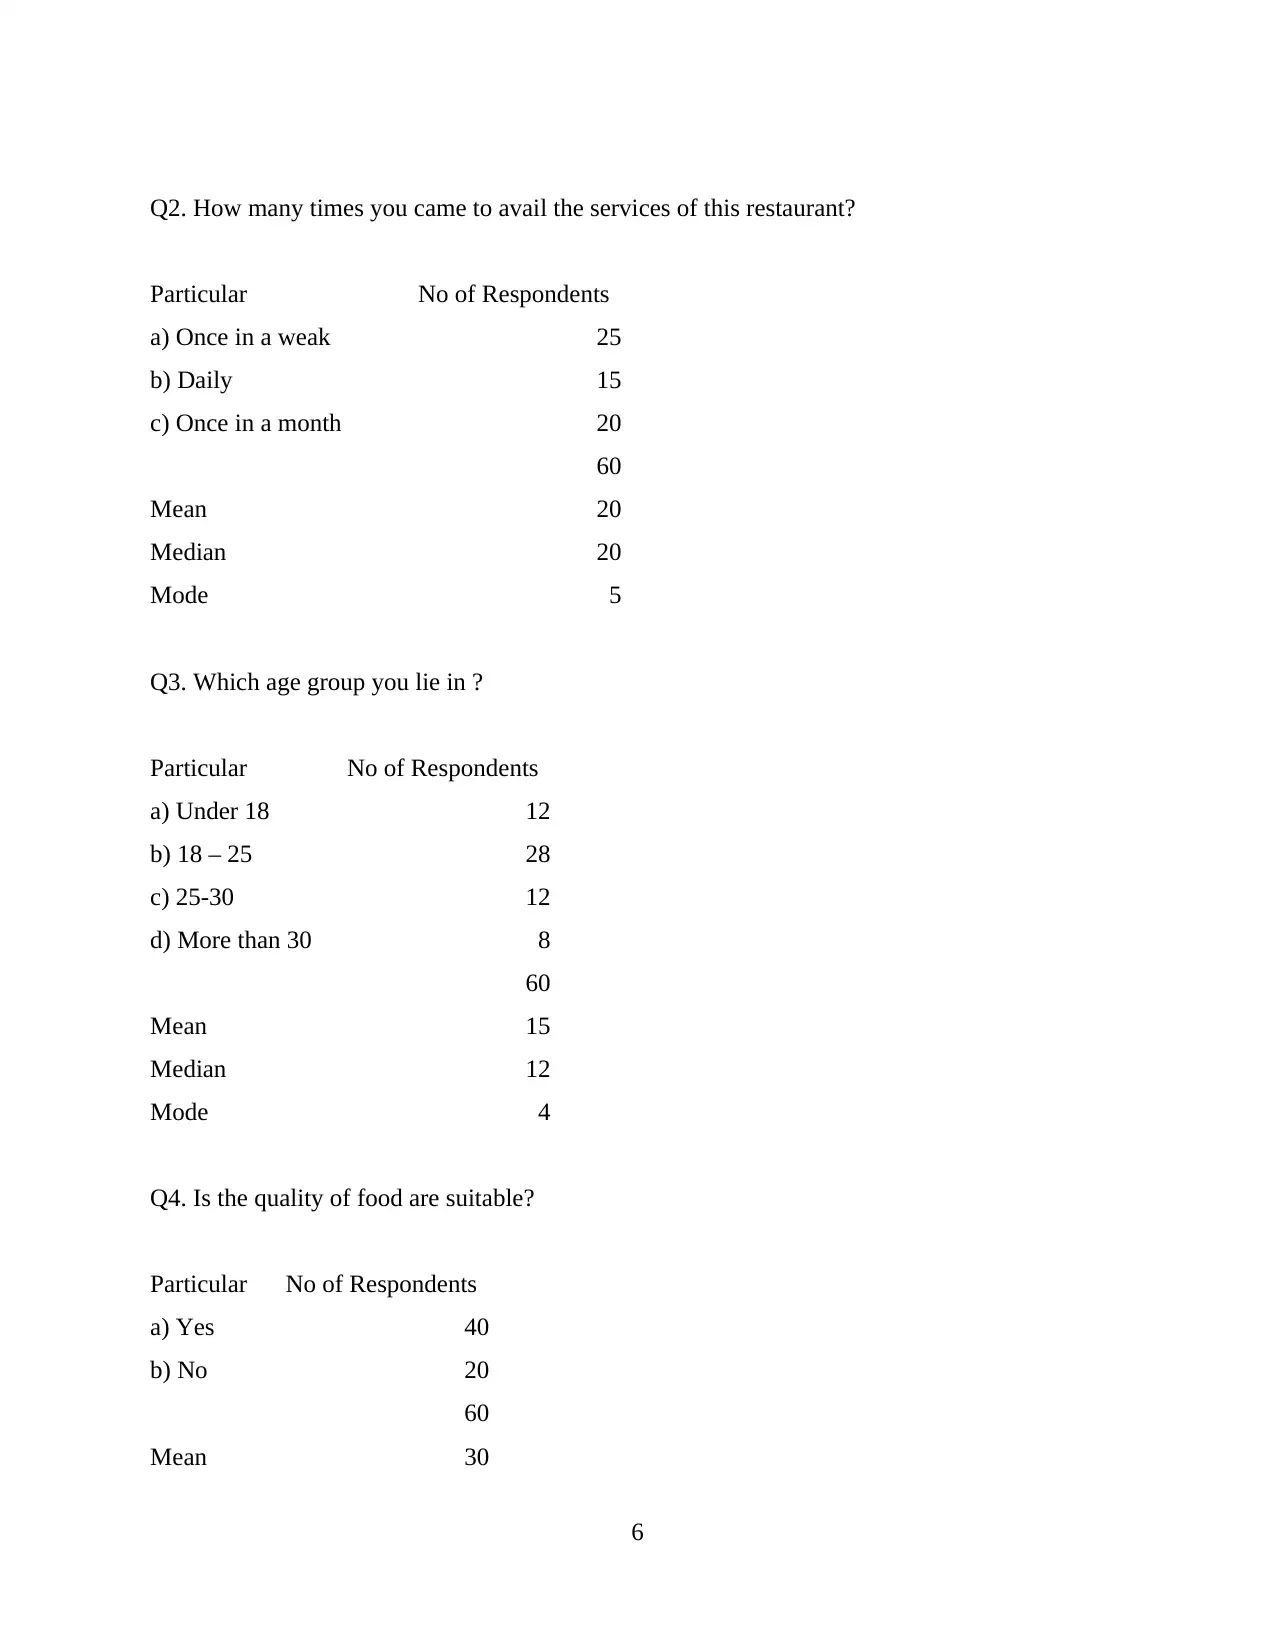
Q2. How many times you came to avail the services of this restaurant?
Particular No of Respondents
a) Once in a weak 25
b) Daily 15
c) Once in a month 20
60
Mean 20
Median 20
Mode 5
Q3. Which age group you lie in ?
Particular No of Respondents
a) Under 18 12
b) 18 – 25 28
c) 25-30 12
d) More than 30 8
60
Mean 15
Median 12
Mode 4
Q4. Is the quality of food are suitable?
Particular No of Respondents
a) Yes 40
b) No 20
60
Mean 30
6
Particular No of Respondents
a) Once in a weak 25
b) Daily 15
c) Once in a month 20
60
Mean 20
Median 20
Mode 5
Q3. Which age group you lie in ?
Particular No of Respondents
a) Under 18 12
b) 18 – 25 28
c) 25-30 12
d) More than 30 8
60
Mean 15
Median 12
Mode 4
Q4. Is the quality of food are suitable?
Particular No of Respondents
a) Yes 40
b) No 20
60
Mean 30
6
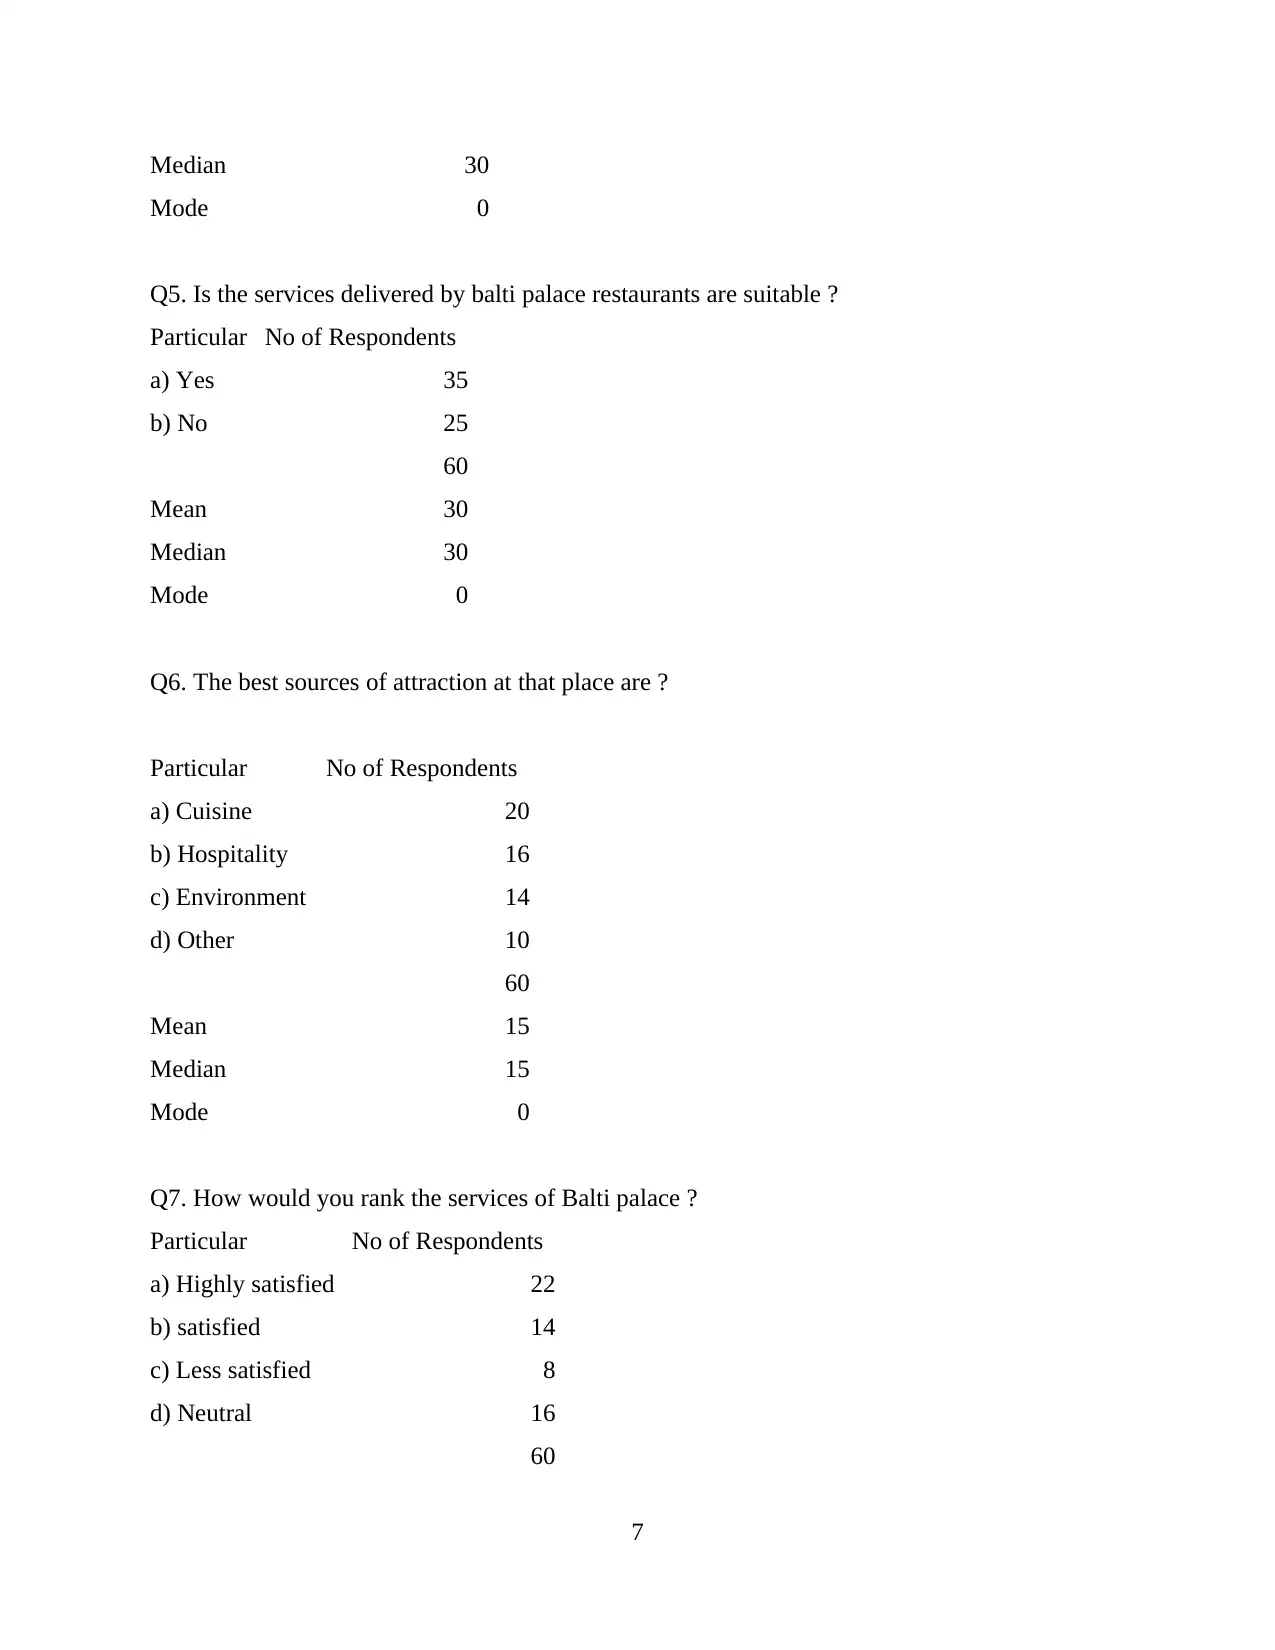
Median 30
Mode 0
Q5. Is the services delivered by balti palace restaurants are suitable ?
Particular No of Respondents
a) Yes 35
b) No 25
60
Mean 30
Median 30
Mode 0
Q6. The best sources of attraction at that place are ?
Particular No of Respondents
a) Cuisine 20
b) Hospitality 16
c) Environment 14
d) Other 10
60
Mean 15
Median 15
Mode 0
Q7. How would you rank the services of Balti palace ?
Particular No of Respondents
a) Highly satisfied 22
b) satisfied 14
c) Less satisfied 8
d) Neutral 16
60
7
Mode 0
Q5. Is the services delivered by balti palace restaurants are suitable ?
Particular No of Respondents
a) Yes 35
b) No 25
60
Mean 30
Median 30
Mode 0
Q6. The best sources of attraction at that place are ?
Particular No of Respondents
a) Cuisine 20
b) Hospitality 16
c) Environment 14
d) Other 10
60
Mean 15
Median 15
Mode 0
Q7. How would you rank the services of Balti palace ?
Particular No of Respondents
a) Highly satisfied 22
b) satisfied 14
c) Less satisfied 8
d) Neutral 16
60
7
⊘ This is a preview!⊘
Do you want full access?
Subscribe today to unlock all pages.
Trusted by 1+ million students worldwide
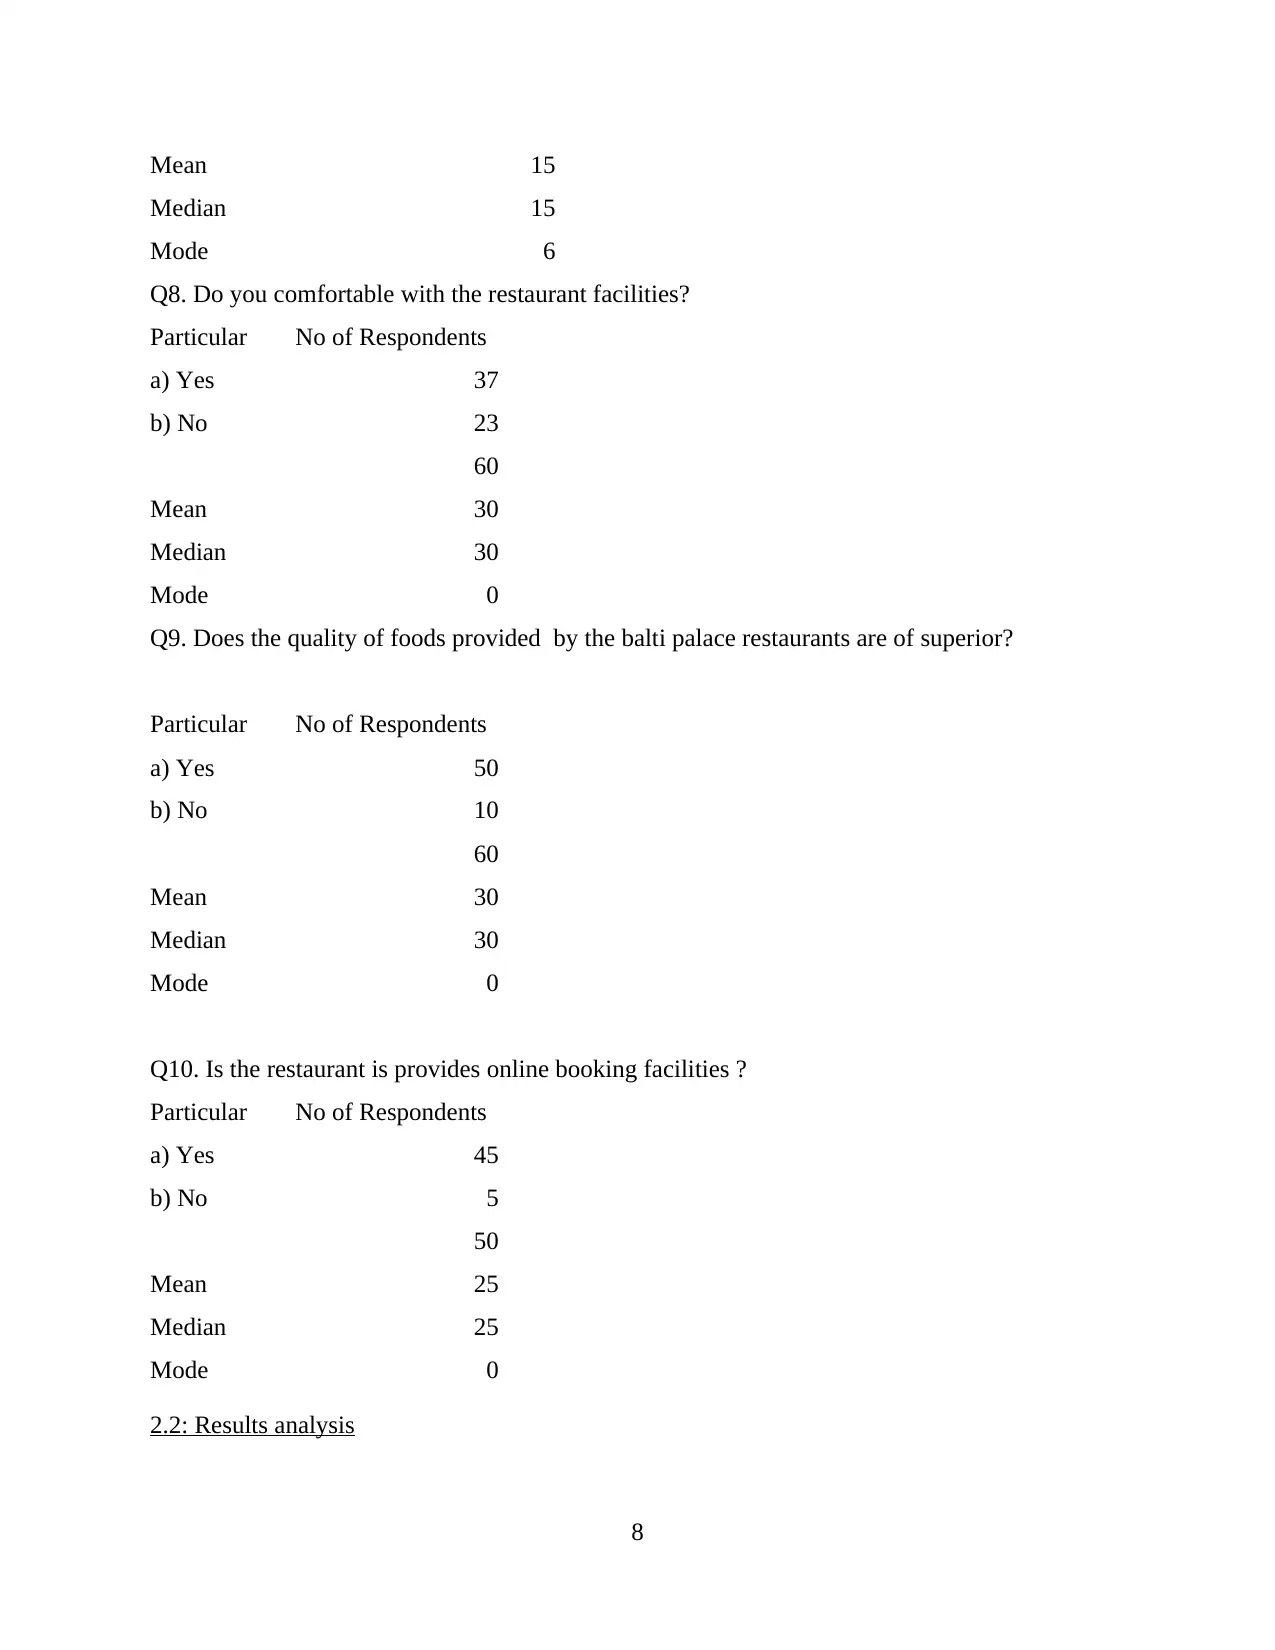
Mean 15
Median 15
Mode 6
Q8. Do you comfortable with the restaurant facilities?
Particular No of Respondents
a) Yes 37
b) No 23
60
Mean 30
Median 30
Mode 0
Q9. Does the quality of foods provided by the balti palace restaurants are of superior?
Particular No of Respondents
a) Yes 50
b) No 10
60
Mean 30
Median 30
Mode 0
Q10. Is the restaurant is provides online booking facilities ?
Particular No of Respondents
a) Yes 45
b) No 5
50
Mean 25
Median 25
Mode 0
2.2: Results analysis
8
Paraphrase This Document
Need a fresh take? Get an instant paraphrase of this document with our AI Paraphraser
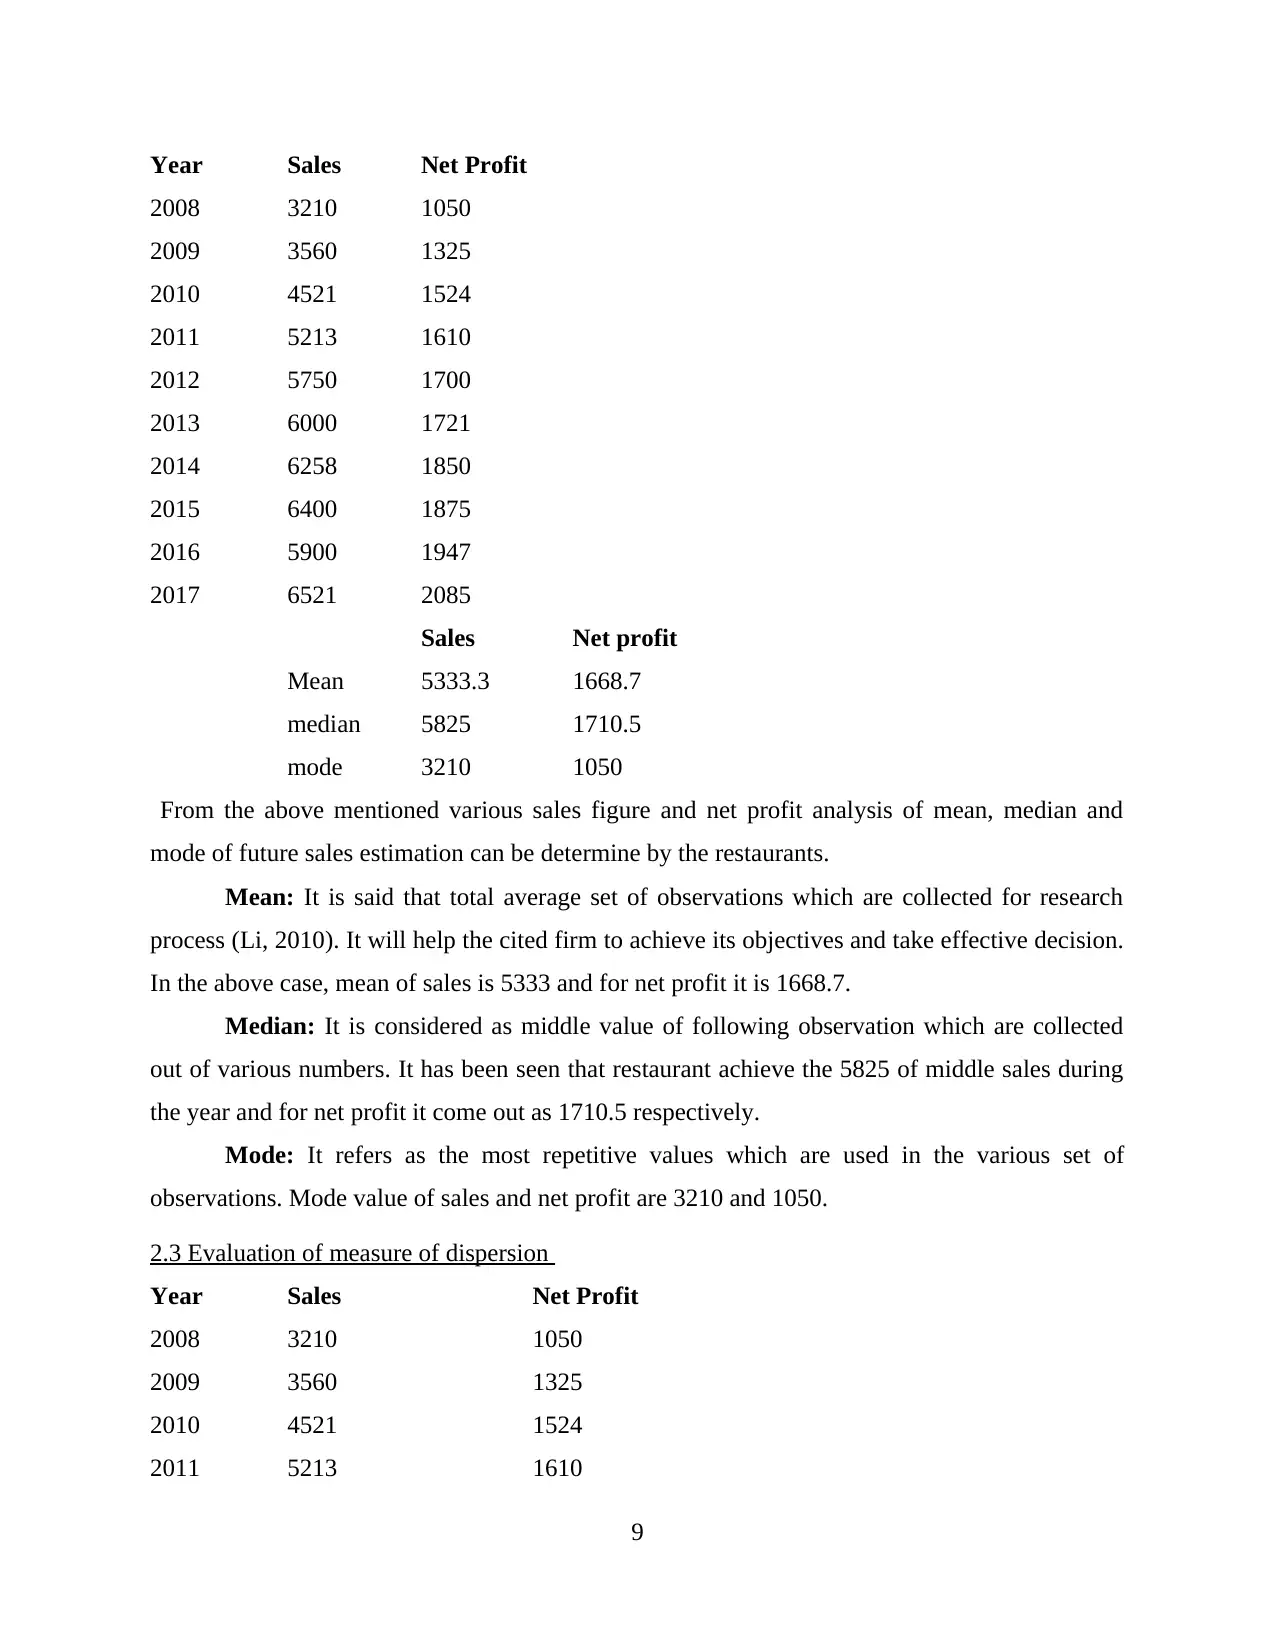
Year Sales Net Profit
2008 3210 1050
2009 3560 1325
2010 4521 1524
2011 5213 1610
2012 5750 1700
2013 6000 1721
2014 6258 1850
2015 6400 1875
2016 5900 1947
2017 6521 2085
Sales Net profit
Mean 5333.3 1668.7
median 5825 1710.5
mode 3210 1050
From the above mentioned various sales figure and net profit analysis of mean, median and
mode of future sales estimation can be determine by the restaurants.
Mean: It is said that total average set of observations which are collected for research
process (Li, 2010). It will help the cited firm to achieve its objectives and take effective decision.
In the above case, mean of sales is 5333 and for net profit it is 1668.7.
Median: It is considered as middle value of following observation which are collected
out of various numbers. It has been seen that restaurant achieve the 5825 of middle sales during
the year and for net profit it come out as 1710.5 respectively.
Mode: It refers as the most repetitive values which are used in the various set of
observations. Mode value of sales and net profit are 3210 and 1050.
2.3 Evaluation of measure of dispersion
Year Sales Net Profit
2008 3210 1050
2009 3560 1325
2010 4521 1524
2011 5213 1610
9
2008 3210 1050
2009 3560 1325
2010 4521 1524
2011 5213 1610
2012 5750 1700
2013 6000 1721
2014 6258 1850
2015 6400 1875
2016 5900 1947
2017 6521 2085
Sales Net profit
Mean 5333.3 1668.7
median 5825 1710.5
mode 3210 1050
From the above mentioned various sales figure and net profit analysis of mean, median and
mode of future sales estimation can be determine by the restaurants.
Mean: It is said that total average set of observations which are collected for research
process (Li, 2010). It will help the cited firm to achieve its objectives and take effective decision.
In the above case, mean of sales is 5333 and for net profit it is 1668.7.
Median: It is considered as middle value of following observation which are collected
out of various numbers. It has been seen that restaurant achieve the 5825 of middle sales during
the year and for net profit it come out as 1710.5 respectively.
Mode: It refers as the most repetitive values which are used in the various set of
observations. Mode value of sales and net profit are 3210 and 1050.
2.3 Evaluation of measure of dispersion
Year Sales Net Profit
2008 3210 1050
2009 3560 1325
2010 4521 1524
2011 5213 1610
9
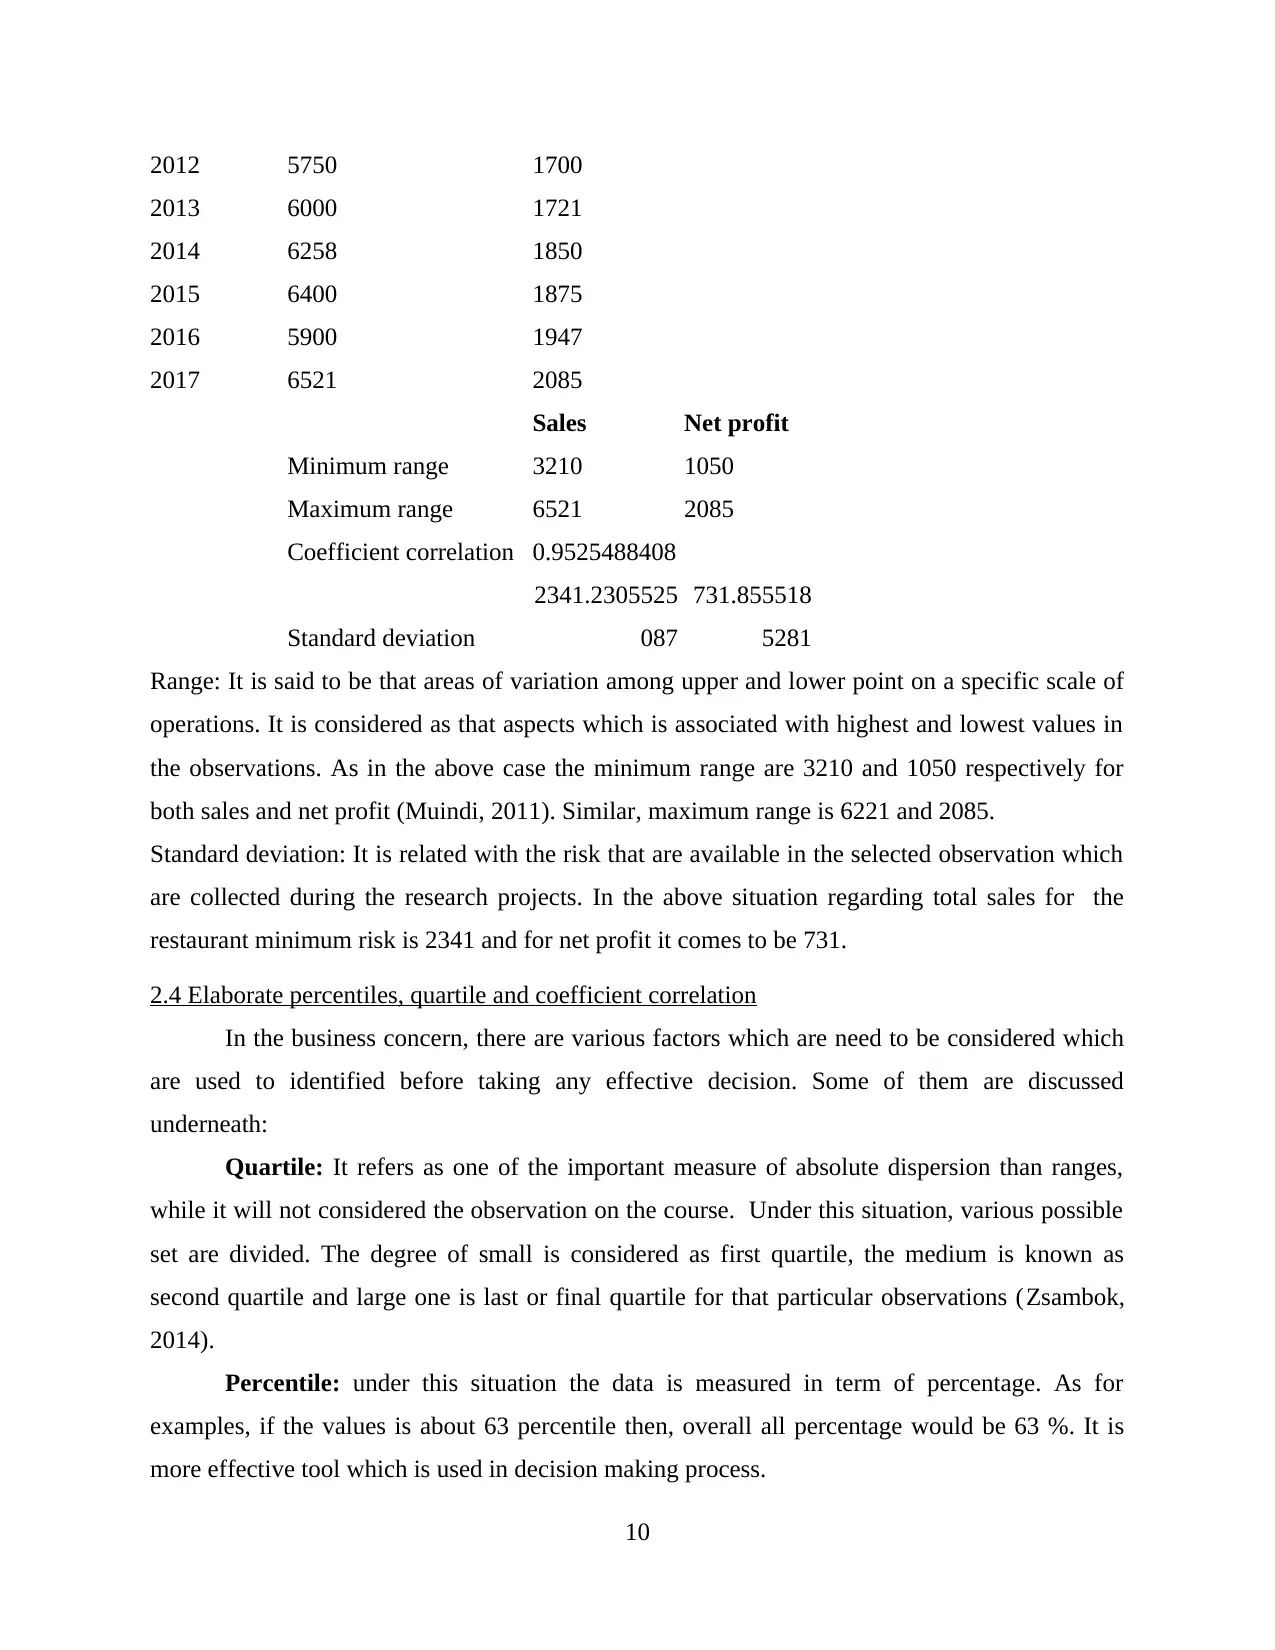
2012 5750 1700
2013 6000 1721
2014 6258 1850
2015 6400 1875
2016 5900 1947
2017 6521 2085
Sales Net profit
Minimum range 3210 1050
Maximum range 6521 2085
Coefficient correlation 0.9525488408
Standard deviation
2341.2305525
087
731.855518
5281
Range: It is said to be that areas of variation among upper and lower point on a specific scale of
operations. It is considered as that aspects which is associated with highest and lowest values in
the observations. As in the above case the minimum range are 3210 and 1050 respectively for
both sales and net profit (Muindi, 2011). Similar, maximum range is 6221 and 2085.
Standard deviation: It is related with the risk that are available in the selected observation which
are collected during the research projects. In the above situation regarding total sales for the
restaurant minimum risk is 2341 and for net profit it comes to be 731.
2.4 Elaborate percentiles, quartile and coefficient correlation
In the business concern, there are various factors which are need to be considered which
are used to identified before taking any effective decision. Some of them are discussed
underneath:
Quartile: It refers as one of the important measure of absolute dispersion than ranges,
while it will not considered the observation on the course. Under this situation, various possible
set are divided. The degree of small is considered as first quartile, the medium is known as
second quartile and large one is last or final quartile for that particular observations (Zsambok,
2014).
Percentile: under this situation the data is measured in term of percentage. As for
examples, if the values is about 63 percentile then, overall all percentage would be 63 %. It is
more effective tool which is used in decision making process.
10
⊘ This is a preview!⊘
Do you want full access?
Subscribe today to unlock all pages.
Trusted by 1+ million students worldwide
1 out of 21
Related Documents


Your All-in-One AI-Powered Toolkit for Academic Success.
+13062052269
info@desklib.com
Available 24*7 on WhatsApp / Email
![[object Object]](/_next/static/media/star-bottom.7253800d.svg)
Unlock your academic potential
Copyright © 2020–2026 A2Z Services. All Rights Reserved. Developed and managed by ZUCOL.