Business Decision Making Report: Data Analysis and Operational Tools
VerifiedAdded on 2019/12/18
|29
|5131
|192
Report
AI Summary
This report explores business decision-making processes, emphasizing the importance of data collection, analysis, and the application of operational tools. It outlines a plan for gathering data from students across multiple campuses, detailing survey methodologies, sampling frames, and questionnaire design. The report then delves into data summarization and analysis, utilizing measures of dispersion and statistical tools like quartiles and correlation coefficients. Furthermore, it addresses the creation of graphs and trend lines to aid in decision-making, along with the development of a formal report for presentation. Finally, the report examines the role of operational and financial tools in supporting effective decision-making, including project planning and critical path analysis. The report aims to provide insights into improving student satisfaction and the college experience by addressing the challenges and implementing effective strategies for the future.
BUSINESS DECISION
MAKING
MAKING
Paraphrase This Document
Need a fresh take? Get an instant paraphrase of this document with our AI Paraphraser
Table of Contents
INTRODUCTION...............................................................................................................3
TASK.1................................................................................................................................3
1.1. Create a plan for collecting data from students across all campuses:......................3
1.2 Survey methodology and sampling frame:...............................................................4
1.3.Questionnaire for collecting the data:.......................................................................6
TASK.2................................................................................................................................8
2.1 & 2.2 Summarizing and analyzing the data:.............................................................8
2.3 Analyze the information utilizing measures of dispersion:.......................................9
3.4 Quartiles, percentiles and coefficient of correlation:..............................................10
TASK.3..............................................................................................................................14
3.1Produce graph:.........................................................................................................14
3.2 Trend lines in spreadsheet diagrams to help with deciding any example in
understudies reactions:..................................................................................................15
3.3 covered in PPT:.......................................................................................................17
3.4 formal report for presentation to QAA....................................................................17
TASK 4..............................................................................................................................18
4.1 How operational tools assist in decision making:...................................................18
4.2.project plan and determine the critical path:...........................................................19
4.3 Financial tools for effective decision making:........................................................20
CONCLUSION..................................................................................................................22
REFERENCES..................................................................................................................23
INTRODUCTION
Nowadays business decision making is required in every business organization. As this is
required for the sustainable development for the firm. Now, this has been essential for the
firm to make the strategy so that the long term objectives of the firm could be achieved.
Business could perform better if they could do better decision making in the firm. With
the help of effective decision, company can attain the objectives. Senior managers and
the higher authorities of the firm are the key persons in the association who are making
their business decision in a most effective manner in order to attain the pre determined
objective and this could also help to get the competitive advantage. For incorporating any
business plan, there is also need to gather the data and information and analyze those data
so that the firm would able to understand the need of the market(Vercellis, 2011). This
has been developed in the senior managers’ mind and they will implement those business
plan in an effective manner. To lead the students in a college, the leaders will have to
know the the need or complaints of the students whom you have been represent in front
of the student representative committee and try to resolve the quarries.
TASK.1
1.1. Create a plan for collecting data from students across all campuses:
The strategy or plan to gathering information from the students are as follows:
1. Establishment of retention planning team from various parts or course and various
existing committee, such as students affairs, finance, arts, commerce, etc.
2. each group of team should contain at least 15 members and they should be
charged with the data informed strategy.
3. framing some data persons a part of retention planning team in order to get the
accurate information easily(Tzeng and Huang, 2011).
4. identifying PPRC measures which are relevant to the colleges:
p=persistence, persistency of the students shows the willingness of the students to attend
the lectures and concerned to the college.
P=Progression, this shows the improvement of the students and then gather data for
framing strategy.
⊘ This is a preview!⊘
Do you want full access?
Subscribe today to unlock all pages.
Trusted by 1+ million students worldwide
R=Retention, this will help for displaying the retaining capacity of the students and then
make the strategy.
C=complaints, complaints of the students also need to identifying the problems.
5. To organize “sweep data” within the classroom, with the official data which are
gathered with the PPRC standards and mixing the data into universities database.
The above mentioned information collected from the students, helps for making the plan
or useful strategies.
We can ask data based questions in many ways by ask questions from an individual,
students or classroom(Shouzhen and et. al., 2014). Questions about student academic
performance and both problematical and grade-appropriate activeness can be answered
by gathering data systematically. We have to ask questions by this way:
6. Is the course plan which they are study is too difficult for some students or not?
7. They are happy by doing independent work tasks?
8. They can do large no of assignments by having time and receive reinforcement?
9. New classroom management strategies accompanying to decreases in student
misbehaviour?
10. Is there a difference in mark sheet on in mid term exams when students complete
an assignments a day before?
11. Has the student involved in more social interactions with their buddies?
12. Which subject do you like in the class?
13. Do you like your online attendance system?
14. Which faculty do you like and why is it so?
15. what do you like in your campus and why?
16. Is the quality of food is good which you are eating in the mess?
17. The library of your college is good?
18. Which types of book do you like?
19. The security system of your college is good?
20. Is there is any type of sports activity which do you like?
21. The infrastructure of your college is better according to you?
22. If you like to add on some rules in the college which types of rules do you like?
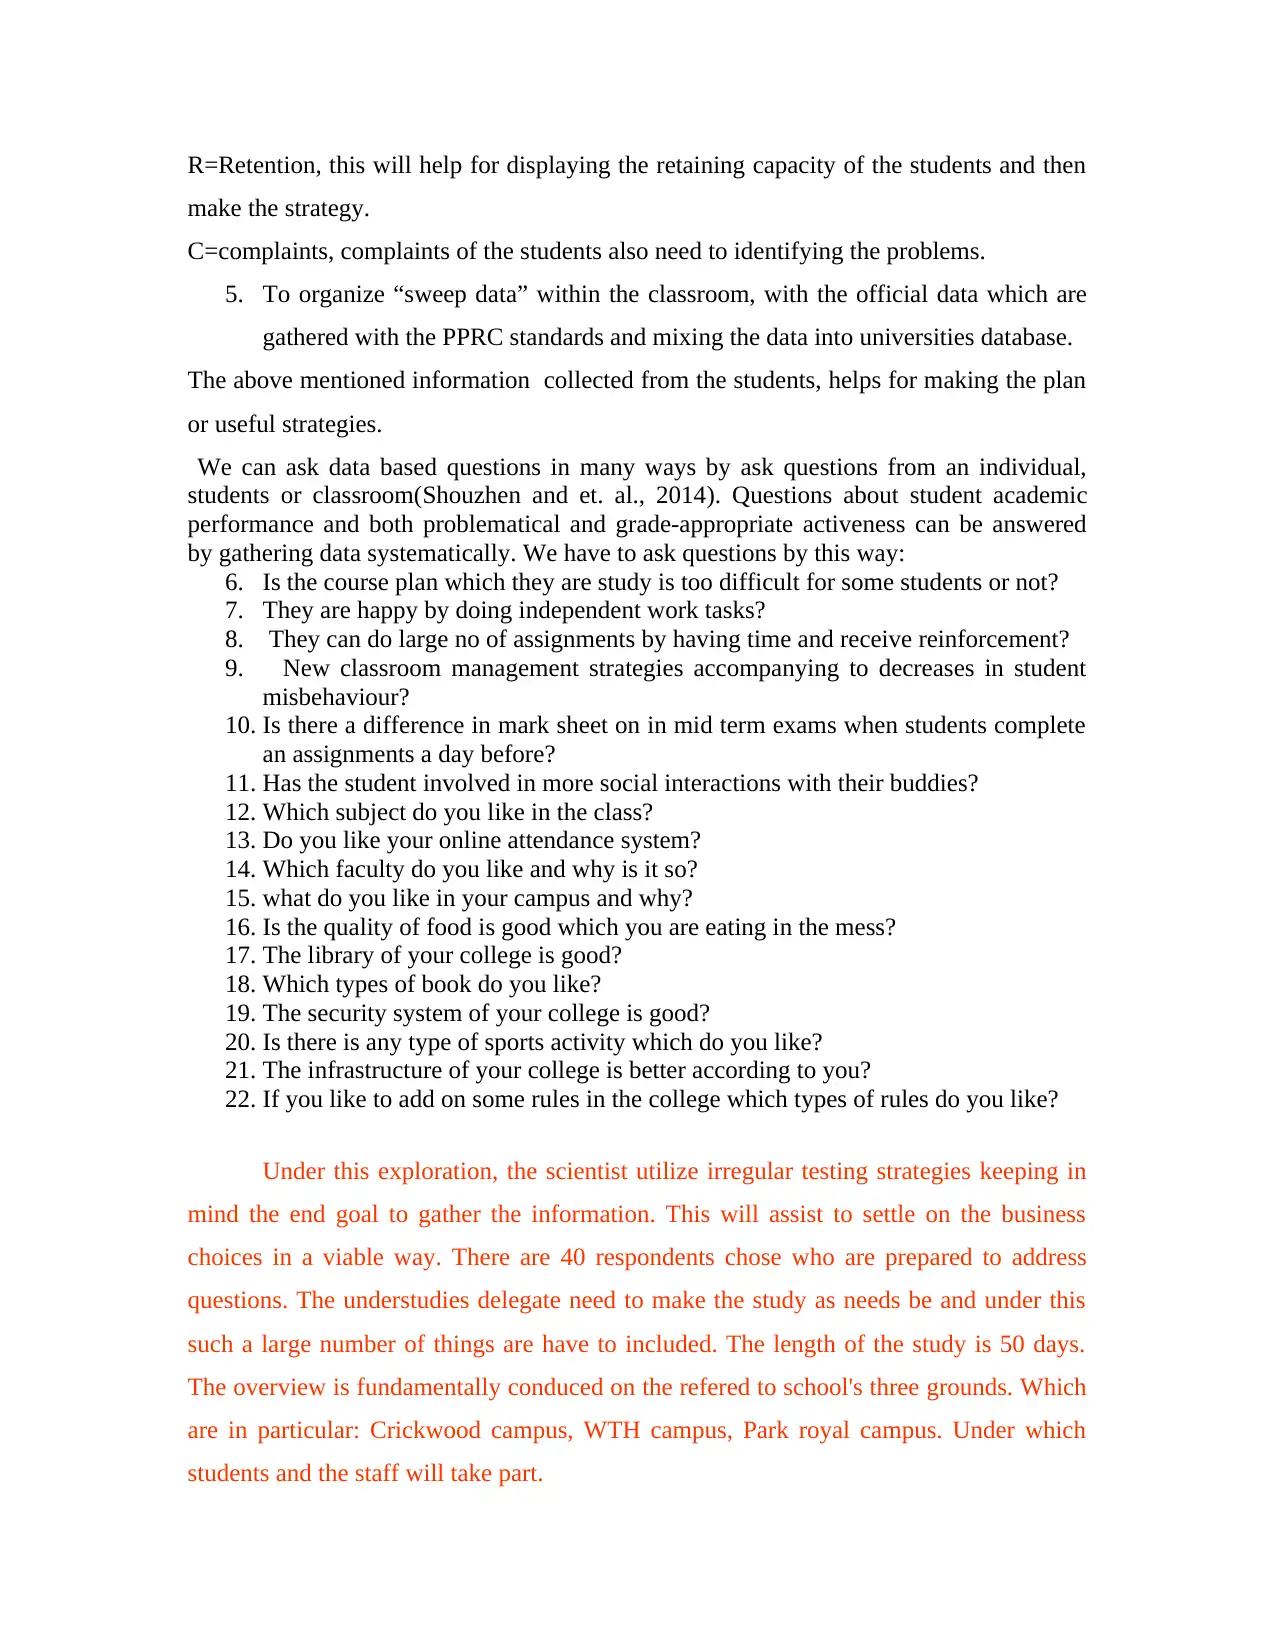
Under this exploration, the scientist utilize irregular testing strategies keeping in
mind the end goal to gather the information. This will assist to settle on the business
choices in a viable way. There are 40 respondents chose who are prepared to address
questions. The understudies delegate need to make the study as needs be and under this
such a large number of things are have to included. The length of the study is 50 days.
The overview is fundamentally conduced on the refered to school's three grounds. Which
are in particular: Crickwood campus, WTH campus, Park royal campus. Under which
students and the staff will take part.
make the strategy.
C=complaints, complaints of the students also need to identifying the problems.
5. To organize “sweep data” within the classroom, with the official data which are
gathered with the PPRC standards and mixing the data into universities database.
The above mentioned information collected from the students, helps for making the plan
or useful strategies.
We can ask data based questions in many ways by ask questions from an individual,
students or classroom(Shouzhen and et. al., 2014). Questions about student academic
performance and both problematical and grade-appropriate activeness can be answered
by gathering data systematically. We have to ask questions by this way:
6. Is the course plan which they are study is too difficult for some students or not?
7. They are happy by doing independent work tasks?
8. They can do large no of assignments by having time and receive reinforcement?
9. New classroom management strategies accompanying to decreases in student
misbehaviour?
10. Is there a difference in mark sheet on in mid term exams when students complete
an assignments a day before?
11. Has the student involved in more social interactions with their buddies?
12. Which subject do you like in the class?
13. Do you like your online attendance system?
14. Which faculty do you like and why is it so?
15. what do you like in your campus and why?
16. Is the quality of food is good which you are eating in the mess?
17. The library of your college is good?
18. Which types of book do you like?
19. The security system of your college is good?
20. Is there is any type of sports activity which do you like?
21. The infrastructure of your college is better according to you?
22. If you like to add on some rules in the college which types of rules do you like?
Under this exploration, the scientist utilize irregular testing strategies keeping in
mind the end goal to gather the information. This will assist to settle on the business
choices in a viable way. There are 40 respondents chose who are prepared to address
questions. The understudies delegate need to make the study as needs be and under this
such a large number of things are have to included. The length of the study is 50 days.
The overview is fundamentally conduced on the refered to school's three grounds. Which
are in particular: Crickwood campus, WTH campus, Park royal campus. Under which
students and the staff will take part.
Paraphrase This Document
Need a fresh take? Get an instant paraphrase of this document with our AI Paraphraser
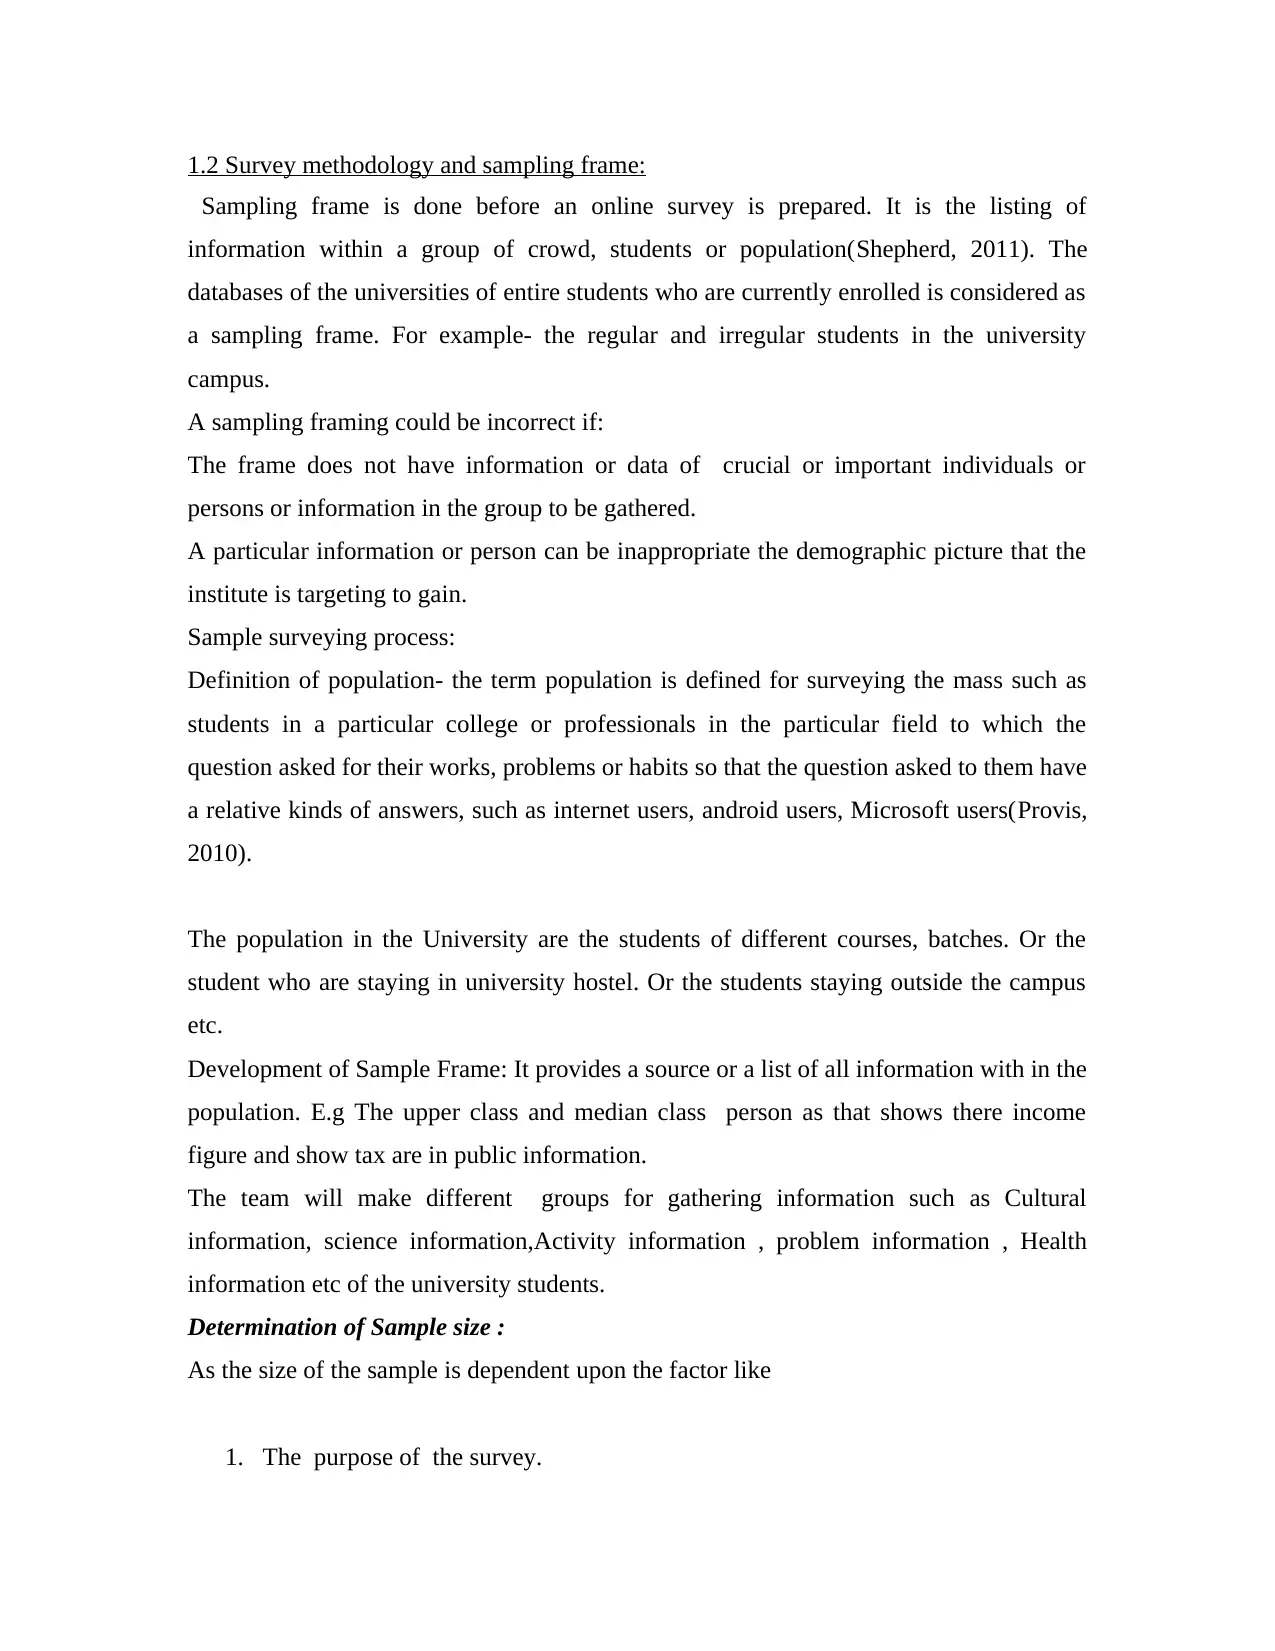
1.2 Survey methodology and sampling frame:
Sampling frame is done before an online survey is prepared. It is the listing of
information within a group of crowd, students or population(Shepherd, 2011). The
databases of the universities of entire students who are currently enrolled is considered as
a sampling frame. For example- the regular and irregular students in the university
campus.
A sampling framing could be incorrect if:
The frame does not have information or data of crucial or important individuals or
persons or information in the group to be gathered.
A particular information or person can be inappropriate the demographic picture that the
institute is targeting to gain.
Sample surveying process:
Definition of population- the term population is defined for surveying the mass such as
students in a particular college or professionals in the particular field to which the
question asked for their works, problems or habits so that the question asked to them have
a relative kinds of answers, such as internet users, android users, Microsoft users(Provis,
2010).
The population in the University are the students of different courses, batches. Or the
student who are staying in university hostel. Or the students staying outside the campus
etc.
Development of Sample Frame: It provides a source or a list of all information with in the
population. E.g The upper class and median class person as that shows there income
figure and show tax are in public information.
The team will make different groups for gathering information such as Cultural
information, science information,Activity information , problem information , Health
information etc of the university students.
Determination of Sample size :
As the size of the sample is dependent upon the factor like
1. The purpose of the survey.
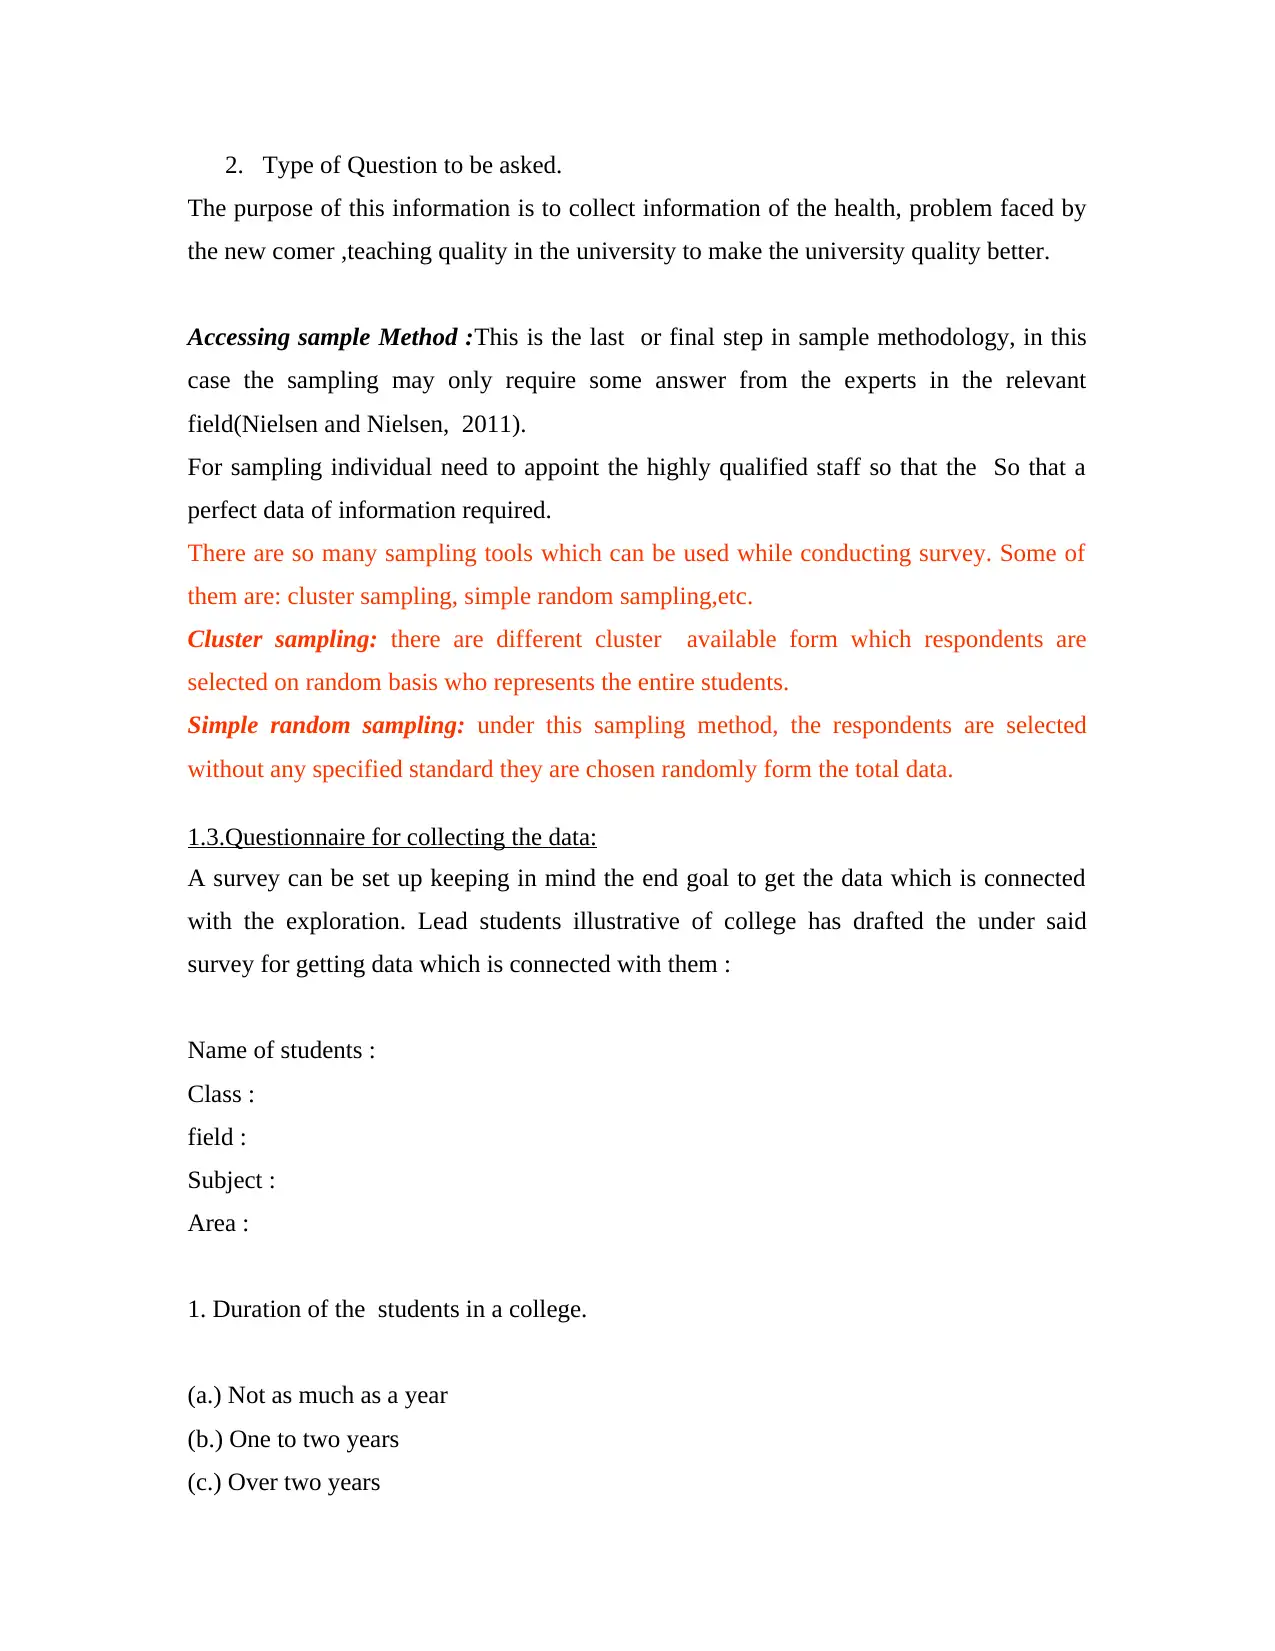
2. Type of Question to be asked.
The purpose of this information is to collect information of the health, problem faced by
the new comer ,teaching quality in the university to make the university quality better.
Accessing sample Method :This is the last or final step in sample methodology, in this
case the sampling may only require some answer from the experts in the relevant
field(Nielsen and Nielsen, 2011).
For sampling individual need to appoint the highly qualified staff so that the So that a
perfect data of information required.
There are so many sampling tools which can be used while conducting survey. Some of
them are: cluster sampling, simple random sampling,etc.
Cluster sampling: there are different cluster available form which respondents are
selected on random basis who represents the entire students.
Simple random sampling: under this sampling method, the respondents are selected
without any specified standard they are chosen randomly form the total data.
1.3.Questionnaire for collecting the data:
A survey can be set up keeping in mind the end goal to get the data which is connected
with the exploration. Lead students illustrative of college has drafted the under said
survey for getting data which is connected with them :
Name of students :
Class :
field :
Subject :
Area :
1. Duration of the students in a college.
(a.) Not as much as a year
(b.) One to two years
(c.) Over two years
⊘ This is a preview!⊘
Do you want full access?
Subscribe today to unlock all pages.
Trusted by 1+ million students worldwide
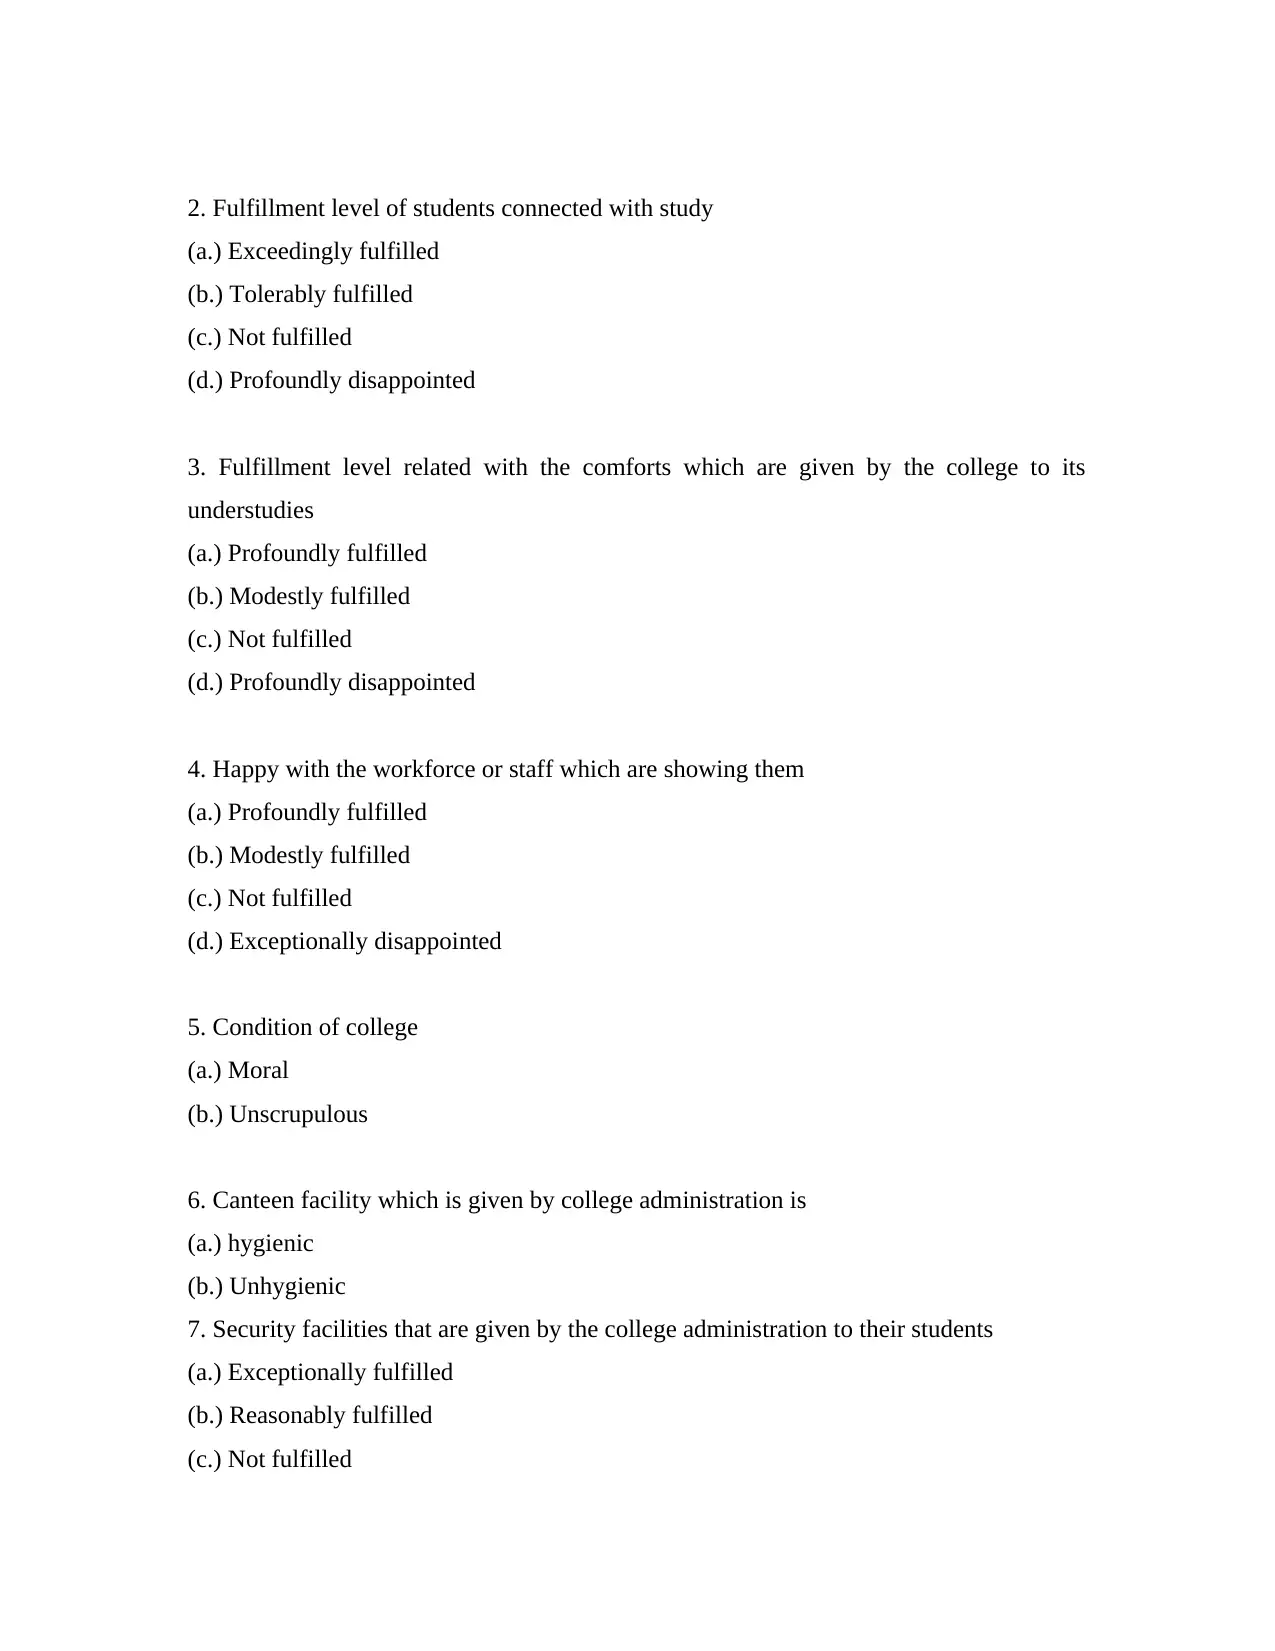
2. Fulfillment level of students connected with study
(a.) Exceedingly fulfilled
(b.) Tolerably fulfilled
(c.) Not fulfilled
(d.) Profoundly disappointed
3. Fulfillment level related with the comforts which are given by the college to its
understudies
(a.) Profoundly fulfilled
(b.) Modestly fulfilled
(c.) Not fulfilled
(d.) Profoundly disappointed
4. Happy with the workforce or staff which are showing them
(a.) Profoundly fulfilled
(b.) Modestly fulfilled
(c.) Not fulfilled
(d.) Exceptionally disappointed
5. Condition of college
(a.) Moral
(b.) Unscrupulous
6. Canteen facility which is given by college administration is
(a.) hygienic
(b.) Unhygienic
7. Security facilities that are given by the college administration to their students
(a.) Exceptionally fulfilled
(b.) Reasonably fulfilled
(c.) Not fulfilled
Paraphrase This Document
Need a fresh take? Get an instant paraphrase of this document with our AI Paraphraser
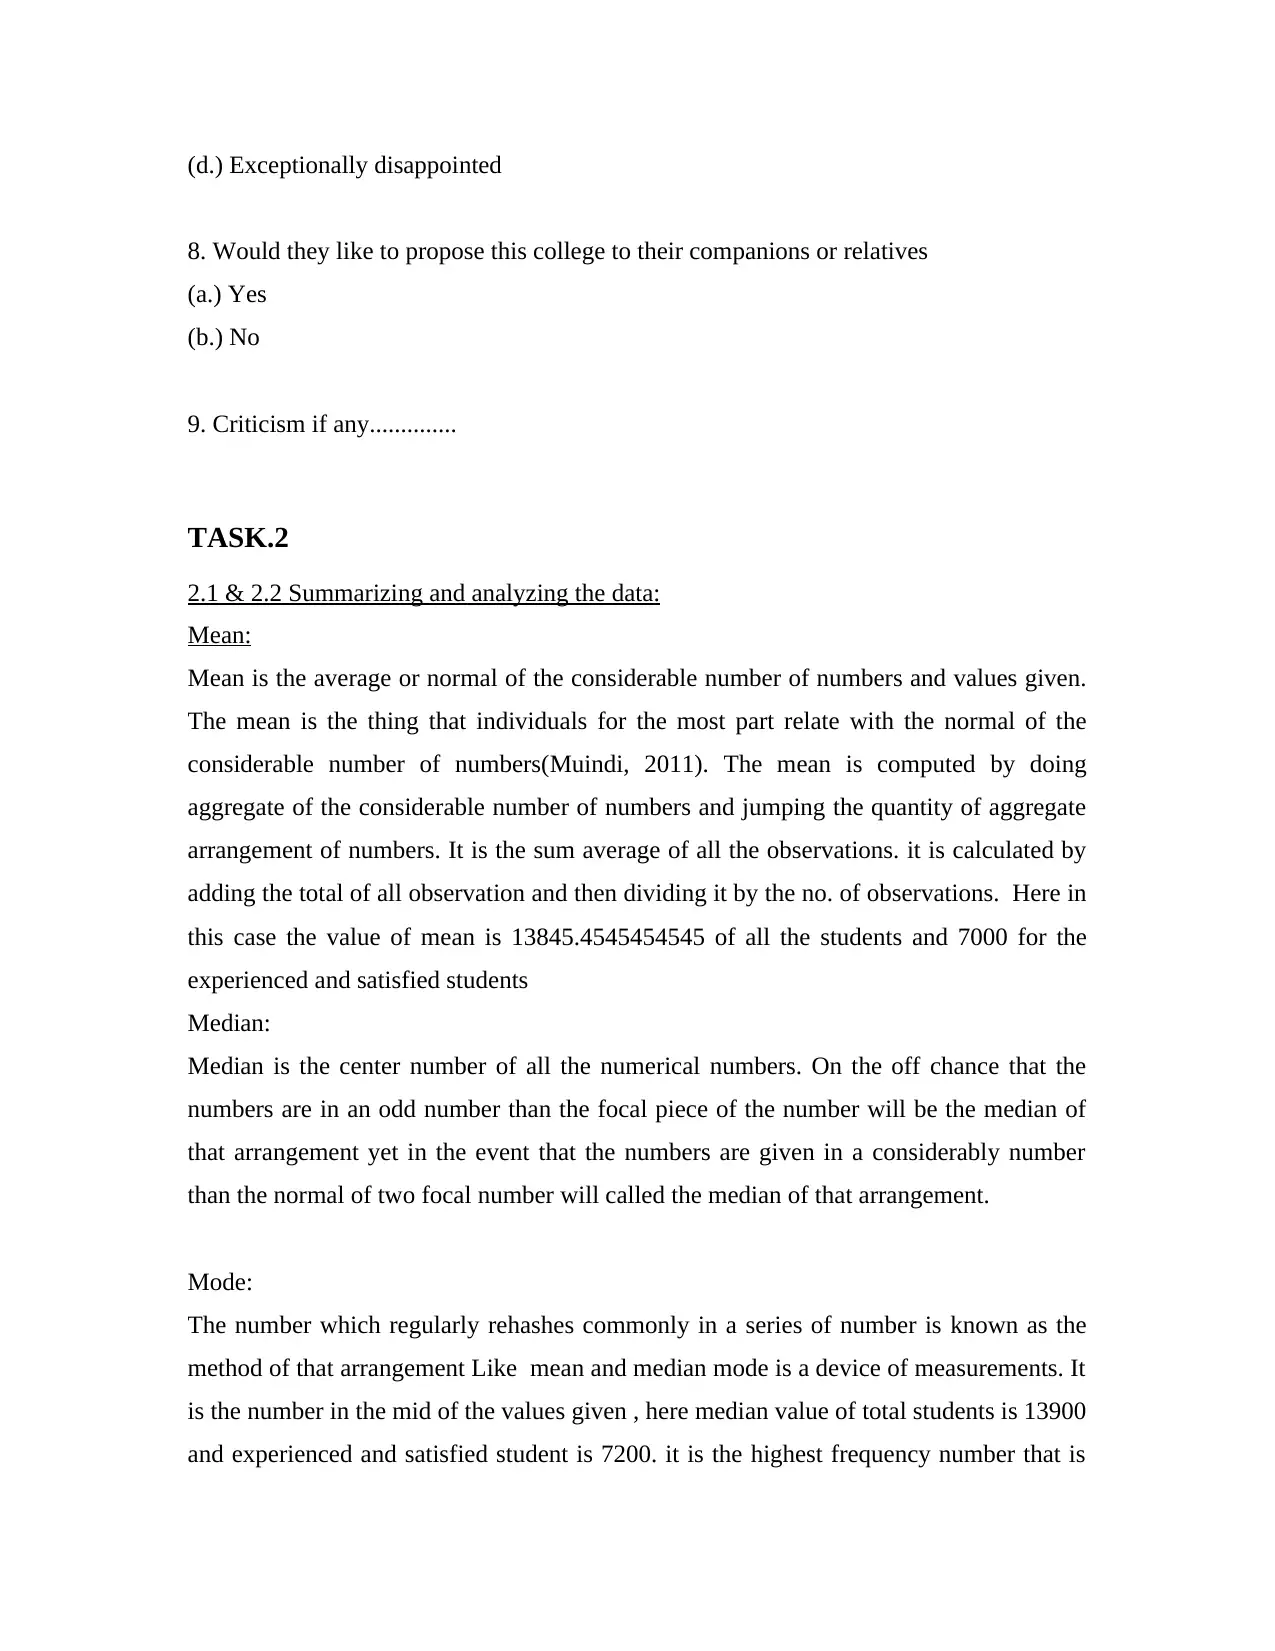
(d.) Exceptionally disappointed
8. Would they like to propose this college to their companions or relatives
(a.) Yes
(b.) No
9. Criticism if any..............
TASK.2
2.1 & 2.2 Summarizing and analyzing the data:
Mean:
Mean is the average or normal of the considerable number of numbers and values given.
The mean is the thing that individuals for the most part relate with the normal of the
considerable number of numbers(Muindi, 2011). The mean is computed by doing
aggregate of the considerable number of numbers and jumping the quantity of aggregate
arrangement of numbers. It is the sum average of all the observations. it is calculated by
adding the total of all observation and then dividing it by the no. of observations. Here in
this case the value of mean is 13845.4545454545 of all the students and 7000 for the
experienced and satisfied students
Median:
Median is the center number of all the numerical numbers. On the off chance that the
numbers are in an odd number than the focal piece of the number will be the median of
that arrangement yet in the event that the numbers are given in a considerably number
than the normal of two focal number will called the median of that arrangement.
Mode:
The number which regularly rehashes commonly in a series of number is known as the
method of that arrangement Like mean and median mode is a device of measurements. It
is the number in the mid of the values given , here median value of total students is 13900
and experienced and satisfied student is 7200. it is the highest frequency number that is
occurred in the series. It is called mode . This number has the most likely possibility of
being selected.
2.3 Analyze the information utilizing measures of dispersion:
dispersion helps in depicting information in measurements and furthermore how
the information is shifted from the other information. There are different measures of
dispersion accessible in statistics like range,standard deviation and difference. Normal
deviation ,inter- quartile are the basic measures of dispersion.
Data of dispersion:
It aides in concentrate the unwavering quality of data(Milovic and Milovic, 2012).
Progressively the information will solid more it will help in finding more precise solution
of the review less dependable the information will brings about finding not exact
solutions. So to use any sort of information in a review the dispersion helps in checking
the dependability of the information .
Level of dispersion:
Level of dispersion aides in ascertaining the fluctuation between two factors. An
incredible measure of scattering will indicate absence of homogeneity between two
factors while then again low measure of scattering will demonstrate high measure of
homogeneity between two factors. Level of Dispersion is a measure of computing
changeability or homogeneity between two factors or to know how the two factors or
same or scraper not quite the same as each other.
Measures of Dispersion
Measures of Dispersion is utilized as a part of ascertaining changeability between two
factors when information is circulated in Frequency or when information is given with
the likelihood(Maxwell, Jeffrey and Lévesque, 2011). Standard deviation is one of
measure of scattering which is utilized for knowing the connection between two factors
when the information accompanies the likelihood. Range and change are likewise used to
⊘ This is a preview!⊘
Do you want full access?
Subscribe today to unlock all pages.
Trusted by 1+ million students worldwide
knowing the inconstancy between the factors when the concocts the recurrence or with
the likelihood.
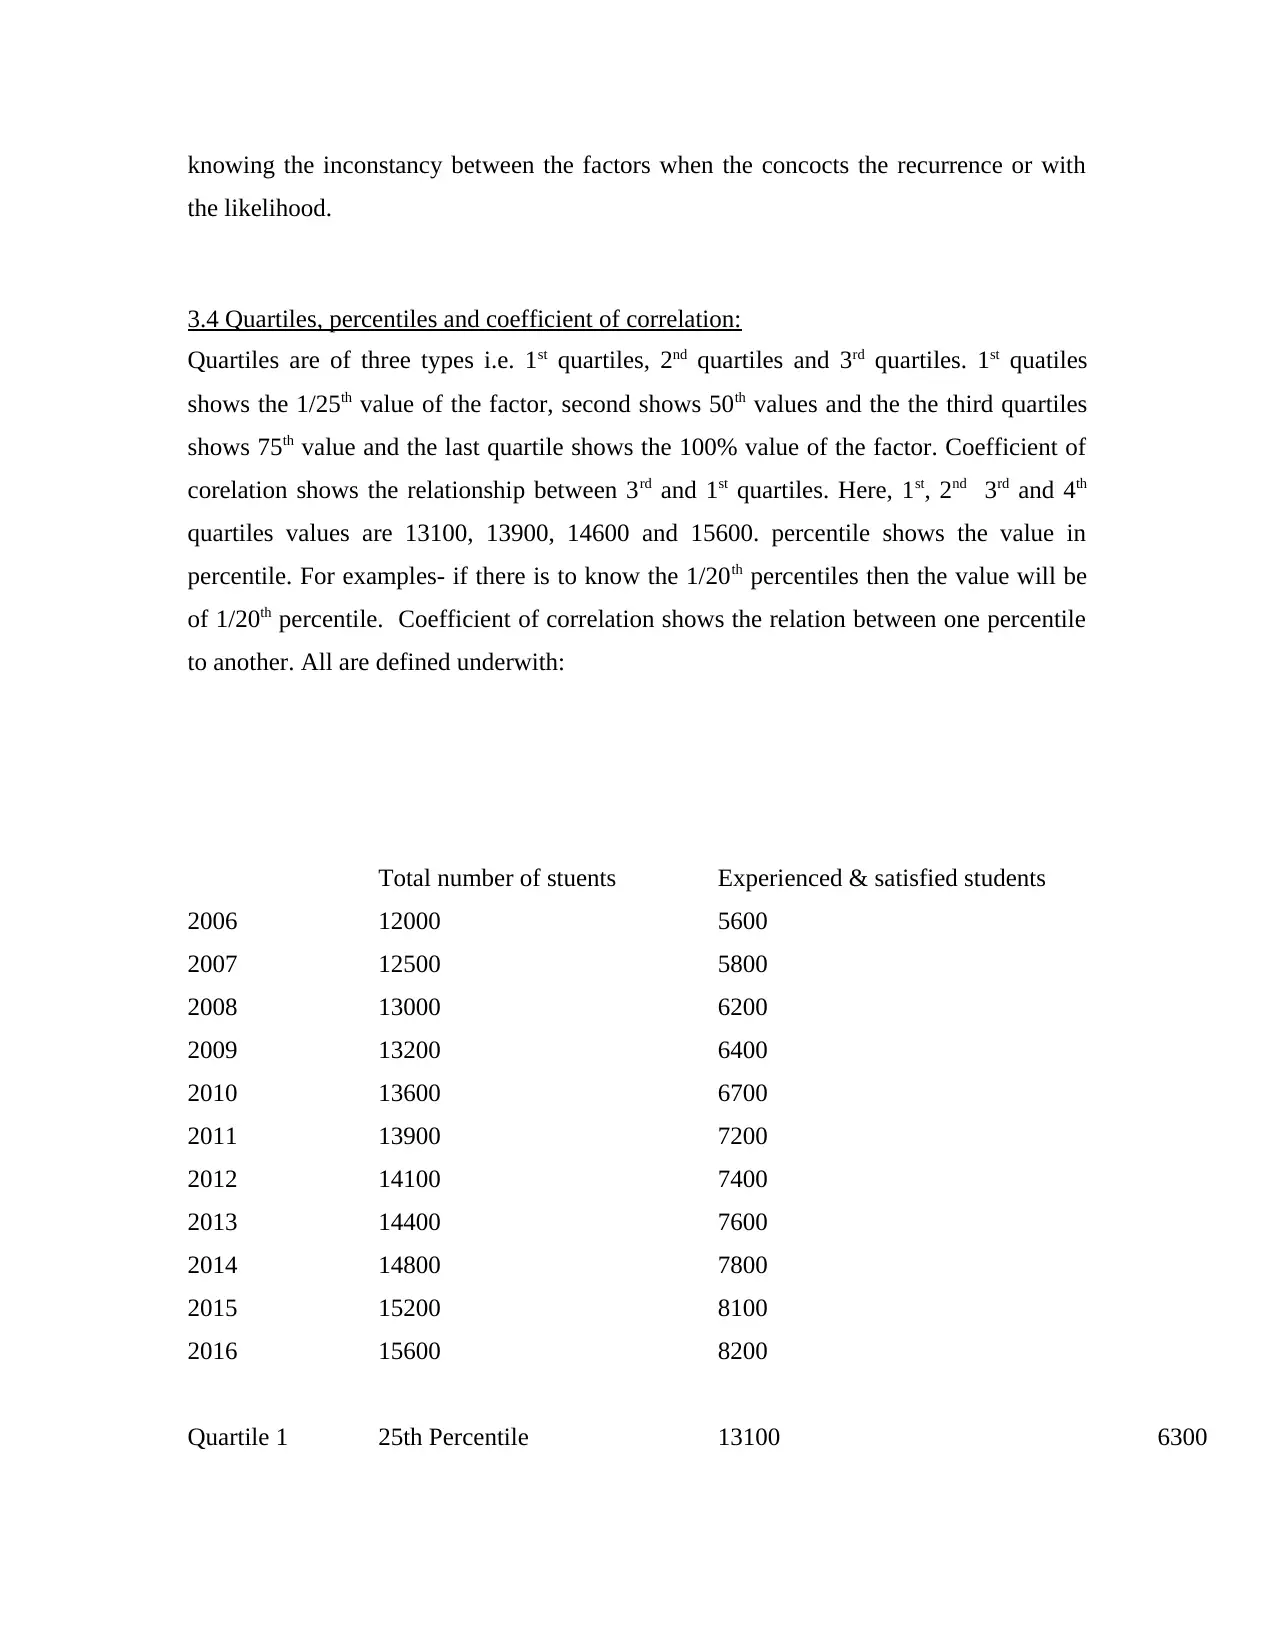
3.4 Quartiles, percentiles and coefficient of correlation:
Quartiles are of three types i.e. 1st quartiles, 2nd quartiles and 3rd quartiles. 1st quatiles
shows the 1/25th value of the factor, second shows 50th values and the the third quartiles
shows 75th value and the last quartile shows the 100% value of the factor. Coefficient of
corelation shows the relationship between 3rd and 1st quartiles. Here, 1st, 2nd 3rd and 4th
quartiles values are 13100, 13900, 14600 and 15600. percentile shows the value in
percentile. For examples- if there is to know the 1/20th percentiles then the value will be
of 1/20th percentile. Coefficient of correlation shows the relation between one percentile
to another. All are defined underwith:
Total number of stuents Experienced & satisfied students
2006 12000 5600
2007 12500 5800
2008 13000 6200
2009 13200 6400
2010 13600 6700
2011 13900 7200
2012 14100 7400
2013 14400 7600
2014 14800 7800
2015 15200 8100
2016 15600 8200
Quartile 1 25th Percentile 13100 6300
the likelihood.
3.4 Quartiles, percentiles and coefficient of correlation:
Quartiles are of three types i.e. 1st quartiles, 2nd quartiles and 3rd quartiles. 1st quatiles
shows the 1/25th value of the factor, second shows 50th values and the the third quartiles
shows 75th value and the last quartile shows the 100% value of the factor. Coefficient of
corelation shows the relationship between 3rd and 1st quartiles. Here, 1st, 2nd 3rd and 4th
quartiles values are 13100, 13900, 14600 and 15600. percentile shows the value in
percentile. For examples- if there is to know the 1/20th percentiles then the value will be
of 1/20th percentile. Coefficient of correlation shows the relation between one percentile
to another. All are defined underwith:
Total number of stuents Experienced & satisfied students
2006 12000 5600
2007 12500 5800
2008 13000 6200
2009 13200 6400
2010 13600 6700
2011 13900 7200
2012 14100 7400
2013 14400 7600
2014 14800 7800
2015 15200 8100
2016 15600 8200
Quartile 1 25th Percentile 13100 6300
Paraphrase This Document
Need a fresh take? Get an instant paraphrase of this document with our AI Paraphraser
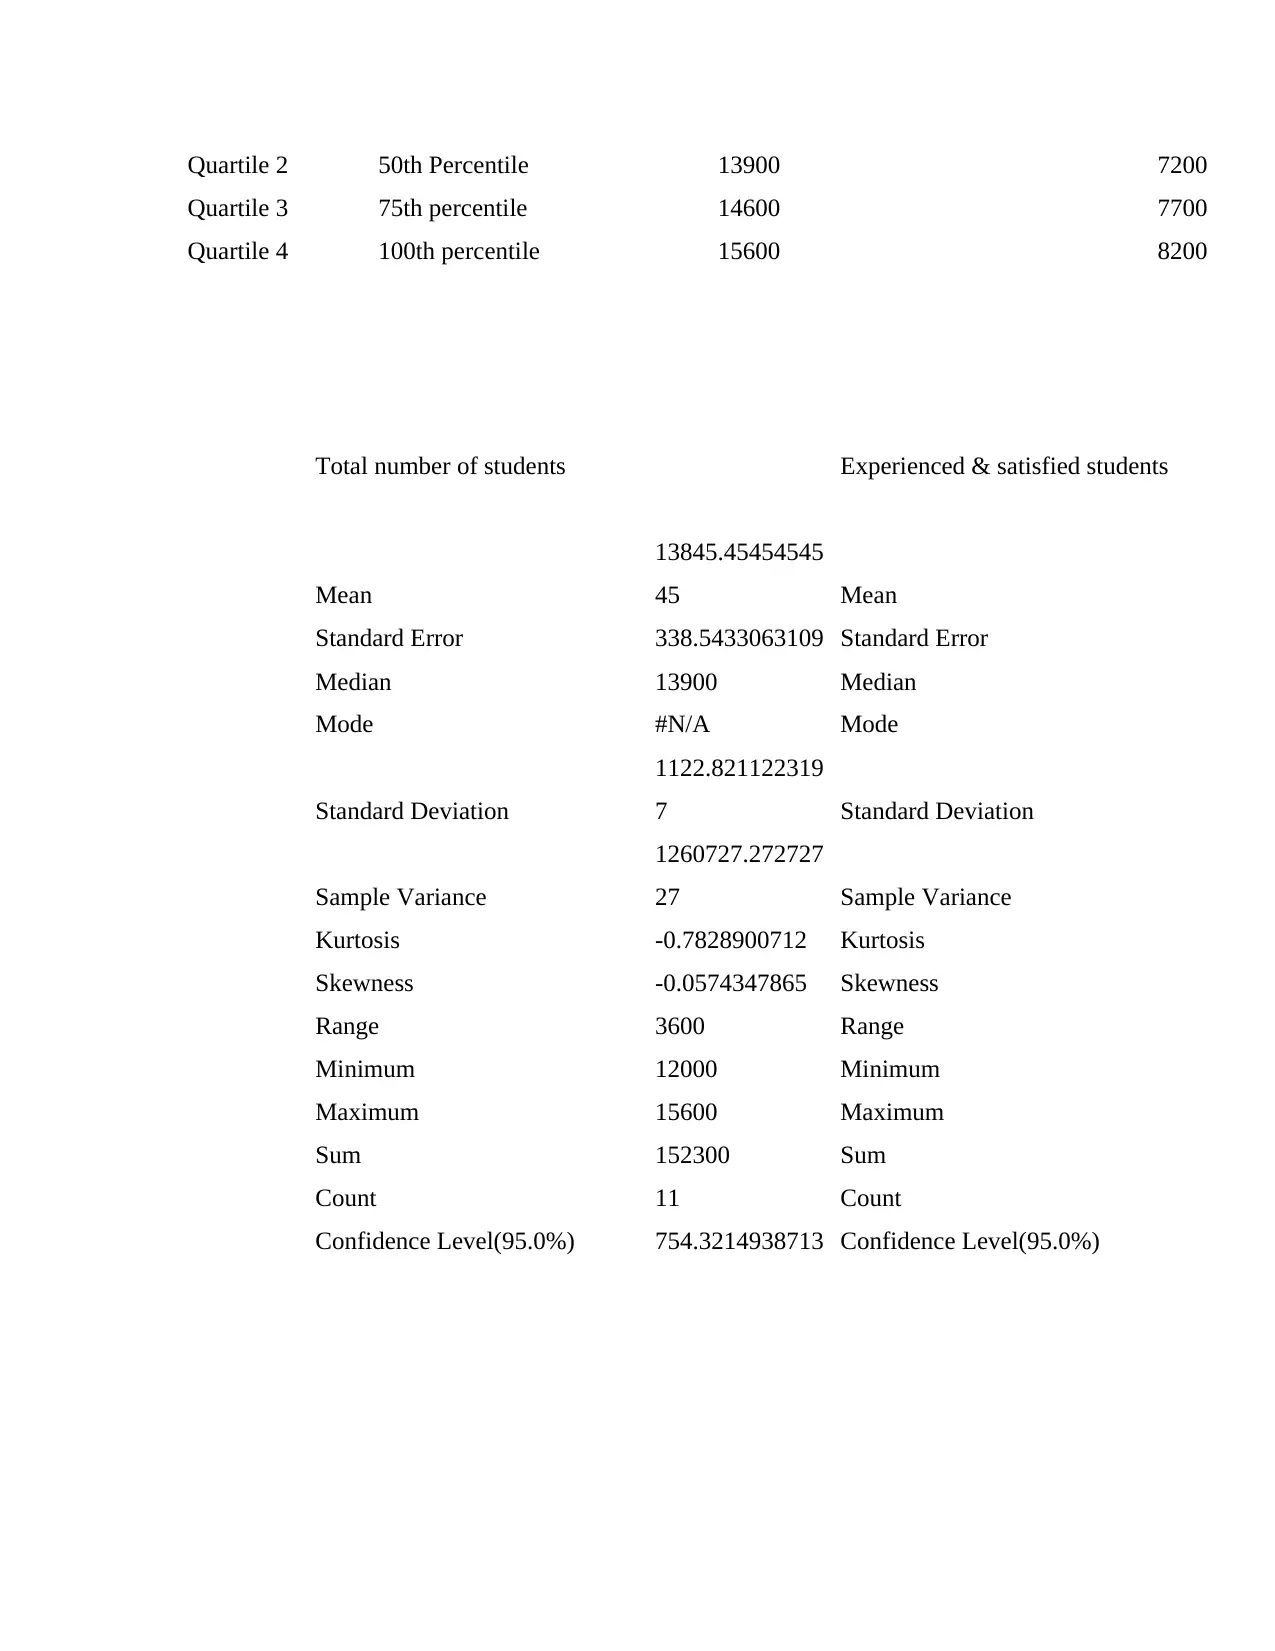
Quartile 2 50th Percentile 13900 7200
Quartile 3 75th percentile 14600 7700
Quartile 4 100th percentile 15600 8200
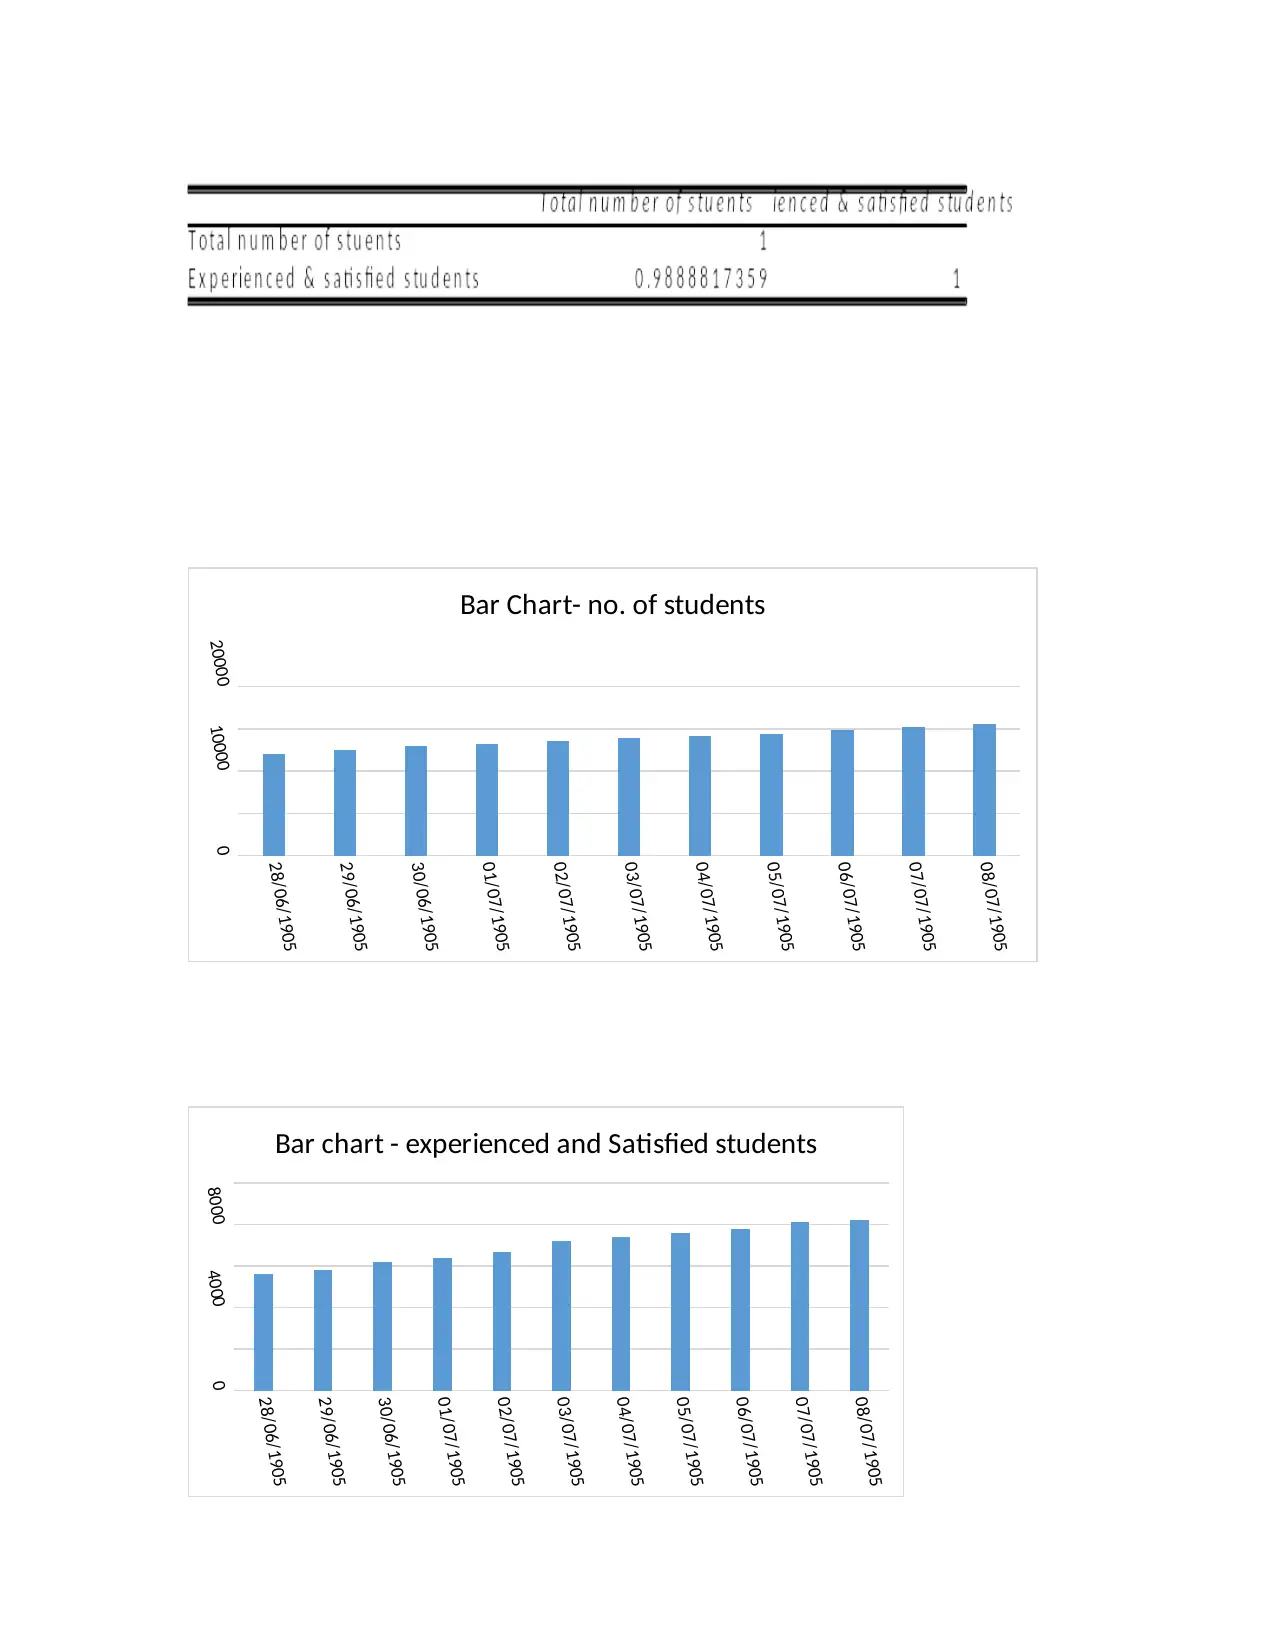
Total number of students Experienced & satisfied students
Mean
13845.45454545
45 Mean
Standard Error 338.5433063109 Standard Error
Median 13900 Median
Mode #N/A Mode
Standard Deviation
1122.821122319
7 Standard Deviation
Sample Variance
1260727.272727
27 Sample Variance
Kurtosis -0.7828900712 Kurtosis
Skewness -0.0574347865 Skewness
Range 3600 Range
Minimum 12000 Minimum
Maximum 15600 Maximum
Sum 152300 Sum
Count 11 Count
Confidence Level(95.0%) 754.3214938713 Confidence Level(95.0%)
Quartile 3 75th percentile 14600 7700
Quartile 4 100th percentile 15600 8200
Total number of students Experienced & satisfied students
Mean
13845.45454545
45 Mean
Standard Error 338.5433063109 Standard Error
Median 13900 Median
Mode #N/A Mode
Standard Deviation
1122.821122319
7 Standard Deviation
Sample Variance
1260727.272727
27 Sample Variance
Kurtosis -0.7828900712 Kurtosis
Skewness -0.0574347865 Skewness
Range 3600 Range
Minimum 12000 Minimum
Maximum 15600 Maximum
Sum 152300 Sum
Count 11 Count
Confidence Level(95.0%) 754.3214938713 Confidence Level(95.0%)
28/06/1905
29/06/1905
30/06/1905
01/07/1905
02/07/1905
03/07/1905
04/07/1905
05/07/1905
06/07/1905
07/07/1905
08/07/1905
0
10000
20000
Bar Chart- no. of students
28/06/1905
29/06/1905
30/06/1905
01/07/1905
02/07/1905
03/07/1905
04/07/1905
05/07/1905
06/07/1905
07/07/1905
08/07/1905
0
4000
8000
Bar chart - experienced and Satisfied students
29/06/1905
30/06/1905
01/07/1905
02/07/1905
03/07/1905
04/07/1905
05/07/1905
06/07/1905
07/07/1905
08/07/1905
0
10000
20000
Bar Chart- no. of students
28/06/1905
29/06/1905
30/06/1905
01/07/1905
02/07/1905
03/07/1905
04/07/1905
05/07/1905
06/07/1905
07/07/1905
08/07/1905
0
4000
8000
Bar chart - experienced and Satisfied students
⊘ This is a preview!⊘
Do you want full access?
Subscribe today to unlock all pages.
Trusted by 1+ million students worldwide
1 out of 29
Related Documents


Your All-in-One AI-Powered Toolkit for Academic Success.
+13062052269
info@desklib.com
Available 24*7 on WhatsApp / Email
![[object Object]](/_next/static/media/star-bottom.7253800d.svg)
Unlock your academic potential
Copyright © 2020–2026 A2Z Services. All Rights Reserved. Developed and managed by ZUCOL.