Business Decision Making Report - Balti Palace Franchise Analysis
VerifiedAdded on 2020/06/06
|19
|4644
|320
Report
AI Summary
This report focuses on the application of business decision-making principles to a real-world scenario involving Balti Palace's potential franchise expansion in the UK. The report begins by outlining a plan for collecting primary and secondary data, emphasizing the use of questionnaires to gather customer preferences and opinions. It then details the creation of the questionnaire and the subsequent analysis of the collected data, employing measures of central tendency (mean, median, mode) and dispersion (standard deviation, variances) to extract meaningful insights. Furthermore, the report explores the benefits of quartile, percentile, and correlation coefficients in a business context. The analysis extends to the preparation of charts and graphs for visual representation, the creation of trend lines for future forecasting, and the formation of a formal business report to present findings and recommendations. Finally, the report discusses the advantages of information processing tools, critical path management, and financial tools in supporting effective decision-making processes for the proposed franchise expansion.
Business Decision making
Paraphrase This Document
Need a fresh take? Get an instant paraphrase of this document with our AI Paraphraser
Table of Contents
INTRODUCTION...........................................................................................................................1
TASK 1............................................................................................................................................1
1.1 Use of plan in collecting data through primary and secondary format............................1
1.2 Use of sampling method and survey methodology..........................................................2
1.3 Use of questionnaire in relation to data............................................................................2
2.1 Creation of information on the basis of questionnaire.....................................................4
2.2 Use of mean, median and mode and its analysis..............................................................5
2.3 Analysis of data using measure of dispersion with including standard deviation............6
2.4 Benefits of quartile, percentile and correlation coefficient in business context...............7
TASK 2............................................................................................................................................8
3.1 Preparation of charts, graphs in making a valid conclusion.............................................8
3.2 Creation of trend lines in future forecasting...................................................................10
3.3 Business presentation.....................................................................................................12
3.4 Formation of formal business report to senior authority................................................12
TASK 3..........................................................................................................................................13
4.1 Information processing tools advantages to beneficial decision making.......................13
4.2 Formation of critical path management..........................................................................13
4.3 Benefits of financial tools in relation to make beneficial decision................................15
CONCLUSION..............................................................................................................................16
REFERENCES..............................................................................................................................18
INTRODUCTION
Taking an effective judgement for organisation is not much easier as this will provide
impact to entire business either in a direct or indirect manner (Bhattacharya and et. al., 2015).
Therefore, it is must for them to gather an appropriate data and information regarding each and
every thing. This project is based on Balti Palace whom wants to open up another franchise of
restaurant in UK. For this management need to evaluate each and every aspect properly and take
beneficial decision as well for taking helpful decisions. This report stated about collection of
primary and secondary data out of which questionnaire consider as suited method. By applying
relevant measure of central tendency and dispersion, gather information get evaluated properly.
Along with this, on the basis of data, whole outcome get presented on charts and graphs. Use of
information processing tool and project plan enable in make things systematic in nature.
TASK 1
1.1 Use of plan in collecting data through primary and secondary format
Manager need to prepare an adequate planning; therefore, workers will accomplish entire
task in a systematic manner. This will consist entire operational activities which is associated
with project; so that, efficient result will achieve (Franks and et. al., 2013). For above stated aim,
employer will conduct research also to fulfil needs and wants of customers as per their
requirements or demands. Balti palace is going to open another restaurant in London; therefore,
it is fundamental for them to know about preferences as well as tastes of clients because it aids
them into their growth and success. Additionally, they need to gather data in relation to location
that which will be the best place for them. Hence, they will utilize two methods and these are
mentioned as beneath: Primary data: This kind of information is associated with recent time period and much
accurate. With assistance of this, superior will gather point of opinion of numerous
persons through interaction. Major disadvantage of utilizing this, it consumes maximum
time and in addition takes lots of fund. If manager of Balti palace wants to gather
information and data with help of primary technique then, they need to follow plan
systematically which provide assistance to them for longer time duration. There are many
methods which will be consisting into this, for example: survey, questionnaire and so on
(Gaillard, 2014).
1
⊘ This is a preview!⊘
Do you want full access?
Subscribe today to unlock all pages.
Trusted by 1+ million students worldwide
Secondary data: Information which is collected by using this method is associated with
past data. There are many tools which will be include into this, such as internet,
newspaper, research paper, books, magazine, journals and many more. Along with this, it
is must for superior to examine past records to take an effective judgement for
organisation.
In this assignment, primary source is using by employer to gather adequate data and
information as it assists to know about current needs and wants of people. Therefore, by knowing
this, Balti palace will fulfil their prerequisites and compete their competitors at competitive
world (Hartman and et. al., 2014.
1.2 Use of sampling method and survey methodology
For each and every kind of research, individual needs to select some number of people
which is known as sample. Thus, it can be done in an adequate way. Sampling technique is much
easier which will be utilized by researcher as in this, they need to select some persons or
respondents. There are various kinds of sample methods which are stated as below:
Stratified sampling
Random sampling
Cluster sampling
With assistance of Survey method each and every thing will gather in an appropriate way. For
this research, researcher is utilized random sampling and in which they conducted survey on 80
respondents (Kahraman and et. al., 2015). Therefore, to prepare a format for this, there are some
tools which will be used by manager of Balti palace, are mentioned as beneath:
Questionnaire
Survey monkey
Social media
Hence, superior is going to utilize questionnaire method as with assistance of this, decision will
be taken in an effective way. Along with this, it aids to acquire opinion of distinguish individuals
in proper manner.
1.3 Use of questionnaire in relation to data
With assistance of an appropriate questionnaire it is easy to collect data and information
from many individual at a single period of time. There is various type of it, such as close ended,
grouped, open ended, un – grouped and so on. Therefore, any type of method will be used by
2
Paraphrase This Document
Need a fresh take? Get an instant paraphrase of this document with our AI Paraphraser
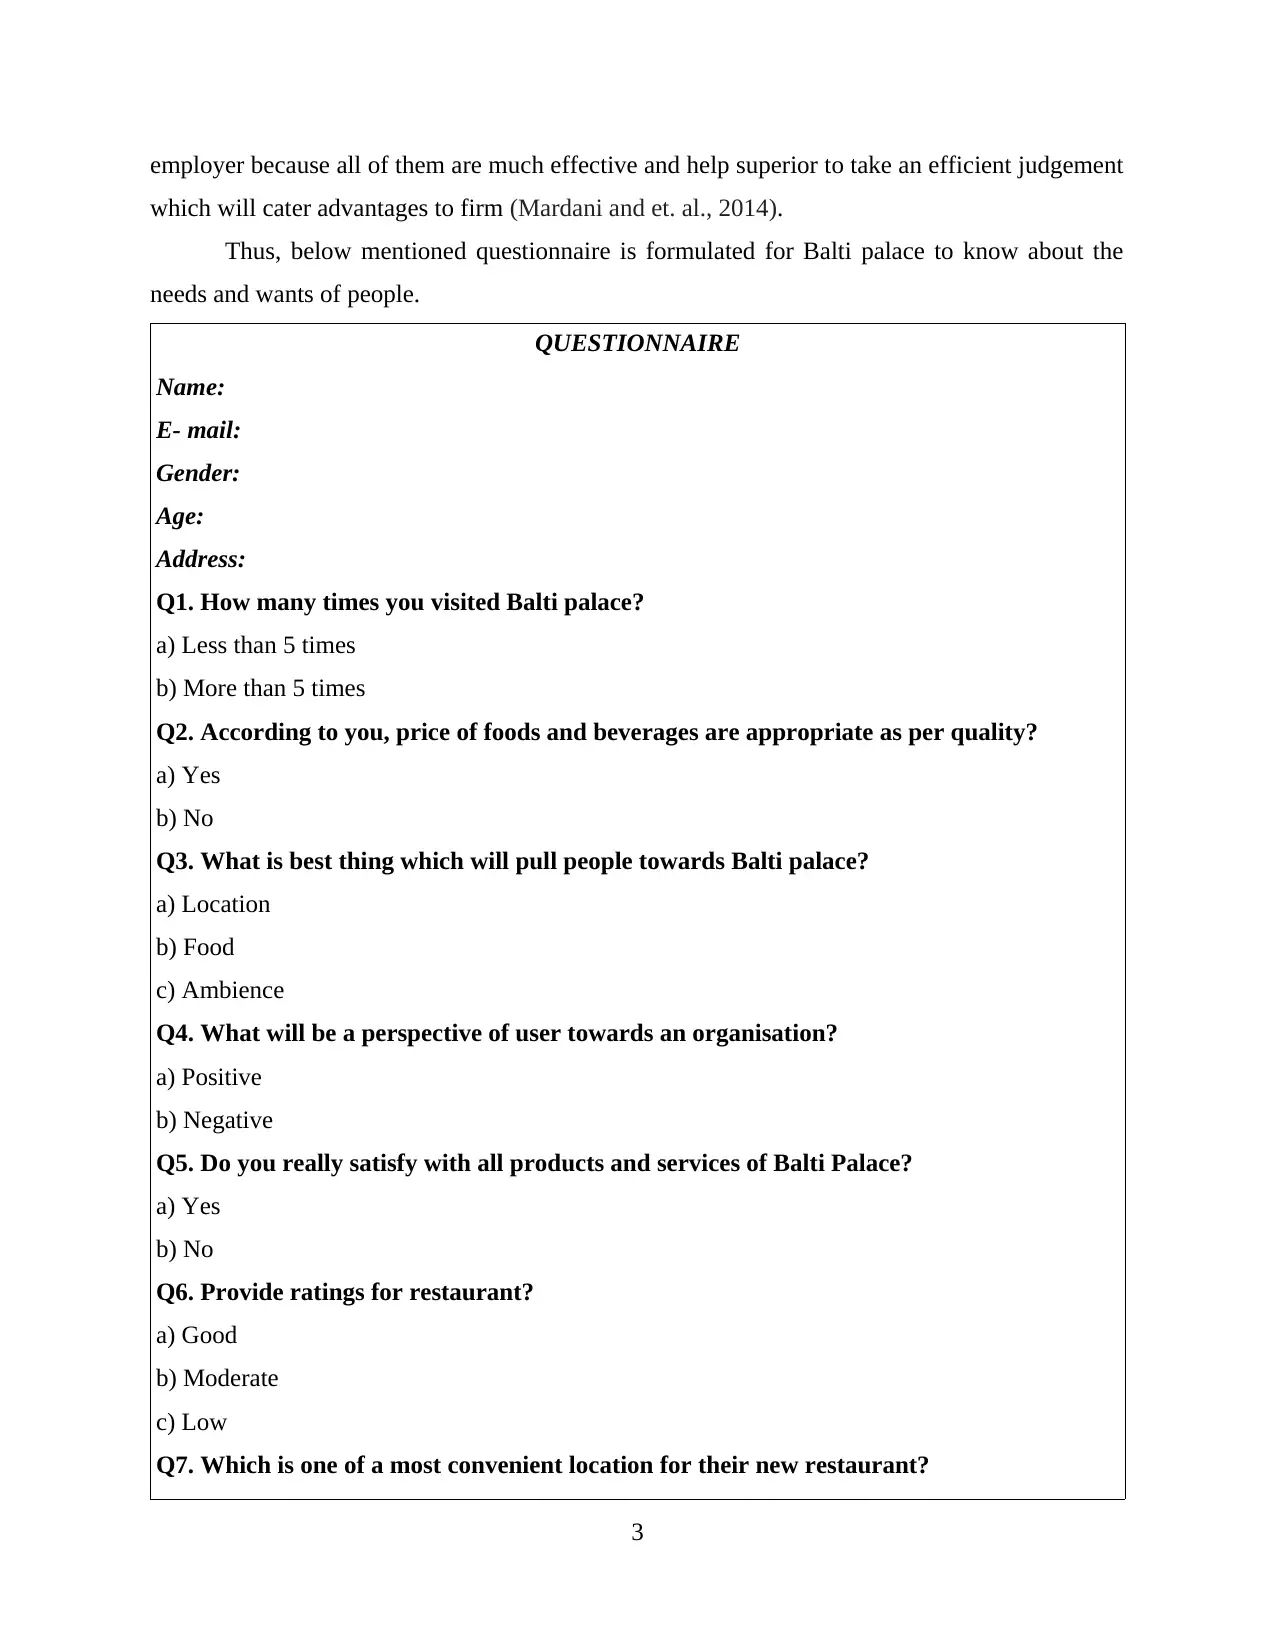
employer because all of them are much effective and help superior to take an efficient judgement
which will cater advantages to firm (Mardani and et. al., 2014).
Thus, below mentioned questionnaire is formulated for Balti palace to know about the
needs and wants of people.
QUESTIONNAIRE
Name:
E- mail:
Gender:
Age:
Address:
Q1. How many times you visited Balti palace?
a) Less than 5 times
b) More than 5 times
Q2. According to you, price of foods and beverages are appropriate as per quality?
a) Yes
b) No
Q3. What is best thing which will pull people towards Balti palace?
a) Location
b) Food
c) Ambience
Q4. What will be a perspective of user towards an organisation?
a) Positive
b) Negative
Q5. Do you really satisfy with all products and services of Balti Palace?
a) Yes
b) No
Q6. Provide ratings for restaurant?
a) Good
b) Moderate
c) Low
Q7. Which is one of a most convenient location for their new restaurant?
3
a) Seaside
b) Rooftop
Q8. Are all offers and discount make values for their customers?
a) Agree
b) Disagree
Q9. Are the opening and closing hours of restaurant need to get expanding?
a) Yes
b) No
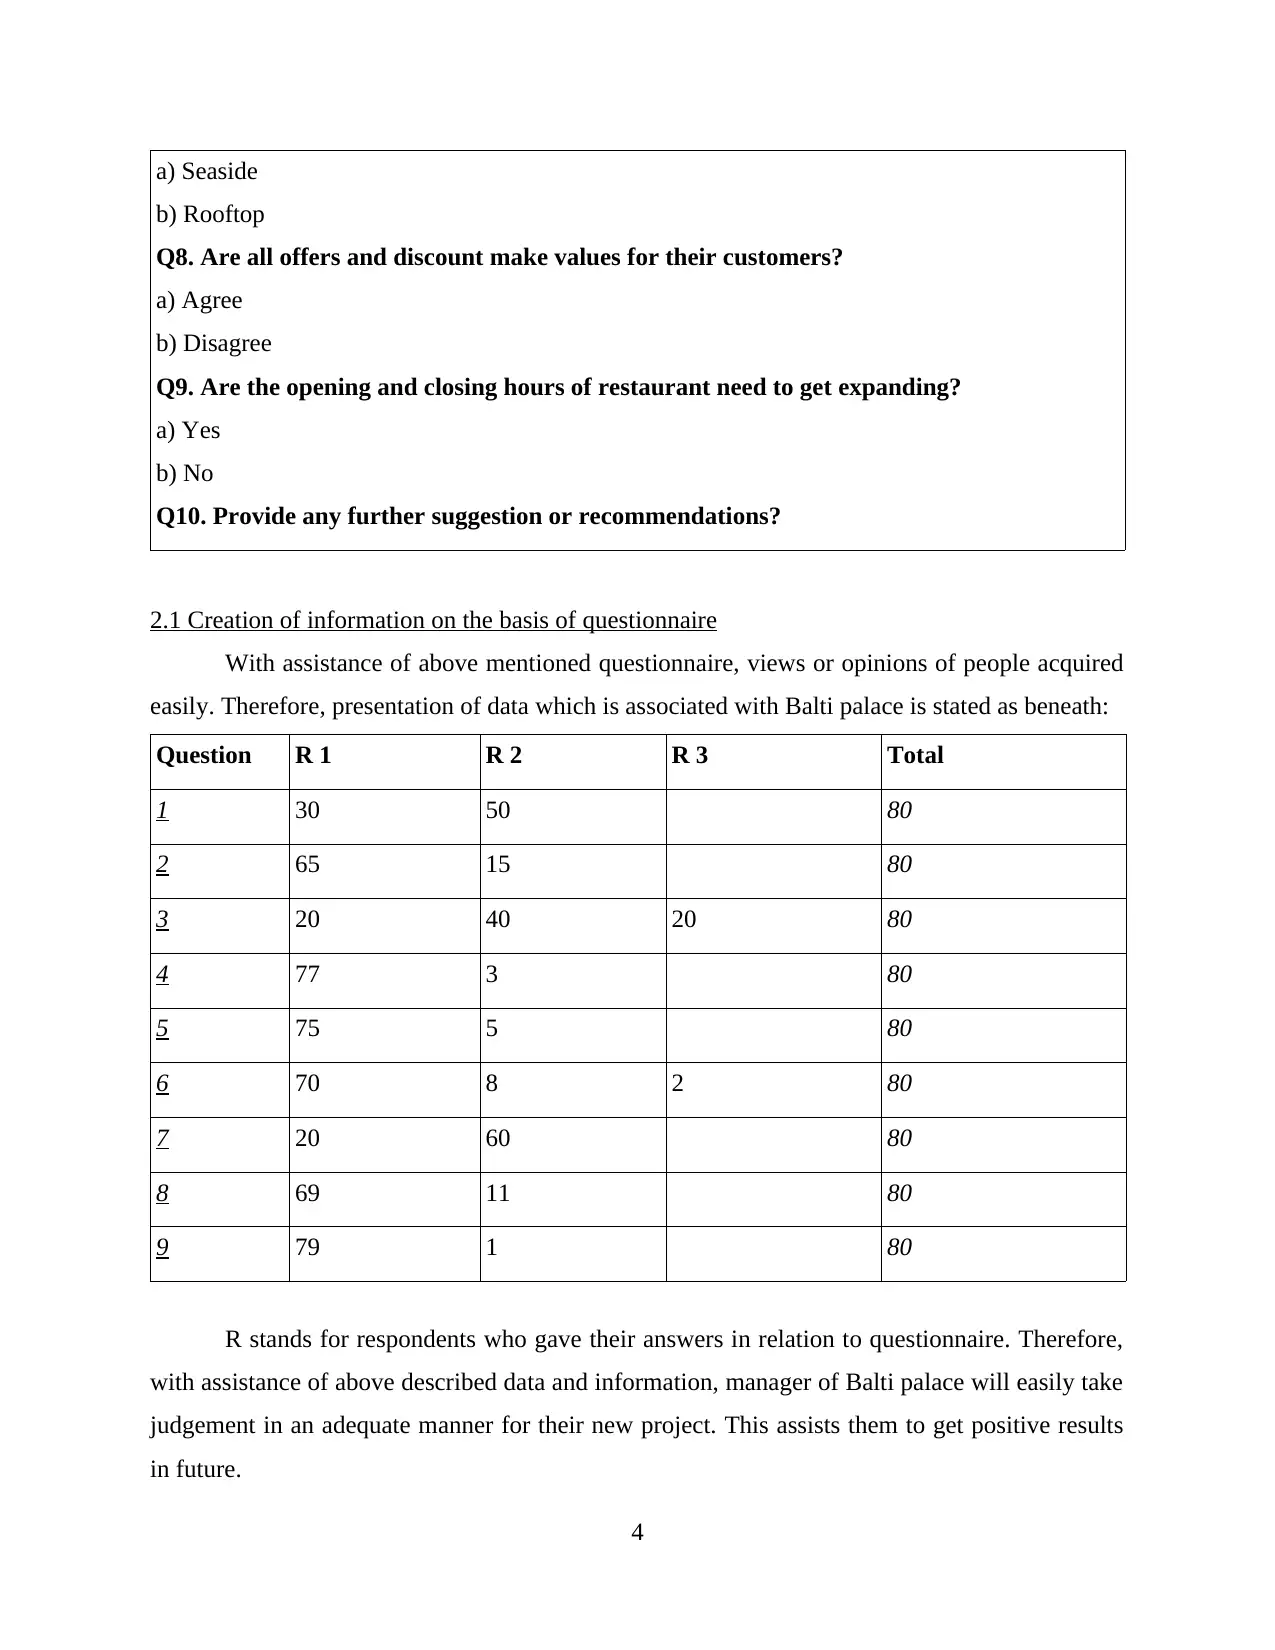
Q10. Provide any further suggestion or recommendations?
2.1 Creation of information on the basis of questionnaire
With assistance of above mentioned questionnaire, views or opinions of people acquired
easily. Therefore, presentation of data which is associated with Balti palace is stated as beneath:
Question R 1 R 2 R 3 Total
1 30 50 80
2 65 15 80
3 20 40 20 80
4 77 3 80
5 75 5 80
6 70 8 2 80
7 20 60 80
8 69 11 80
9 79 1 80
R stands for respondents who gave their answers in relation to questionnaire. Therefore,
with assistance of above described data and information, manager of Balti palace will easily take
judgement in an adequate manner for their new project. This assists them to get positive results
in future.
4
b) Rooftop
Q8. Are all offers and discount make values for their customers?
a) Agree
b) Disagree
Q9. Are the opening and closing hours of restaurant need to get expanding?
a) Yes
b) No
Q10. Provide any further suggestion or recommendations?
2.1 Creation of information on the basis of questionnaire
With assistance of above mentioned questionnaire, views or opinions of people acquired
easily. Therefore, presentation of data which is associated with Balti palace is stated as beneath:
Question R 1 R 2 R 3 Total
1 30 50 80
2 65 15 80
3 20 40 20 80
4 77 3 80
5 75 5 80
6 70 8 2 80
7 20 60 80
8 69 11 80
9 79 1 80
R stands for respondents who gave their answers in relation to questionnaire. Therefore,
with assistance of above described data and information, manager of Balti palace will easily take
judgement in an adequate manner for their new project. This assists them to get positive results
in future.
4
⊘ This is a preview!⊘
Do you want full access?
Subscribe today to unlock all pages.
Trusted by 1+ million students worldwide
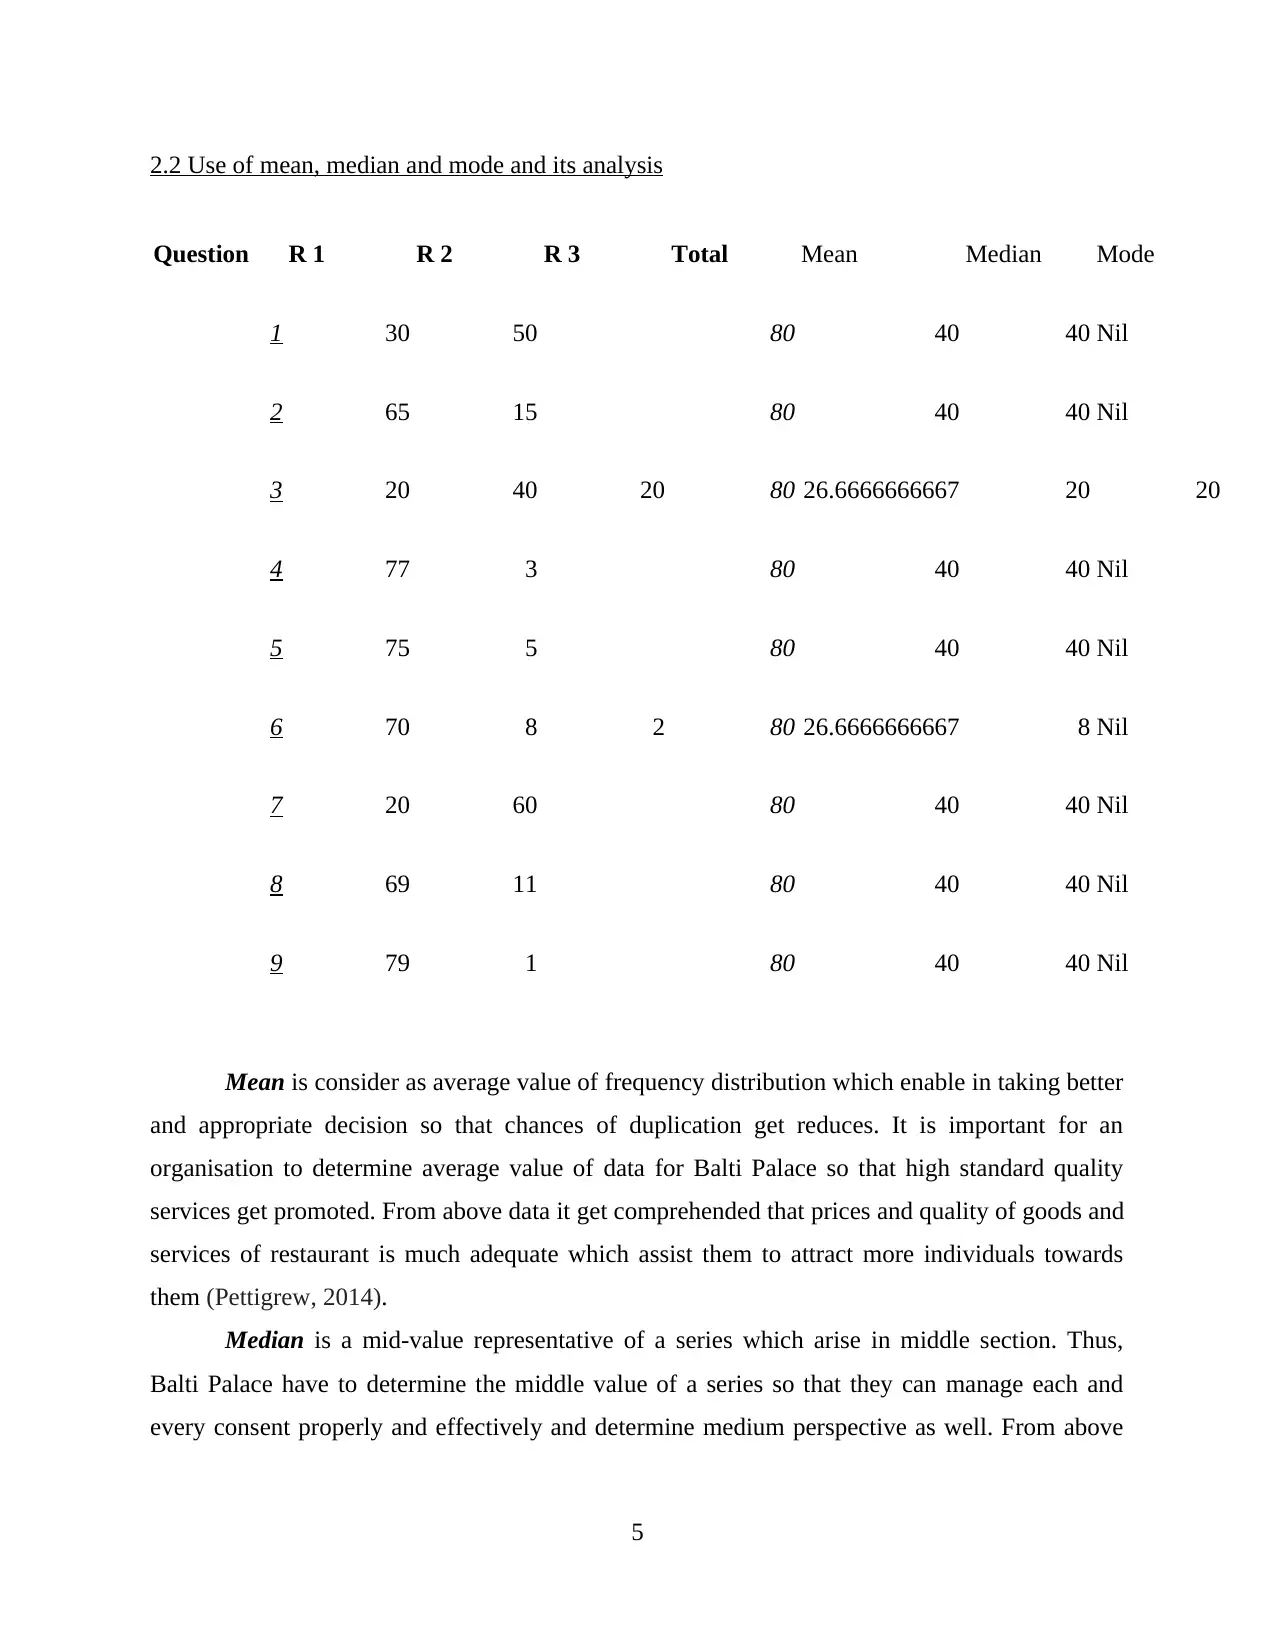
2.2 Use of mean, median and mode and its analysis
Question R 1 R 2 R 3 Total Mean Median Mode
1 30 50 80 40 40 Nil
2 65 15 80 40 40 Nil
3 20 40 20 80 26.6666666667 20 20
4 77 3 80 40 40 Nil
5 75 5 80 40 40 Nil
6 70 8 2 80 26.6666666667 8 Nil
7 20 60 80 40 40 Nil
8 69 11 80 40 40 Nil
9 79 1 80 40 40 Nil
Mean is consider as average value of frequency distribution which enable in taking better
and appropriate decision so that chances of duplication get reduces. It is important for an
organisation to determine average value of data for Balti Palace so that high standard quality
services get promoted. From above data it get comprehended that prices and quality of goods and
services of restaurant is much adequate which assist them to attract more individuals towards
them (Pettigrew, 2014).
Median is a mid-value representative of a series which arise in middle section. Thus,
Balti Palace have to determine the middle value of a series so that they can manage each and
every consent properly and effectively and determine medium perspective as well. From above
5
Paraphrase This Document
Need a fresh take? Get an instant paraphrase of this document with our AI Paraphraser
data, it has been comprehended that manager of Balti palace need to expand their hours as this
will help them to improve their customer base.
Mode is considered as most occur and influence value of a series which support in
evaluating determinants properly. If a number of arise in a series again and again then it consider
as mode value of a data. Location and ambience are two major things which attract and gain
representative consideration properly. Thus, it is essential to understand this aspect properly and
effectively.
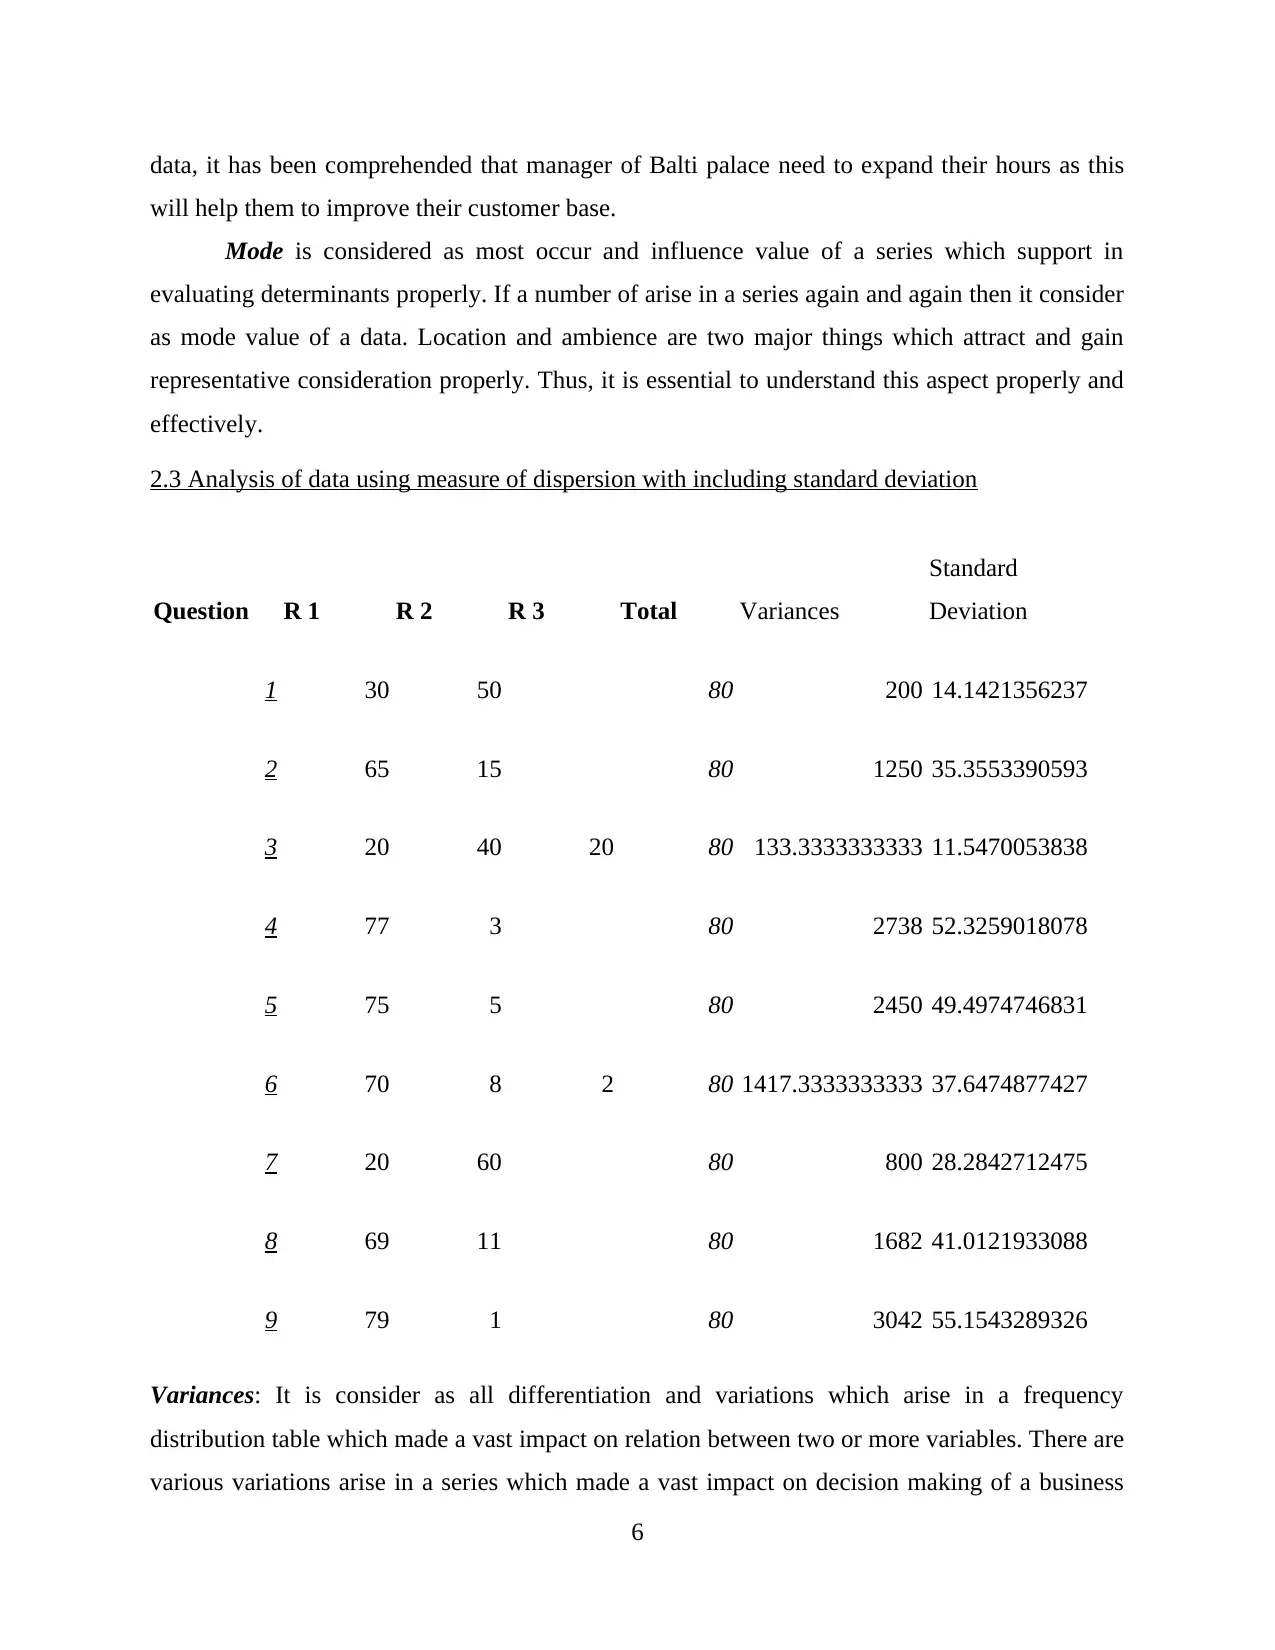
2.3 Analysis of data using measure of dispersion with including standard deviation
Question R 1 R 2 R 3 Total Variances
Standard
Deviation
1 30 50 80 200 14.1421356237
2 65 15 80 1250 35.3553390593
3 20 40 20 80 133.3333333333 11.5470053838
4 77 3 80 2738 52.3259018078
5 75 5 80 2450 49.4974746831
6 70 8 2 80 1417.3333333333 37.6474877427
7 20 60 80 800 28.2842712475
8 69 11 80 1682 41.0121933088
9 79 1 80 3042 55.1543289326
Variances: It is consider as all differentiation and variations which arise in a frequency
distribution table which made a vast impact on relation between two or more variables. There are
various variations arise in a series which made a vast impact on decision making of a business
6
will help them to improve their customer base.
Mode is considered as most occur and influence value of a series which support in
evaluating determinants properly. If a number of arise in a series again and again then it consider
as mode value of a data. Location and ambience are two major things which attract and gain
representative consideration properly. Thus, it is essential to understand this aspect properly and
effectively.
2.3 Analysis of data using measure of dispersion with including standard deviation
Question R 1 R 2 R 3 Total Variances
Standard
Deviation
1 30 50 80 200 14.1421356237
2 65 15 80 1250 35.3553390593
3 20 40 20 80 133.3333333333 11.5470053838
4 77 3 80 2738 52.3259018078
5 75 5 80 2450 49.4974746831
6 70 8 2 80 1417.3333333333 37.6474877427
7 20 60 80 800 28.2842712475
8 69 11 80 1682 41.0121933088
9 79 1 80 3042 55.1543289326
Variances: It is consider as all differentiation and variations which arise in a frequency
distribution table which made a vast impact on relation between two or more variables. There are
various variations arise in a series which made a vast impact on decision making of a business
6
and consider as not appropriate in nature. From above data it has been understood that there are
many individuals whose perspective is much positive towards organisation.
Standard Deviation: It signifies about how spread the data is or defines for a distance between
mean values. It is calculated as square root of variances by determining the variation between
each data point to mean. From above data it has been concluded that superior of firm is providing
many kinds of offers to customers which are useful for them.
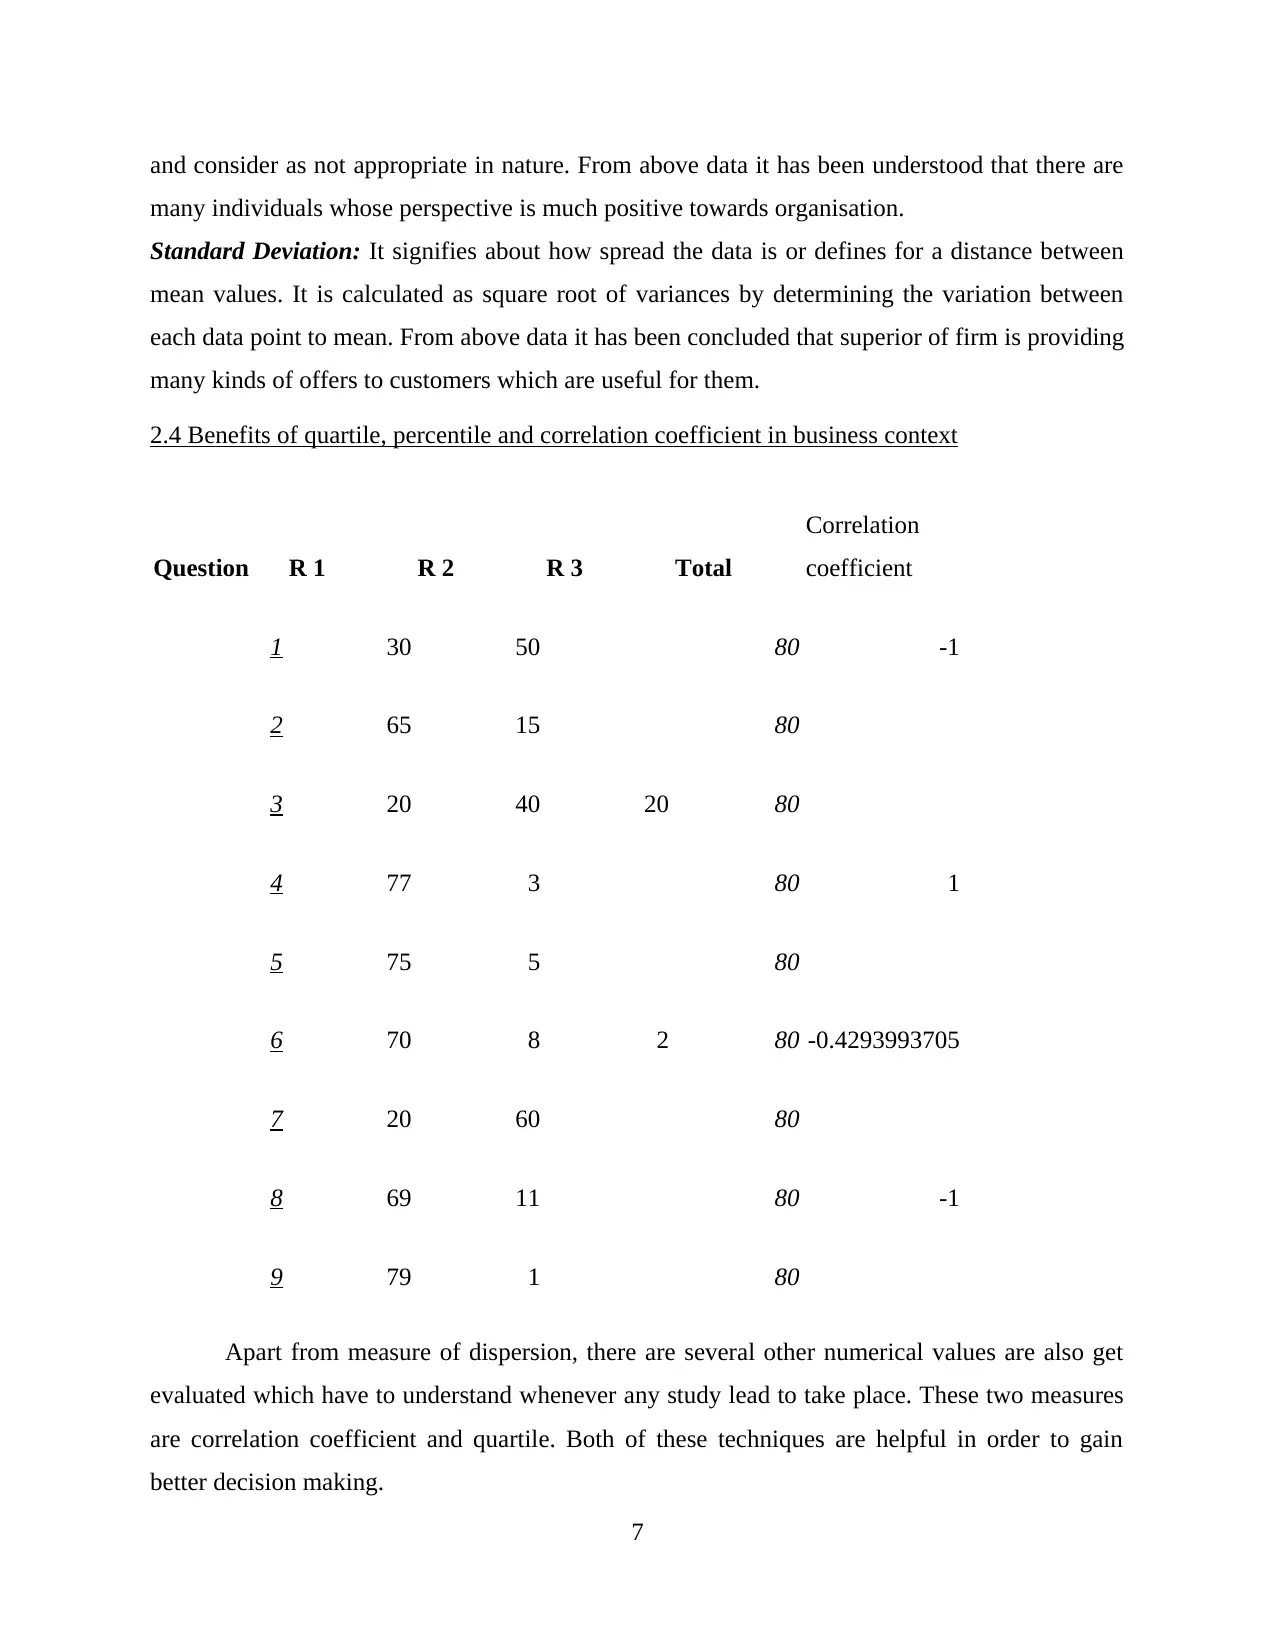
2.4 Benefits of quartile, percentile and correlation coefficient in business context
Question R 1 R 2 R 3 Total
Correlation
coefficient
1 30 50 80 -1
2 65 15 80
3 20 40 20 80
4 77 3 80 1
5 75 5 80
6 70 8 2 80 -0.4293993705
7 20 60 80
8 69 11 80 -1
9 79 1 80
Apart from measure of dispersion, there are several other numerical values are also get
evaluated which have to understand whenever any study lead to take place. These two measures
are correlation coefficient and quartile. Both of these techniques are helpful in order to gain
better decision making.
7
many individuals whose perspective is much positive towards organisation.
Standard Deviation: It signifies about how spread the data is or defines for a distance between
mean values. It is calculated as square root of variances by determining the variation between
each data point to mean. From above data it has been concluded that superior of firm is providing
many kinds of offers to customers which are useful for them.
2.4 Benefits of quartile, percentile and correlation coefficient in business context
Question R 1 R 2 R 3 Total
Correlation
coefficient
1 30 50 80 -1
2 65 15 80
3 20 40 20 80
4 77 3 80 1
5 75 5 80
6 70 8 2 80 -0.4293993705
7 20 60 80
8 69 11 80 -1
9 79 1 80
Apart from measure of dispersion, there are several other numerical values are also get
evaluated which have to understand whenever any study lead to take place. These two measures
are correlation coefficient and quartile. Both of these techniques are helpful in order to gain
better decision making.
7
⊘ This is a preview!⊘
Do you want full access?
Subscribe today to unlock all pages.
Trusted by 1+ million students worldwide
Correlation coefficient of series needs to describe relationship between two or more
variables so that better and appropriate work get promote. It is clear that the range should have
between -1 and 1. More than and less than values harms and impact the frequency distribution
series. Number of visit and price of Blati Palace stated negative relationship between each other
which support in making things correct and appropriate.
Quartile is helpful in divide the population proportionate into quartiles so that better and
appropriate work get encourage. Thus, quartile is helpful in dividing the sections into some
measurable components for better and appropriate understanding (Rosemann and vom Brocke,
2015).
TASK 2
3.1 Preparation of charts, graphs in making a valid conclusion
0.8 1 1.2 1.4 1.6 1.8 2 2.2
0
0.5
1
1.5
2
2.5
0
0.5
1
1.5
2
2.5
30
50
Column B
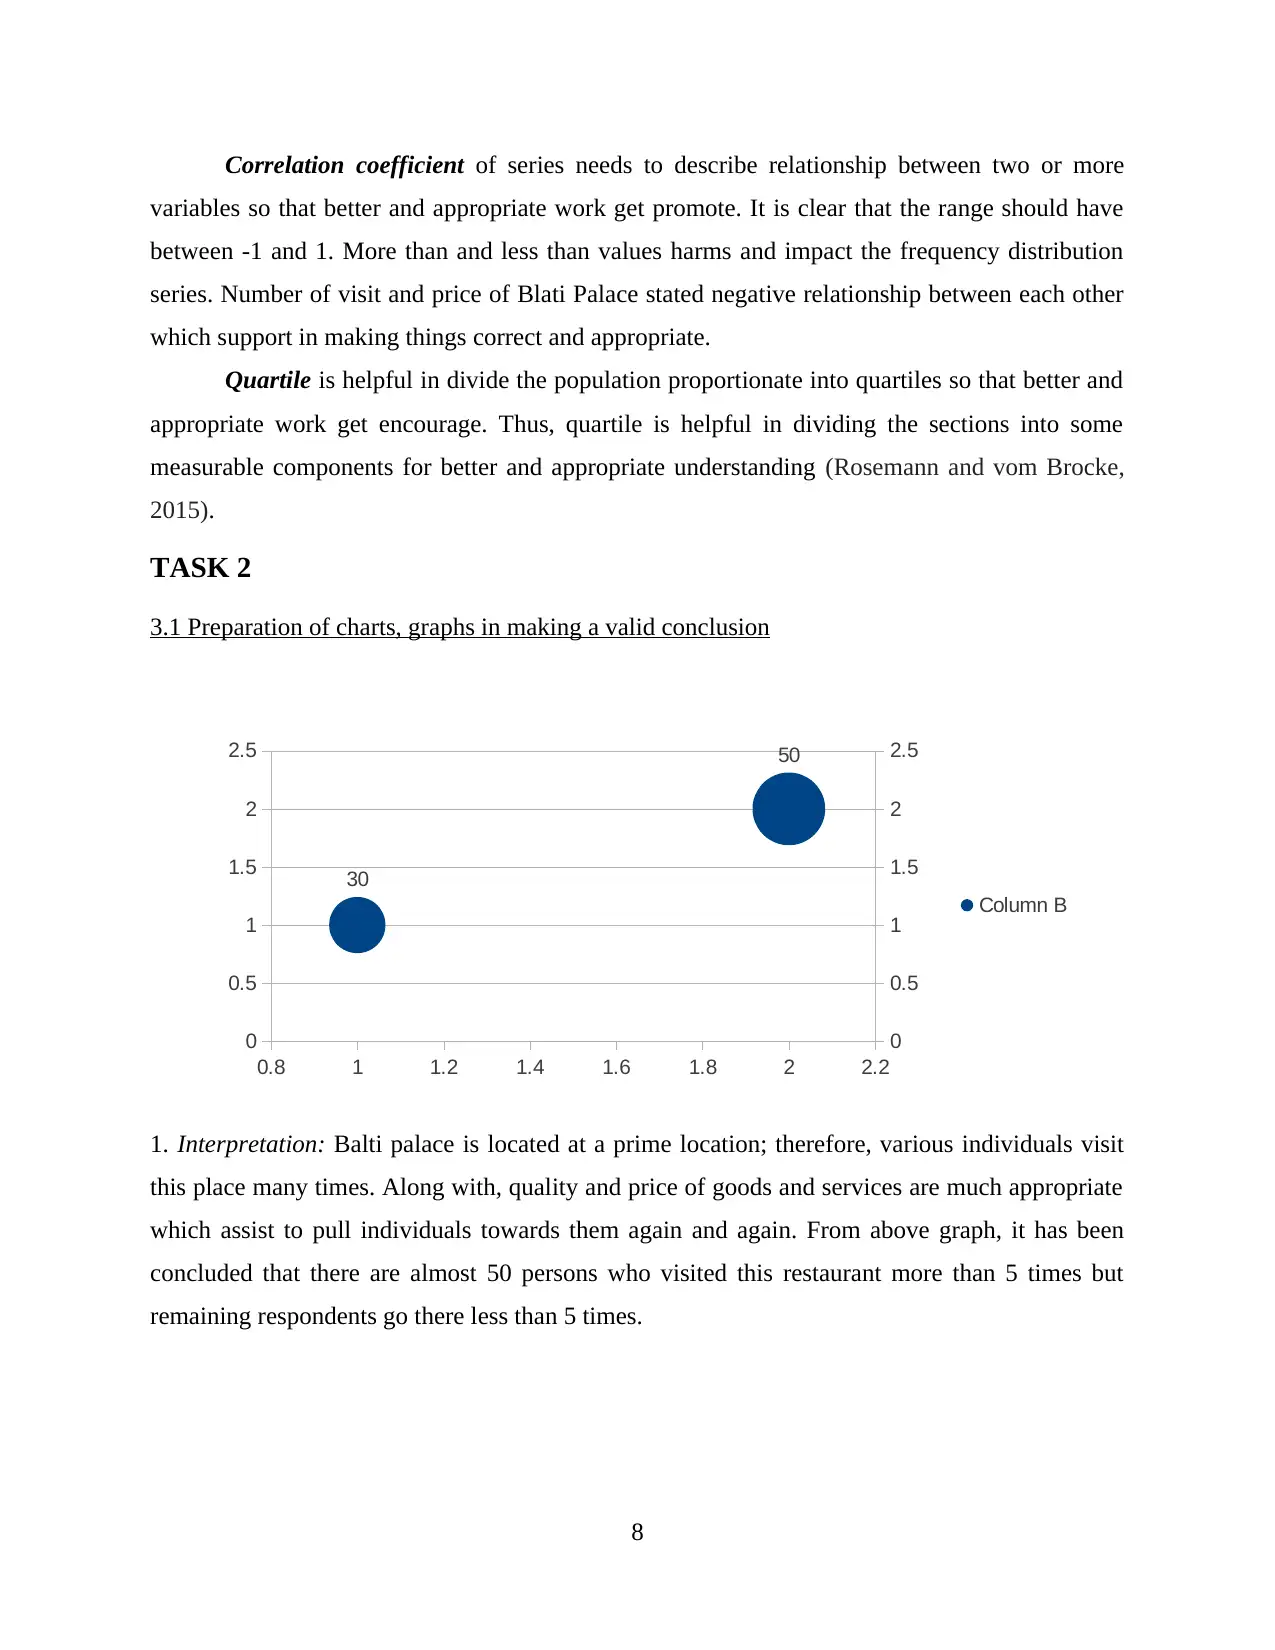
1. Interpretation: Balti palace is located at a prime location; therefore, various individuals visit
this place many times. Along with, quality and price of goods and services are much appropriate
which assist to pull individuals towards them again and again. From above graph, it has been
concluded that there are almost 50 persons who visited this restaurant more than 5 times but
remaining respondents go there less than 5 times.
8
variables so that better and appropriate work get promote. It is clear that the range should have
between -1 and 1. More than and less than values harms and impact the frequency distribution
series. Number of visit and price of Blati Palace stated negative relationship between each other
which support in making things correct and appropriate.
Quartile is helpful in divide the population proportionate into quartiles so that better and
appropriate work get encourage. Thus, quartile is helpful in dividing the sections into some
measurable components for better and appropriate understanding (Rosemann and vom Brocke,
2015).
TASK 2
3.1 Preparation of charts, graphs in making a valid conclusion
0.8 1 1.2 1.4 1.6 1.8 2 2.2
0
0.5
1
1.5
2
2.5
0
0.5
1
1.5
2
2.5
30
50
Column B
1. Interpretation: Balti palace is located at a prime location; therefore, various individuals visit
this place many times. Along with, quality and price of goods and services are much appropriate
which assist to pull individuals towards them again and again. From above graph, it has been
concluded that there are almost 50 persons who visited this restaurant more than 5 times but
remaining respondents go there less than 5 times.
8
Paraphrase This Document
Need a fresh take? Get an instant paraphrase of this document with our AI Paraphraser
0.8 1 1.2 1.4 1.6 1.8 2 2.2
0
0.5
1
1.5
2
2.5
65
15
Column B
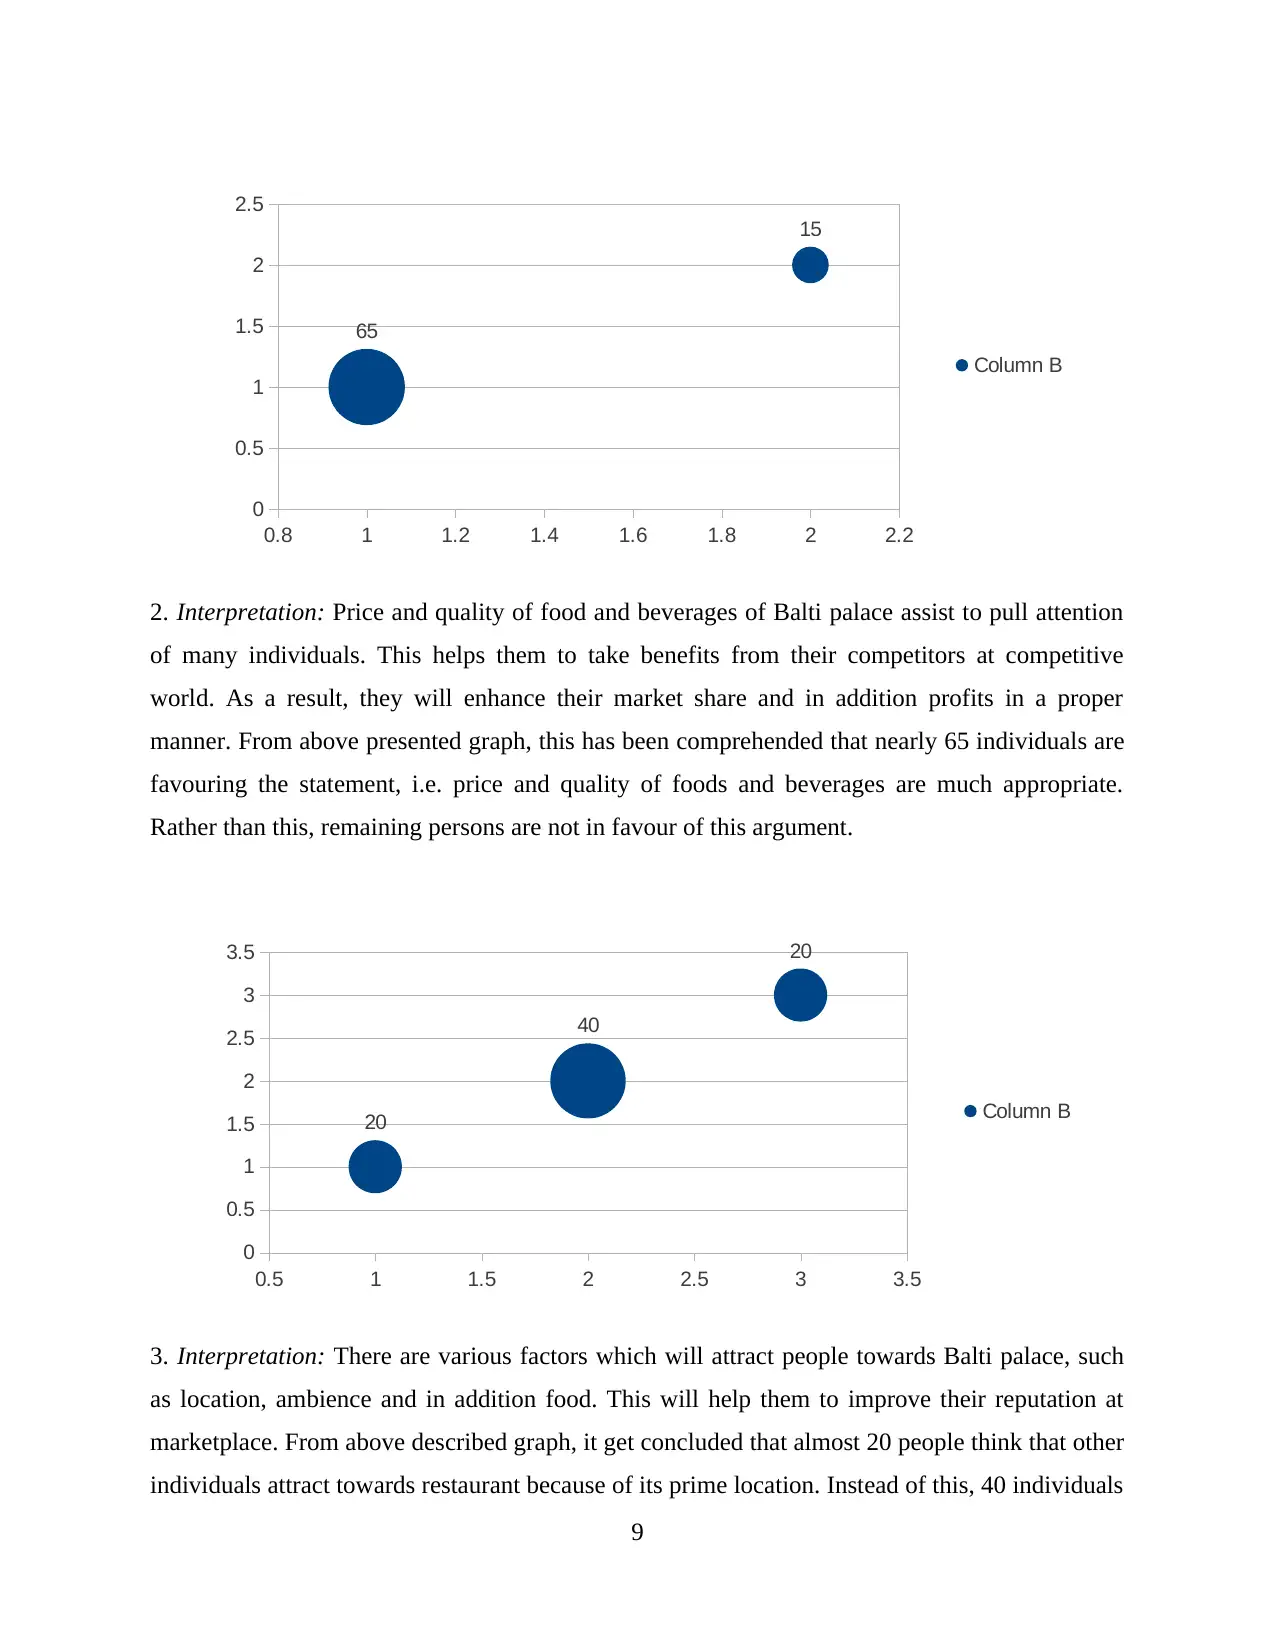
2. Interpretation: Price and quality of food and beverages of Balti palace assist to pull attention
of many individuals. This helps them to take benefits from their competitors at competitive
world. As a result, they will enhance their market share and in addition profits in a proper
manner. From above presented graph, this has been comprehended that nearly 65 individuals are
favouring the statement, i.e. price and quality of foods and beverages are much appropriate.
Rather than this, remaining persons are not in favour of this argument.
0.5 1 1.5 2 2.5 3 3.5
0
0.5
1
1.5
2
2.5
3
3.5
20
40
20
Column B
3. Interpretation: There are various factors which will attract people towards Balti palace, such
as location, ambience and in addition food. This will help them to improve their reputation at
marketplace. From above described graph, it get concluded that almost 20 people think that other
individuals attract towards restaurant because of its prime location. Instead of this, 40 individuals
9
0
0.5
1
1.5
2
2.5
65
15
Column B
2. Interpretation: Price and quality of food and beverages of Balti palace assist to pull attention
of many individuals. This helps them to take benefits from their competitors at competitive
world. As a result, they will enhance their market share and in addition profits in a proper
manner. From above presented graph, this has been comprehended that nearly 65 individuals are
favouring the statement, i.e. price and quality of foods and beverages are much appropriate.
Rather than this, remaining persons are not in favour of this argument.
0.5 1 1.5 2 2.5 3 3.5
0
0.5
1
1.5
2
2.5
3
3.5
20
40
20
Column B
3. Interpretation: There are various factors which will attract people towards Balti palace, such
as location, ambience and in addition food. This will help them to improve their reputation at
marketplace. From above described graph, it get concluded that almost 20 people think that other
individuals attract towards restaurant because of its prime location. Instead of this, 40 individuals
9
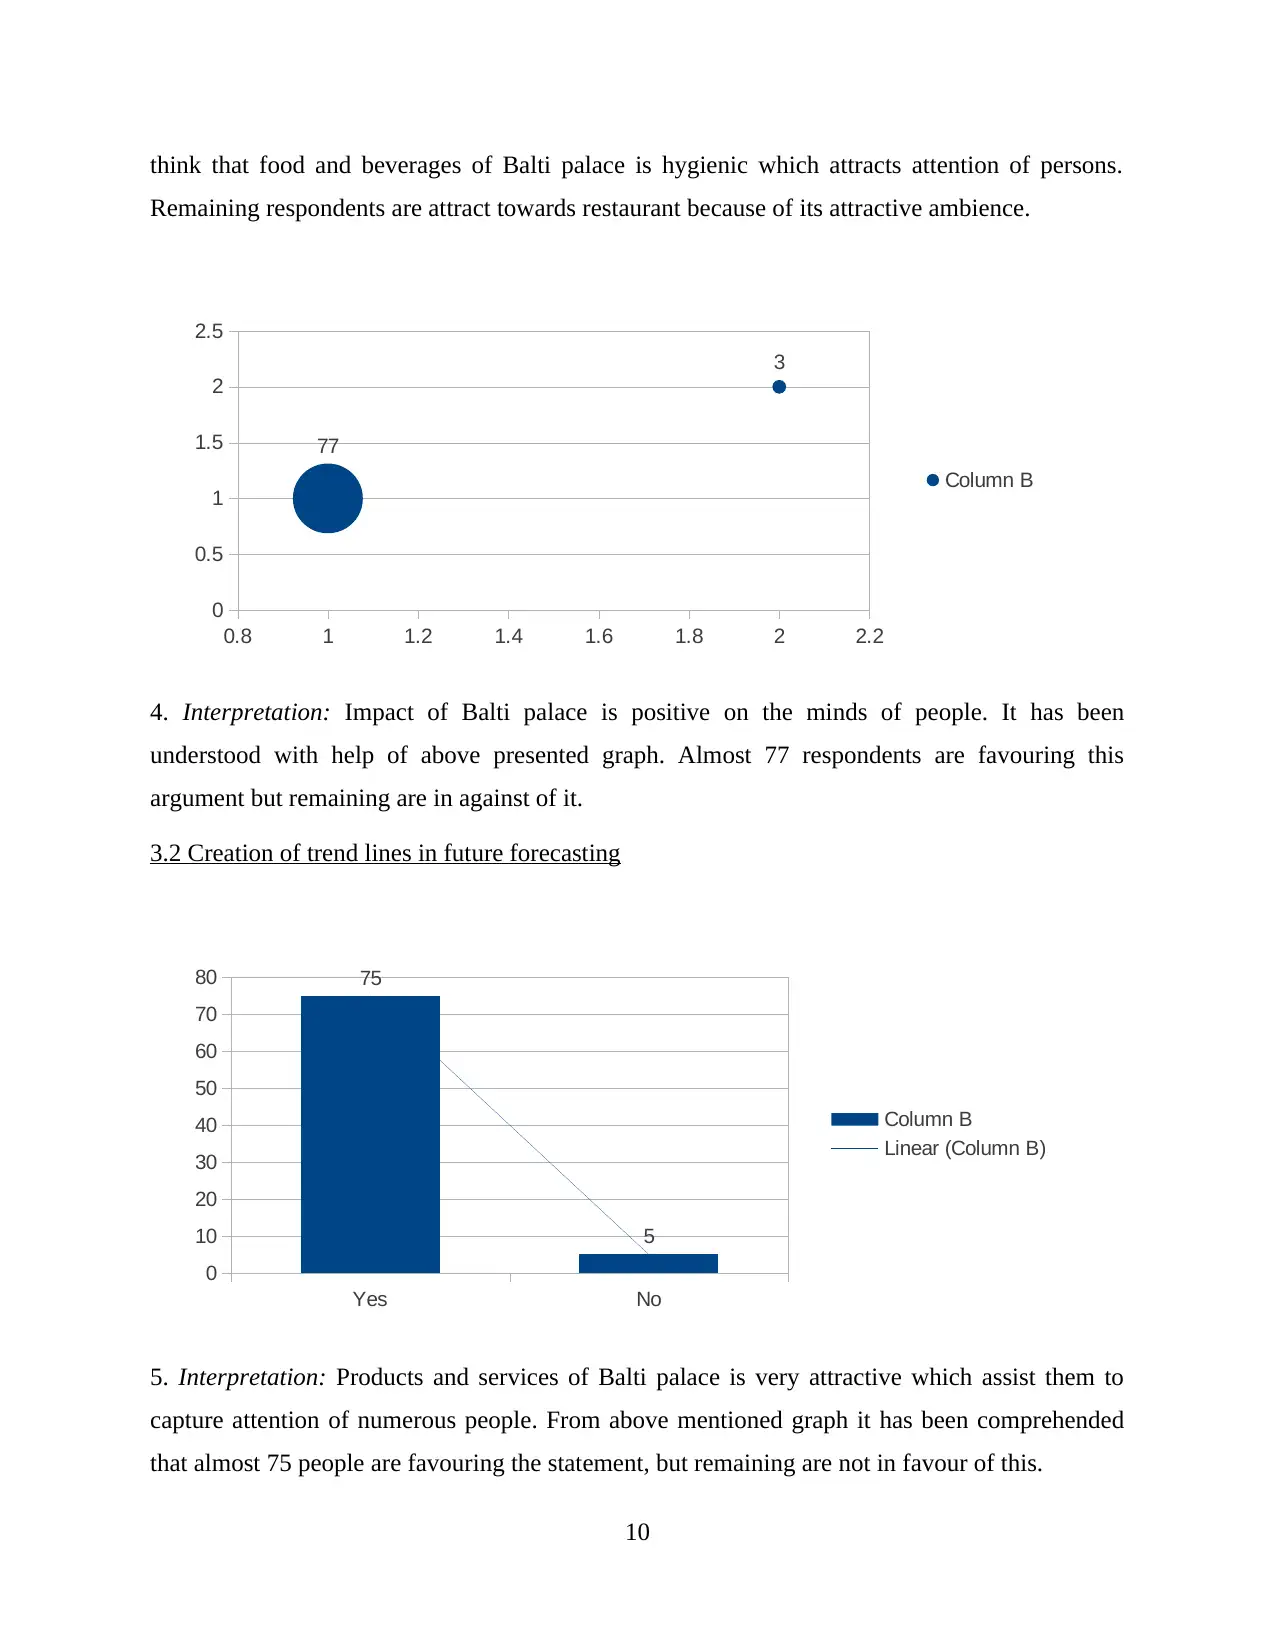
think that food and beverages of Balti palace is hygienic which attracts attention of persons.
Remaining respondents are attract towards restaurant because of its attractive ambience.
0.8 1 1.2 1.4 1.6 1.8 2 2.2
0
0.5
1
1.5
2
2.5
77
3
Column B
4. Interpretation: Impact of Balti palace is positive on the minds of people. It has been
understood with help of above presented graph. Almost 77 respondents are favouring this
argument but remaining are in against of it.
3.2 Creation of trend lines in future forecasting
Yes No
0
10
20
30
40
50
60
70
80 75
5
Column B
Linear (Column B)
5. Interpretation: Products and services of Balti palace is very attractive which assist them to
capture attention of numerous people. From above mentioned graph it has been comprehended
that almost 75 people are favouring the statement, but remaining are not in favour of this.
10
⊘ This is a preview!⊘
Do you want full access?
Subscribe today to unlock all pages.
Trusted by 1+ million students worldwide
1 out of 19
Related Documents


Your All-in-One AI-Powered Toolkit for Academic Success.
+13062052269
info@desklib.com
Available 24*7 on WhatsApp / Email
![[object Object]](/_next/static/media/star-bottom.7253800d.svg)
Unlock your academic potential
Copyright © 2020–2026 A2Z Services. All Rights Reserved. Developed and managed by ZUCOL.