BA4008QA Business Decision Making Report: Dolapo Plc Analysis
VerifiedAdded on 2022/11/29
|14
|4030
|244
Report
AI Summary
This report delves into the core of business decision-making, focusing on investment appraisal techniques and financial analysis. It begins by exploring various methods such as payback period, accounting rate of return, net present value, and internal rate of return, evaluating their advantages and disadvantages in the context of selecting between two machine models for Dolapo Plc. The report then transitions to analyzing Tesco's financial performance, examining liquidity and financial structure through ratio analysis, and discussing the limitations of these ratios along with other factors affecting financial performance. The report provides detailed calculations, comparisons, and recommendations, offering a comprehensive understanding of business decision-making processes and financial evaluation.

BUSINESS DECISION
MAKING
MAKING
Paraphrase This Document
Need a fresh take? Get an instant paraphrase of this document with our AI Paraphraser
Table of Contents
INTRODUCTION...........................................................................................................................3
MAIN BODY..................................................................................................................................3
Task one...........................................................................................................................................3
Question: 1(a)..............................................................................................................................4
Question: 1(b)..............................................................................................................................7
Question: 1(c)..............................................................................................................................9
Task Two.........................................................................................................................................9
Question: 2(a)..............................................................................................................................9
Question: 2(b)............................................................................................................................11
Question: 2(c)............................................................................................................................11
CONCLUSION..............................................................................................................................12
REFERENCES..............................................................................................................................13
INTRODUCTION
Business can’t survive or sustain in the market if there is no appropriate decision making
activities are carried out. The decision making is one of the important process performed in step
by step manner by every businesses (Whiteley, 2017). It allows for solving problems by finding
out the best solutions, examining and selecting the best alternatives and at last it ends by
reviewing whether the decision made was right or not. The present report is based on such aspect
of business decision making where in the first task the various investment appraisal techniques
for evaluating the alternative investments will be discussed by stating advantages and
disadvantages of many such techniques. In the second task of this report by calculating ratios, the
analysis and evaluation of Tesco’s financial performance will be discussed in terms of liquidity
and financial structure. The various limitations of accounting ratios will be discussed along with
other factor that has affect financial performance of Tesco will be discussed.
MAIN BODY
Task one
Whenever there is a need to make a new investment or the management is planning to replace
the existing machines and equipment, then investment appraisal techniques are resorts to for
making correct choice among the available alternative options. There are many investment
appraisal techniques that can be suggested to the senior management for evaluating available
alternatives like Payback period, Accounting Rate of Return or ARR, Net Present Value
technique or NPV and Internal rate of Return or IRR (Thom, 2019). The first two are non -
discounting techniques of investment appraisal and the last two are the discounting techniques of
investment appraisal. The difference lies between the two is that in the former there is no use of
Weighted Average cost of capital in determining and evaluating the investment proposals and
thus no consideration is given to the time value of money. While in the latter one, there is a use
of cost of capital for bringing the value of future cash at its present value by discounting it at the
rate determined as the WACC, and thus a consideration is given to the time value of money.
In case of Dolapo Plc., they are in need of replacing the machine in one of their production
department. They are having two mutually exclusive investment proposals for buying machinery,
but are not sure about which one to choose among these alternatives, that is two different models
⊘ This is a preview!⊘
Do you want full access?
Subscribe today to unlock all pages.
Trusted by 1+ million students worldwide
of machine; Dysn (Model 1) and Texla (Model 2). By utilizing the respective profiles provided
for the purpose of appraising these two prospective projects, the above mentioned techniques of
investment appraisal will be used to suggest which one to be selected among the two, to ensure
profitable affairs for the company in future. In the next section of this report, the evaluation of
investment proposals through investment appraisal techniques will be performed along with the
explanation of each of these techniques in order to recommend senior management machine
should be selected under each different techniques along with stating the reason for such
selection.
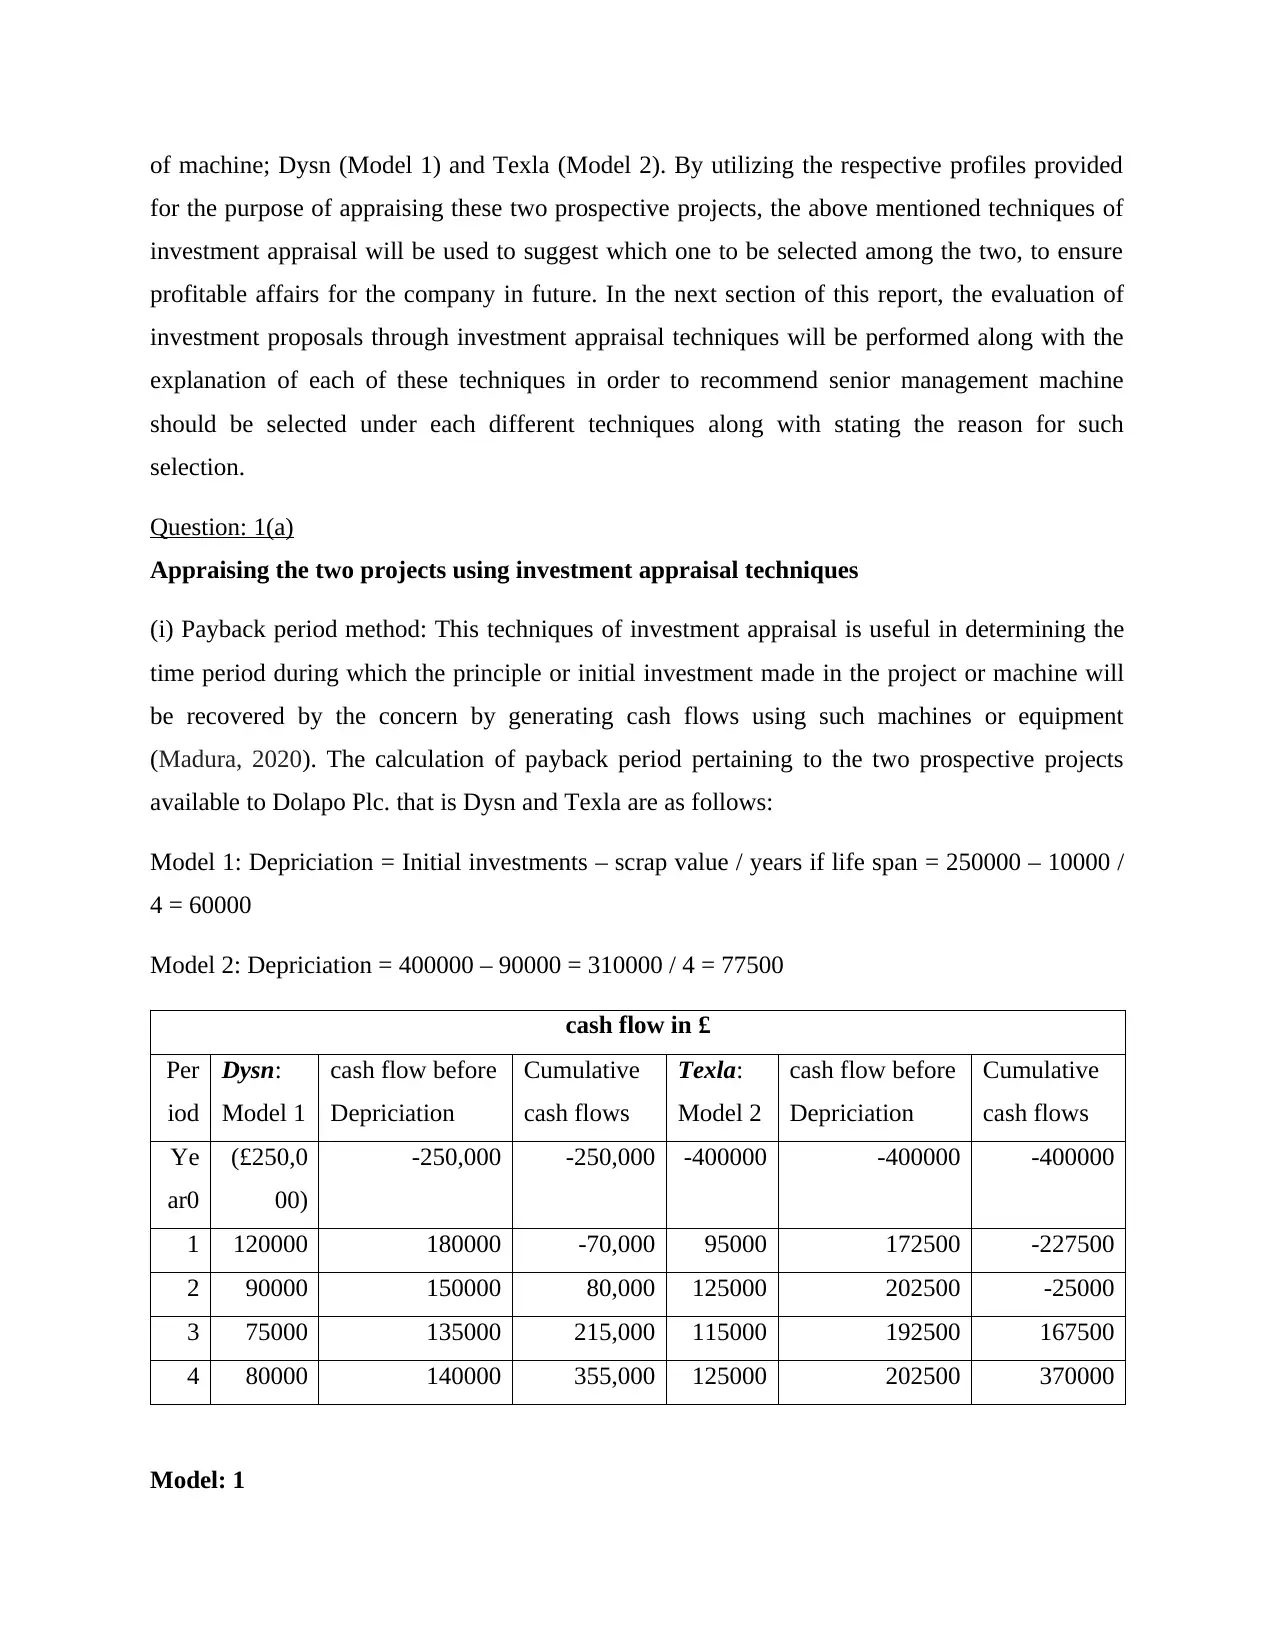
Question: 1(a)
Appraising the two projects using investment appraisal techniques
(i) Payback period method: This techniques of investment appraisal is useful in determining the
time period during which the principle or initial investment made in the project or machine will
be recovered by the concern by generating cash flows using such machines or equipment
(Madura, 2020). The calculation of payback period pertaining to the two prospective projects
available to Dolapo Plc. that is Dysn and Texla are as follows:
Model 1: Depriciation = Initial investments – scrap value / years if life span = 250000 – 10000 /
4 = 60000
Model 2: Depriciation = 400000 – 90000 = 310000 / 4 = 77500
cash flow in £
Per
iod
Dysn:
Model 1
cash flow before
Depriciation
Cumulative
cash flows
Texla:
Model 2
cash flow before
Depriciation
Cumulative
cash flows
Ye
ar0
(£250,0
00)
-250,000 -250,000 -400000 -400000 -400000
1 120000 180000 -70,000 95000 172500 -227500
2 90000 150000 80,000 125000 202500 -25000
3 75000 135000 215,000 115000 192500 167500
4 80000 140000 355,000 125000 202500 370000
Model: 1
for the purpose of appraising these two prospective projects, the above mentioned techniques of
investment appraisal will be used to suggest which one to be selected among the two, to ensure
profitable affairs for the company in future. In the next section of this report, the evaluation of
investment proposals through investment appraisal techniques will be performed along with the
explanation of each of these techniques in order to recommend senior management machine
should be selected under each different techniques along with stating the reason for such
selection.
Question: 1(a)
Appraising the two projects using investment appraisal techniques
(i) Payback period method: This techniques of investment appraisal is useful in determining the
time period during which the principle or initial investment made in the project or machine will
be recovered by the concern by generating cash flows using such machines or equipment
(Madura, 2020). The calculation of payback period pertaining to the two prospective projects
available to Dolapo Plc. that is Dysn and Texla are as follows:
Model 1: Depriciation = Initial investments – scrap value / years if life span = 250000 – 10000 /
4 = 60000
Model 2: Depriciation = 400000 – 90000 = 310000 / 4 = 77500
cash flow in £
Per
iod
Dysn:
Model 1
cash flow before
Depriciation
Cumulative
cash flows
Texla:
Model 2
cash flow before
Depriciation
Cumulative
cash flows
Ye
ar0
(£250,0
00)
-250,000 -250,000 -400000 -400000 -400000
1 120000 180000 -70,000 95000 172500 -227500
2 90000 150000 80,000 125000 202500 -25000
3 75000 135000 215,000 115000 192500 167500
4 80000 140000 355,000 125000 202500 370000
Model: 1
Paraphrase This Document
Need a fresh take? Get an instant paraphrase of this document with our AI Paraphraser
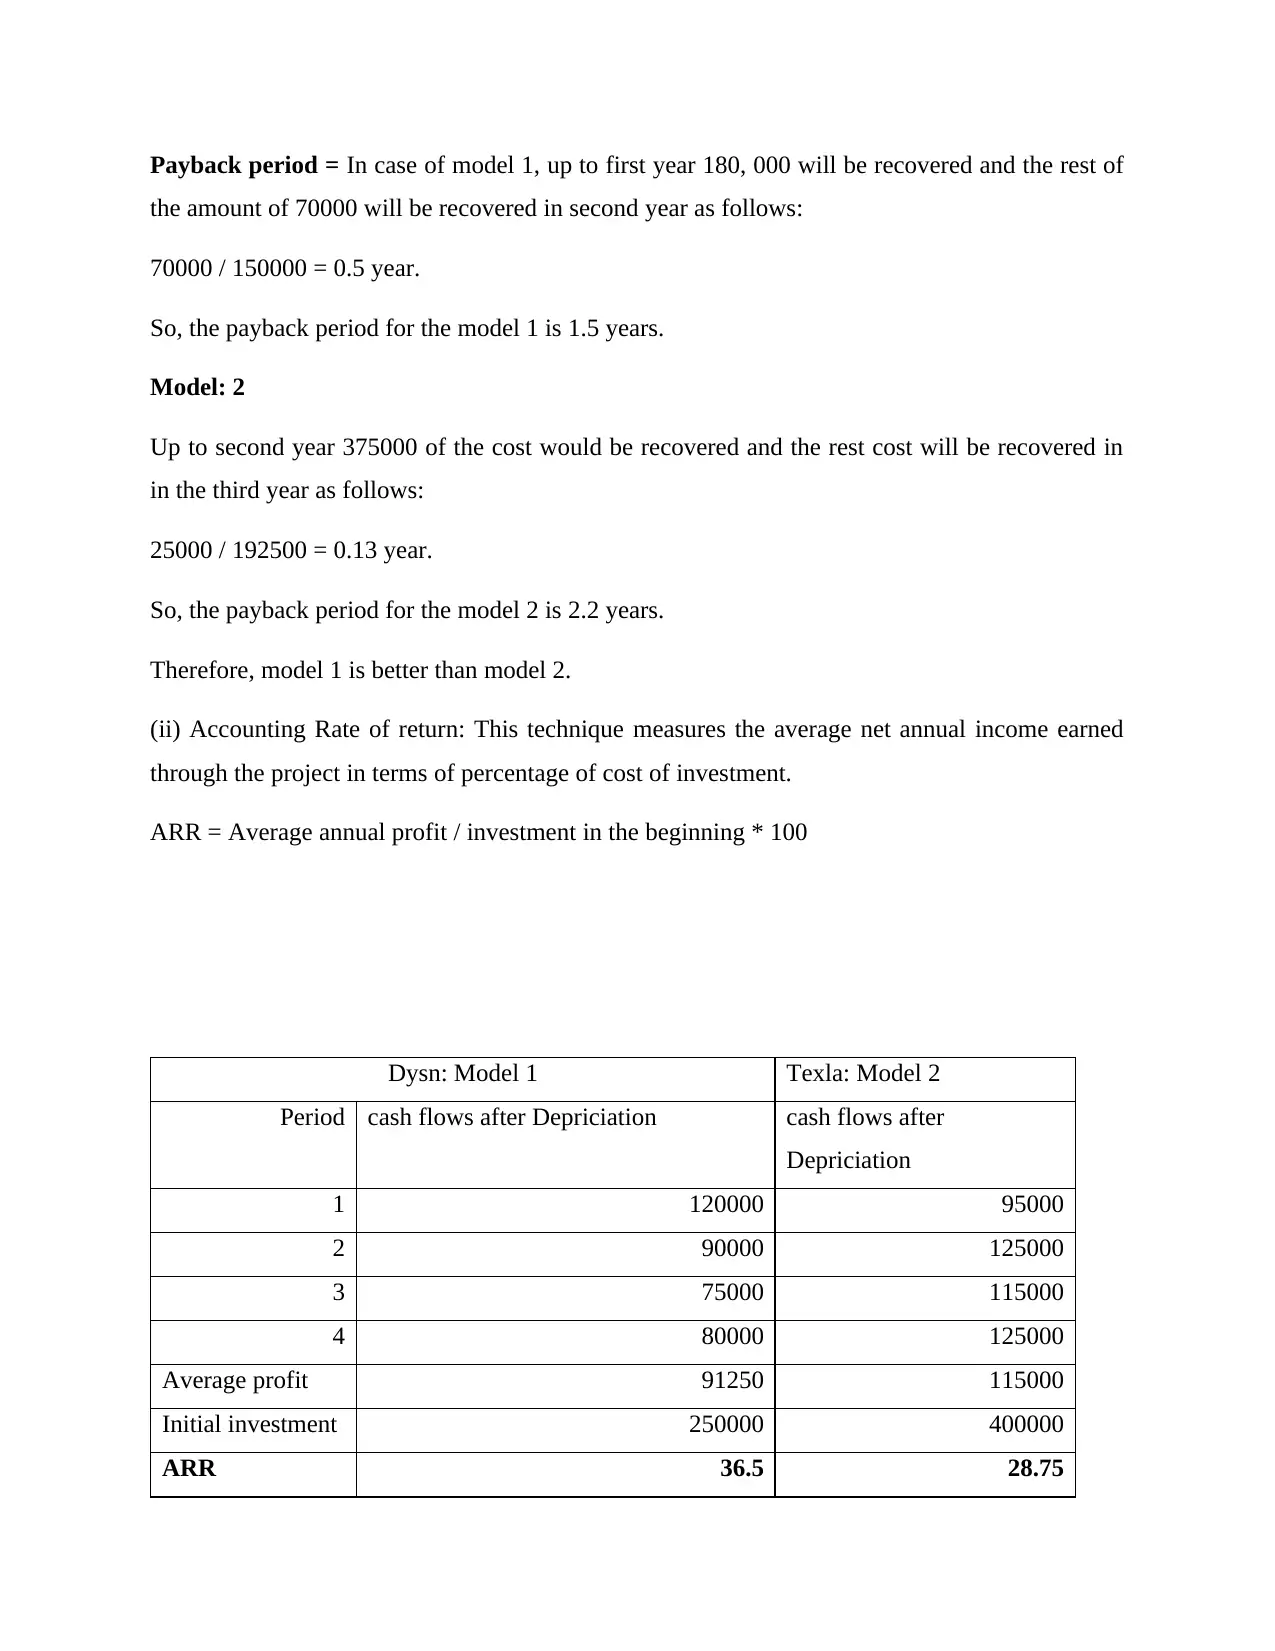
Payback period = In case of model 1, up to first year 180, 000 will be recovered and the rest of
the amount of 70000 will be recovered in second year as follows:
70000 / 150000 = 0.5 year.
So, the payback period for the model 1 is 1.5 years.
Model: 2
Up to second year 375000 of the cost would be recovered and the rest cost will be recovered in
in the third year as follows:
25000 / 192500 = 0.13 year.
So, the payback period for the model 2 is 2.2 years.
Therefore, model 1 is better than model 2.
(ii) Accounting Rate of return: This technique measures the average net annual income earned
through the project in terms of percentage of cost of investment.
ARR = Average annual profit / investment in the beginning * 100
Dysn: Model 1 Texla: Model 2
Period cash flows after Depriciation cash flows after
Depriciation
1 120000 95000
2 90000 125000
3 75000 115000
4 80000 125000
Average profit 91250 115000
Initial investment 250000 400000
ARR 36.5 28.75
Therefore, model 1 is better than model 2.
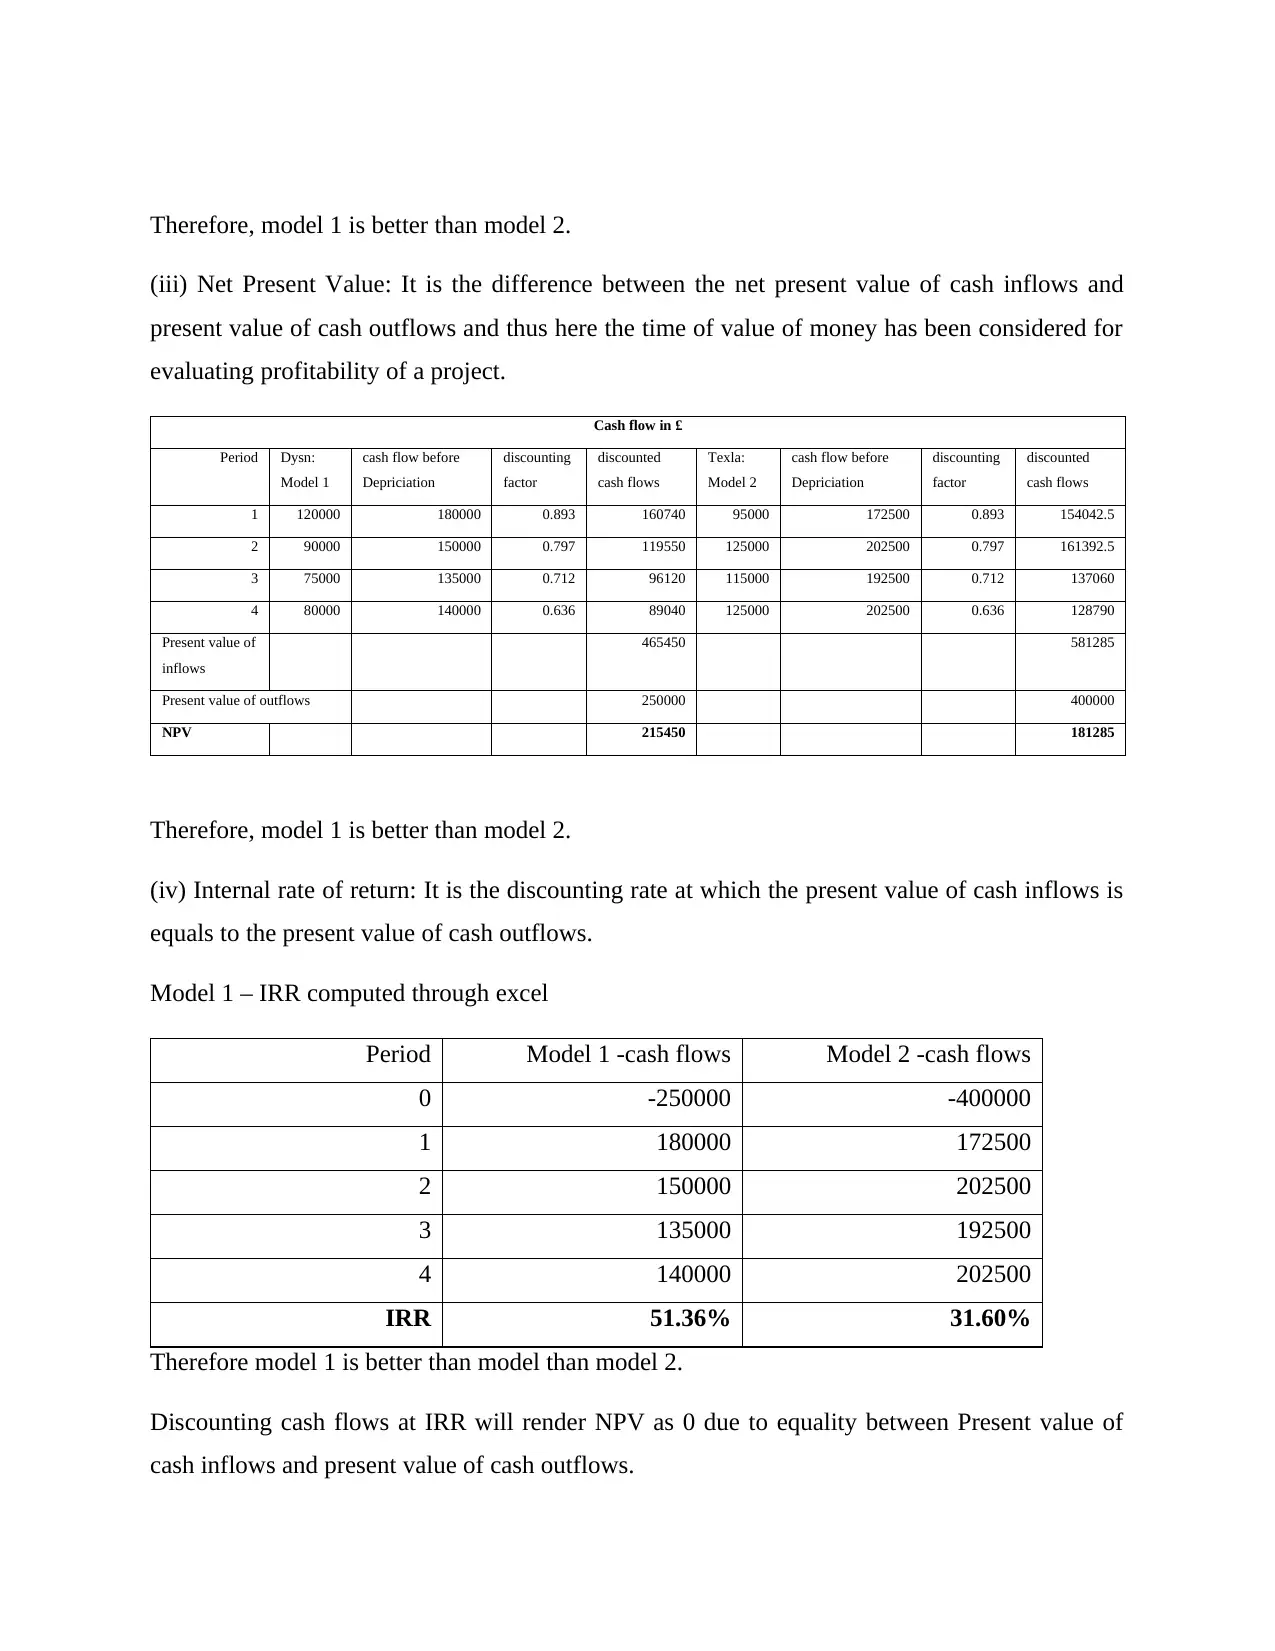
(iii) Net Present Value: It is the difference between the net present value of cash inflows and
present value of cash outflows and thus here the time of value of money has been considered for
evaluating profitability of a project.
Cash flow in £
Period Dysn:
Model 1
cash flow before
Depriciation
discounting
factor
discounted
cash flows
Texla:
Model 2
cash flow before
Depriciation
discounting
factor
discounted
cash flows
1 120000 180000 0.893 160740 95000 172500 0.893 154042.5
2 90000 150000 0.797 119550 125000 202500 0.797 161392.5
3 75000 135000 0.712 96120 115000 192500 0.712 137060
4 80000 140000 0.636 89040 125000 202500 0.636 128790
Present value of
inflows
465450 581285
Present value of outflows 250000 400000
NPV 215450 181285
Therefore, model 1 is better than model 2.
(iv) Internal rate of return: It is the discounting rate at which the present value of cash inflows is
equals to the present value of cash outflows.
Model 1 – IRR computed through excel
Period Model 1 -cash flows Model 2 -cash flows
0 -250000 -400000
1 180000 172500
2 150000 202500
3 135000 192500
4 140000 202500
IRR 51.36% 31.60%
Therefore model 1 is better than model than model 2.
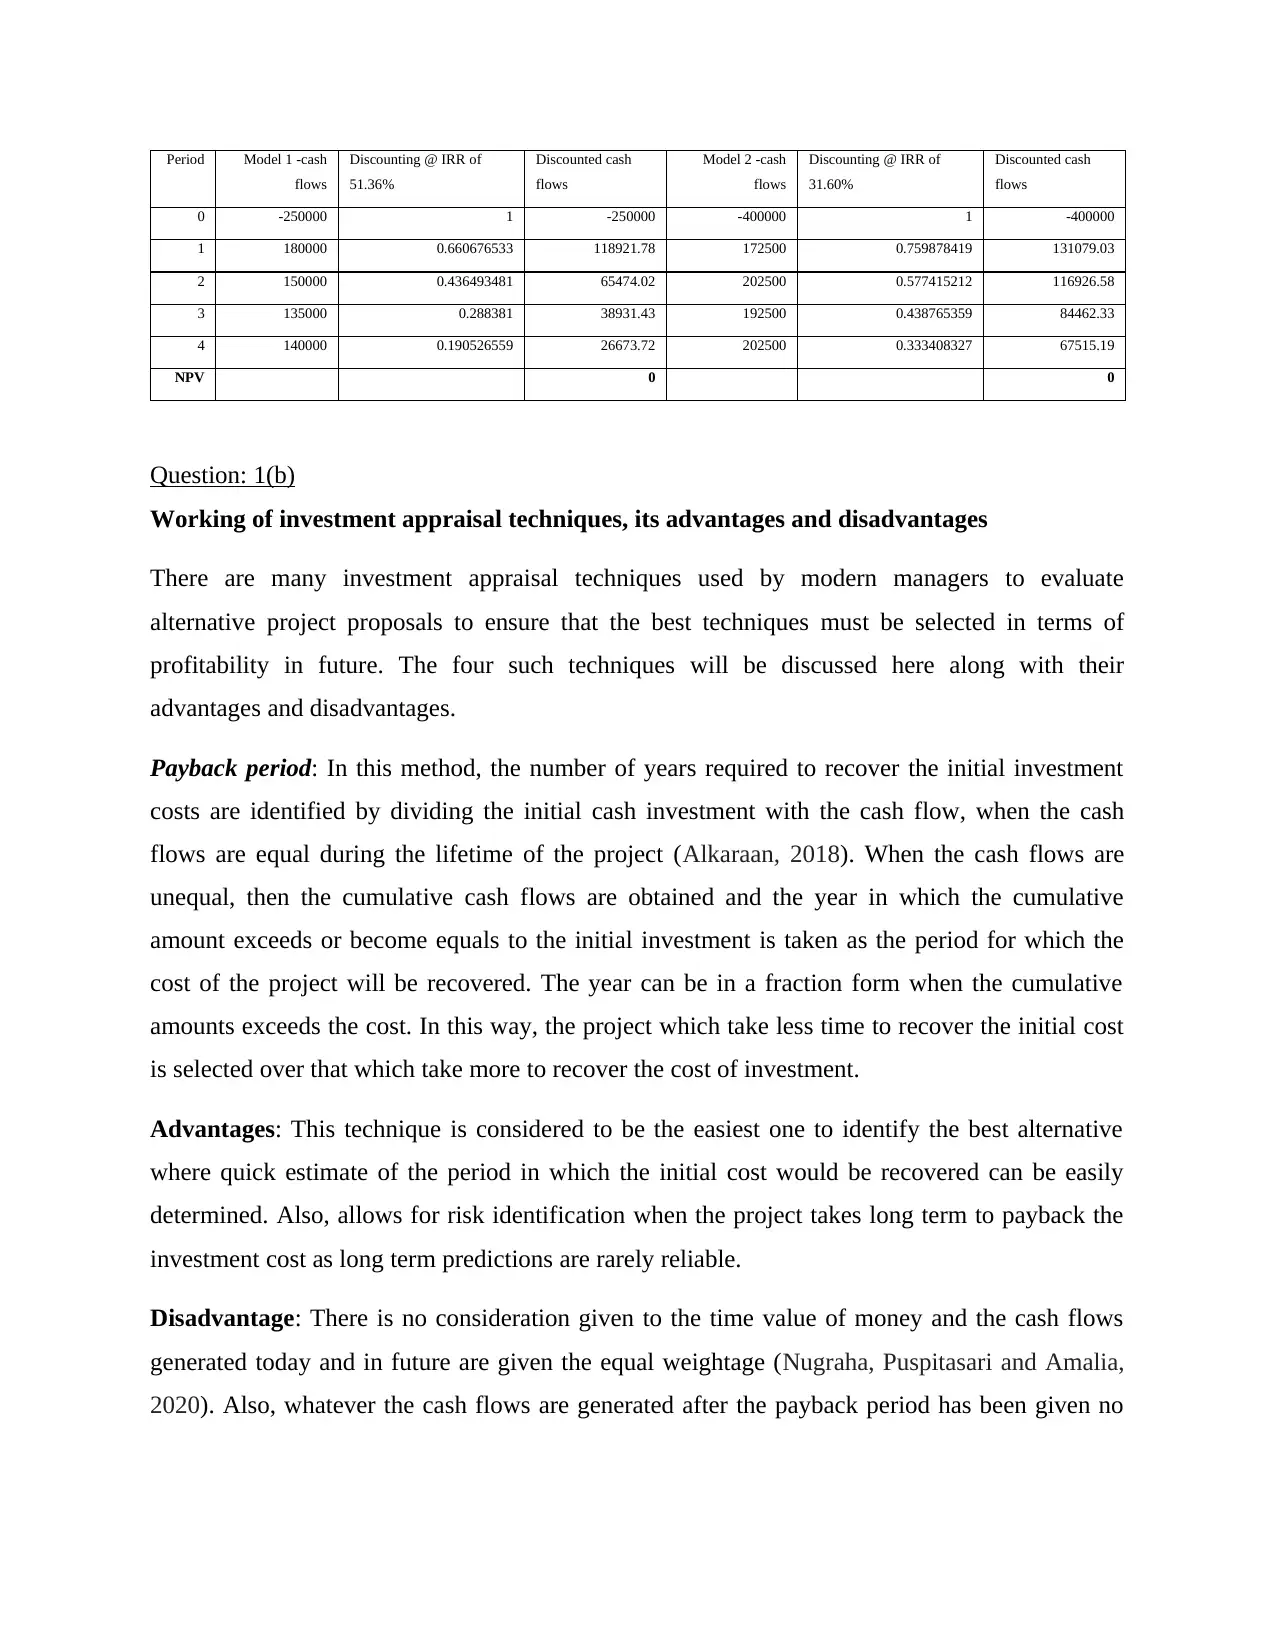
Discounting cash flows at IRR will render NPV as 0 due to equality between Present value of
cash inflows and present value of cash outflows.
(iii) Net Present Value: It is the difference between the net present value of cash inflows and
present value of cash outflows and thus here the time of value of money has been considered for
evaluating profitability of a project.
Cash flow in £
Period Dysn:
Model 1
cash flow before
Depriciation
discounting
factor
discounted
cash flows
Texla:
Model 2
cash flow before
Depriciation
discounting
factor
discounted
cash flows
1 120000 180000 0.893 160740 95000 172500 0.893 154042.5
2 90000 150000 0.797 119550 125000 202500 0.797 161392.5
3 75000 135000 0.712 96120 115000 192500 0.712 137060
4 80000 140000 0.636 89040 125000 202500 0.636 128790
Present value of
inflows
465450 581285
Present value of outflows 250000 400000
NPV 215450 181285
Therefore, model 1 is better than model 2.
(iv) Internal rate of return: It is the discounting rate at which the present value of cash inflows is
equals to the present value of cash outflows.
Model 1 – IRR computed through excel
Period Model 1 -cash flows Model 2 -cash flows
0 -250000 -400000
1 180000 172500
2 150000 202500
3 135000 192500
4 140000 202500
IRR 51.36% 31.60%
Therefore model 1 is better than model than model 2.
Discounting cash flows at IRR will render NPV as 0 due to equality between Present value of
cash inflows and present value of cash outflows.
⊘ This is a preview!⊘
Do you want full access?
Subscribe today to unlock all pages.
Trusted by 1+ million students worldwide
Period Model 1 -cash
flows
Discounting @ IRR of
51.36%
Discounted cash
flows
Model 2 -cash
flows
Discounting @ IRR of
31.60%
Discounted cash
flows
0 -250000 1 -250000 -400000 1 -400000
1 180000 0.660676533 118921.78 172500 0.759878419 131079.03
2 150000 0.436493481 65474.02 202500 0.577415212 116926.58
3 135000 0.288381 38931.43 192500 0.438765359 84462.33
4 140000 0.190526559 26673.72 202500 0.333408327 67515.19
NPV 0 0
Question: 1(b)
Working of investment appraisal techniques, its advantages and disadvantages
There are many investment appraisal techniques used by modern managers to evaluate
alternative project proposals to ensure that the best techniques must be selected in terms of
profitability in future. The four such techniques will be discussed here along with their
advantages and disadvantages.
Payback period: In this method, the number of years required to recover the initial investment
costs are identified by dividing the initial cash investment with the cash flow, when the cash
flows are equal during the lifetime of the project (Alkaraan, 2018). When the cash flows are
unequal, then the cumulative cash flows are obtained and the year in which the cumulative
amount exceeds or become equals to the initial investment is taken as the period for which the
cost of the project will be recovered. The year can be in a fraction form when the cumulative
amounts exceeds the cost. In this way, the project which take less time to recover the initial cost
is selected over that which take more to recover the cost of investment.
Advantages: This technique is considered to be the easiest one to identify the best alternative
where quick estimate of the period in which the initial cost would be recovered can be easily
determined. Also, allows for risk identification when the project takes long term to payback the
investment cost as long term predictions are rarely reliable.
Disadvantage: There is no consideration given to the time value of money and the cash flows
generated today and in future are given the equal weightage (Nugraha, Puspitasari and Amalia,
2020). Also, whatever the cash flows are generated after the payback period has been given no
flows
Discounting @ IRR of
51.36%
Discounted cash
flows
Model 2 -cash
flows
Discounting @ IRR of
31.60%
Discounted cash
flows
0 -250000 1 -250000 -400000 1 -400000
1 180000 0.660676533 118921.78 172500 0.759878419 131079.03
2 150000 0.436493481 65474.02 202500 0.577415212 116926.58
3 135000 0.288381 38931.43 192500 0.438765359 84462.33
4 140000 0.190526559 26673.72 202500 0.333408327 67515.19
NPV 0 0
Question: 1(b)
Working of investment appraisal techniques, its advantages and disadvantages
There are many investment appraisal techniques used by modern managers to evaluate
alternative project proposals to ensure that the best techniques must be selected in terms of
profitability in future. The four such techniques will be discussed here along with their
advantages and disadvantages.
Payback period: In this method, the number of years required to recover the initial investment
costs are identified by dividing the initial cash investment with the cash flow, when the cash
flows are equal during the lifetime of the project (Alkaraan, 2018). When the cash flows are
unequal, then the cumulative cash flows are obtained and the year in which the cumulative
amount exceeds or become equals to the initial investment is taken as the period for which the
cost of the project will be recovered. The year can be in a fraction form when the cumulative
amounts exceeds the cost. In this way, the project which take less time to recover the initial cost
is selected over that which take more to recover the cost of investment.
Advantages: This technique is considered to be the easiest one to identify the best alternative
where quick estimate of the period in which the initial cost would be recovered can be easily
determined. Also, allows for risk identification when the project takes long term to payback the
investment cost as long term predictions are rarely reliable.
Disadvantage: There is no consideration given to the time value of money and the cash flows
generated today and in future are given the equal weightage (Nugraha, Puspitasari and Amalia,
2020). Also, whatever the cash flows are generated after the payback period has been given no
Paraphrase This Document
Need a fresh take? Get an instant paraphrase of this document with our AI Paraphraser
consideration and the selection is made on the basis of cash flows lying within the duration of
payback. This technique is not suitable for projects that are having profitability in long term.
Accounting rate of return: It determines the average rate of return earned by the investment by
calculating the average annual income of the project as a proportion of initial investment. The
average of income generated during the life of the project is taken as numerator while the
denominator is initial investment of the project.
Advantages: The data for this technique is readily available from the financial reports of the
concern. The consideration here is given to the operating results and performance of
management while evaluating the performance of an investment. Here also consideration to the
entire cash flows during the life of a project are considered.
Disadvantages: This technique also not consider the time value of money. The procedures
followed in accounting affects the evaluation of projects (Ishmuhametov and Kuzmina-Merlino,
2017). It uses net income rather than cash flows, while cash flows are better measure of
investment performance.
Net present value: It is the discounting technique of the investment appraisal where the future
cash flows are discounted to determine the present value of future cash inflows. Then NPV is
positive when the present value of future cash flows is higher than the present value of cash
outflows. NPV is negative when PV of future cash inflows is less than the PV of cash outflows.
NPV can be zero if both PV of cash inflows and outflows are equal. Therefore, the project with
higher and positive NPV is selected over the lower and negative NPV.
Advantages: This technique gives consideration to time value of money. The whole cash flows
throughout the life of a project is considered (Hashim and Piatti-Fünfkirchen, 2018). Due to
having discounted cash flows, NPVs of two projects can be easily compared.
Disadvantages: It is quite a complex technique as it requires correct and accurate estimation of
two factor that is discounting rate and cash flows and the same is quite impossible in practice.
Internal rate of Return: This technique determines that discounting rate at which the NPV
becomes zero and the PV value of cash outflows and inflows are equal. It is rate of return to the
company from the investment in the project. If IRR is less than the cost of capital then the
project should be rejected the project should be selected when IRR is greater than cost of capital.
Among two mutually exclusive projects, project with higher IRR must be selected over the lower
one.
Advantages: It considers time value of money and entire cash flows of the project. Also, there
can be instantaneous selection of projects can be done by comparing IRR with the cost of capital.
Disadvantages: The process of determining the IRR is quite difficult and time consuming
(Waxman, 2017). It does not provide for comparison between projects having different patterns
of inflows and outflows.
Question: 1(c)
In case of payback period, machine 1 that is Dysn must be selected over Texla as the payback
period for Dysn that is 1.5 years is lower than 2.2 years in case of Texla which allows for earlier
recovery of investment cost.
In case accounting rate of return is also higher in case of Dysn which is 36.5% than Texla’s
28.75%. So, again the machine 1 should be selected as it will provide for profitability.
In case of NPV, again Dysn has higher NPV of 215450 than lower NPV 181285 of Texla, so
machine 1 should be selected as it is indicating higher current profitability.
In case of IRR, Dysn again proves to be superior to Texla by having 51.36% IRR as compared to
just 31.6% in case of Texla, so Dysn must be selected over Texla due to having more return for
the company as compared to the cost of financing it.
Task Two
Question: 2(a)
Analyzing the financial performance of Tesco in year 2017, 2018 and 2019
Performance in terms of profitability of Tesco: All the three ratio of profitability are indicating
an upward movement between the periods of 2017 to 2019. The gross margin indicates that the
company is making profits after selling its products in the market which is increasing
continuously from last three years. It is the amount remains with the company after paying direct
cost of the goods sold. So, the measure of company’s profitability is indicating favorable
situation in the company (Alhadhrami and Nobanee, 2019). Return on total assets indicates
⊘ This is a preview!⊘
Do you want full access?
Subscribe today to unlock all pages.
Trusted by 1+ million students worldwide
company’s efficiency in generating earnings by using its total assets which is also increasing
from past three years. Also, return on capital employed indicating how well the capital of the
company is being utilized and invested in the business in order to generate returns to the
shareholders and investors. And this ratio again is indicating major rise from 2017 to 2019
wherein 2017 it is just 0.55 and it becomes 5.9 in 2019. Return on assets has also increased from
0.32 in 2017 to 2.89 in 2018 and 3.41 in 2019 showing a continuous rise in three years. Also, the
gross profit margin of the company is 5.19 in 2017, 5.83 in 2018 and 6.48 in 2019 again
indicating a continuous rise from three years. Therefore, it can be said that the company that is,
Tesco is highly profitable in last three years and performing very well in the market.
Performance in terms of liquidity of Tesco: Both the ratios indicating the company’s liquidity is
falling continuously in last three years indicating that the company would definitely going to face
problems in meeting its short term obligations (Broyles, 2020). Ideal current ratio for a concern
is 2:1. While Tesco is having its current ratio in all the three years below the ideal ratio that is,
0.79 in 2017, 0.71 in 2018 and 0.61 in 2019 and even there is a continuous downfall. Also, the
ideal liquidity ratio must be 1:1, where there must be enough liquid assets to meet the immediate
liabilities. But in case of Tesco it is not so, as it is having its liquidity ratio below the ideal level
that is, 0.68 in 2017, 0.61 in 2018 and 0.49 in 2019 indicating that the company is not having
enough liquid assets to meet its current liabilities. Therefore, it can be said that the company’s
liquidity position is not so well in the past three years.
Performance in terms of Efficiency of Tesco: Efficiency of Tesco in all the three years is quite
stable where its inventory days has minor fluctuations in 2018 which is also gets corrected in
2019. Inventory days indicates how much time it takes for the company to concert their stock of
inventory in actual sales. Both trade receivables and trade payables are quite stable by having
again minor fluctuations in 2018 which is also gets corrected in 2019. So, it can be said that the
company is efficient enough in its business operations.
Financial structure of Tesco: The financial structure indicated by the gearing ratio of the
company is much higher than the required ratio of 15%. But in case of Tesco, it is above 100%
in all the three years that is, 454.44 % in 2017, 233.35% in 2018 and 161.26% in 2019 indicating
that the company is highly geared or resorted on debt capital over shareholder’s equity. Such a
situation indicates that the company is in high financial risks due to having fixed commitment
Paraphrase This Document
Need a fresh take? Get an instant paraphrase of this document with our AI Paraphraser
towards interest payment regularly (Osho and Adebambo, 2018). But the good point here is that
the ratio is continuously falling from past three years which is a favorable situation for the
company indicating that the company is paying off its debt and shifting to equity capital.
Question: 2(b)
The limitations pertaining to the accounting ratios are as follows:
Based on historical data: The information and data used in the ratio analysis is based
only on the historical performance of the company. But it is not always true that the past
performance will remains the same in future as well. So, current or future projections
can’t be made accurately on the basis of past information.
Inflation: If there are changes in the inflation rate across the periods under consideration,
then the data before and after inflationary changes are not compatible with each other. As
the value of figures would get changes proportionately with the rate of inflation, but in
actual there is no such changes taken place (Zhuravel and et.al., 2017).
Changing accounting policies: Comparison can’t be done between two companies
having different procedures and method of recording transactions as the financial results
are not at all comparable.
Interpretation: It is not easy to ascertain the reason of the ratio’s results. Sometimes for
a short term, ratio appears to be better but immediately it may become unfavorable within
a short period. In this way, results of ratio analysis are not accurate and reliable.
Ignorance to stock market performance: Like in case of Tesco, there was a major rise
in share price of the company from 2017 to 2018 where around 31% increase in price was
experienced. Such rise was nowhere considered while performing ratio analysis through
the fundamentals of a company (Jermsittiparsert and et.al., 2019).
Question: 2(c)
Other factors affecting Tesco’s performance
Impact of new items: Adding new and significant items in the product lines always affect
performance of the company. When new items are added into the product line, there must be an
increase in the company’s sales performance due to which the profitability gets improved.
Accordingly, financial performance of a company gets improved.
Movement in share price: The movement in share price can be both favorable and unfavorable.
Tesco has experienced favorable movements in its share price during 2017 to 2019. So, stock
market performance gets improved very much in 2019 due to the improvements in the financial
performance of the company (Horváthová and Mokrišová, 2017).
Current retail and market conditions: Industry in which Tesco is operating is a very
competitive one each day a new product or service is emerging, so the retail trends like online
buying and payment has affect Tesco’s performance in the market. Even Tesco is operating at a
low margin due to high competition.
CONCLUSION
From the above report it has been concluded that both investment appraisal techniques
and ratio analysis techniques are very much helpful for the management of the company. The
former helps management in making profitable selections among alternative proposals while the
latter is helpful for both investors and management of a company. Investors use ratio analysis for
finding best investment avenues while management make various decisions on the basis of past
performances in order to make sufficient policy changes for better financial performance.
⊘ This is a preview!⊘
Do you want full access?
Subscribe today to unlock all pages.
Trusted by 1+ million students worldwide
1 out of 14
Related Documents


Your All-in-One AI-Powered Toolkit for Academic Success.
+13062052269
info@desklib.com
Available 24*7 on WhatsApp / Email
![[object Object]](/_next/static/media/star-bottom.7253800d.svg)
Unlock your academic potential
Copyright © 2020–2026 A2Z Services. All Rights Reserved. Developed and managed by ZUCOL.