Business Decision Making Assignment: Statistical Analysis and Findings

Verified

Added on  2022/11/24

|9
|947
|366
Homework Assignment
AI Summary
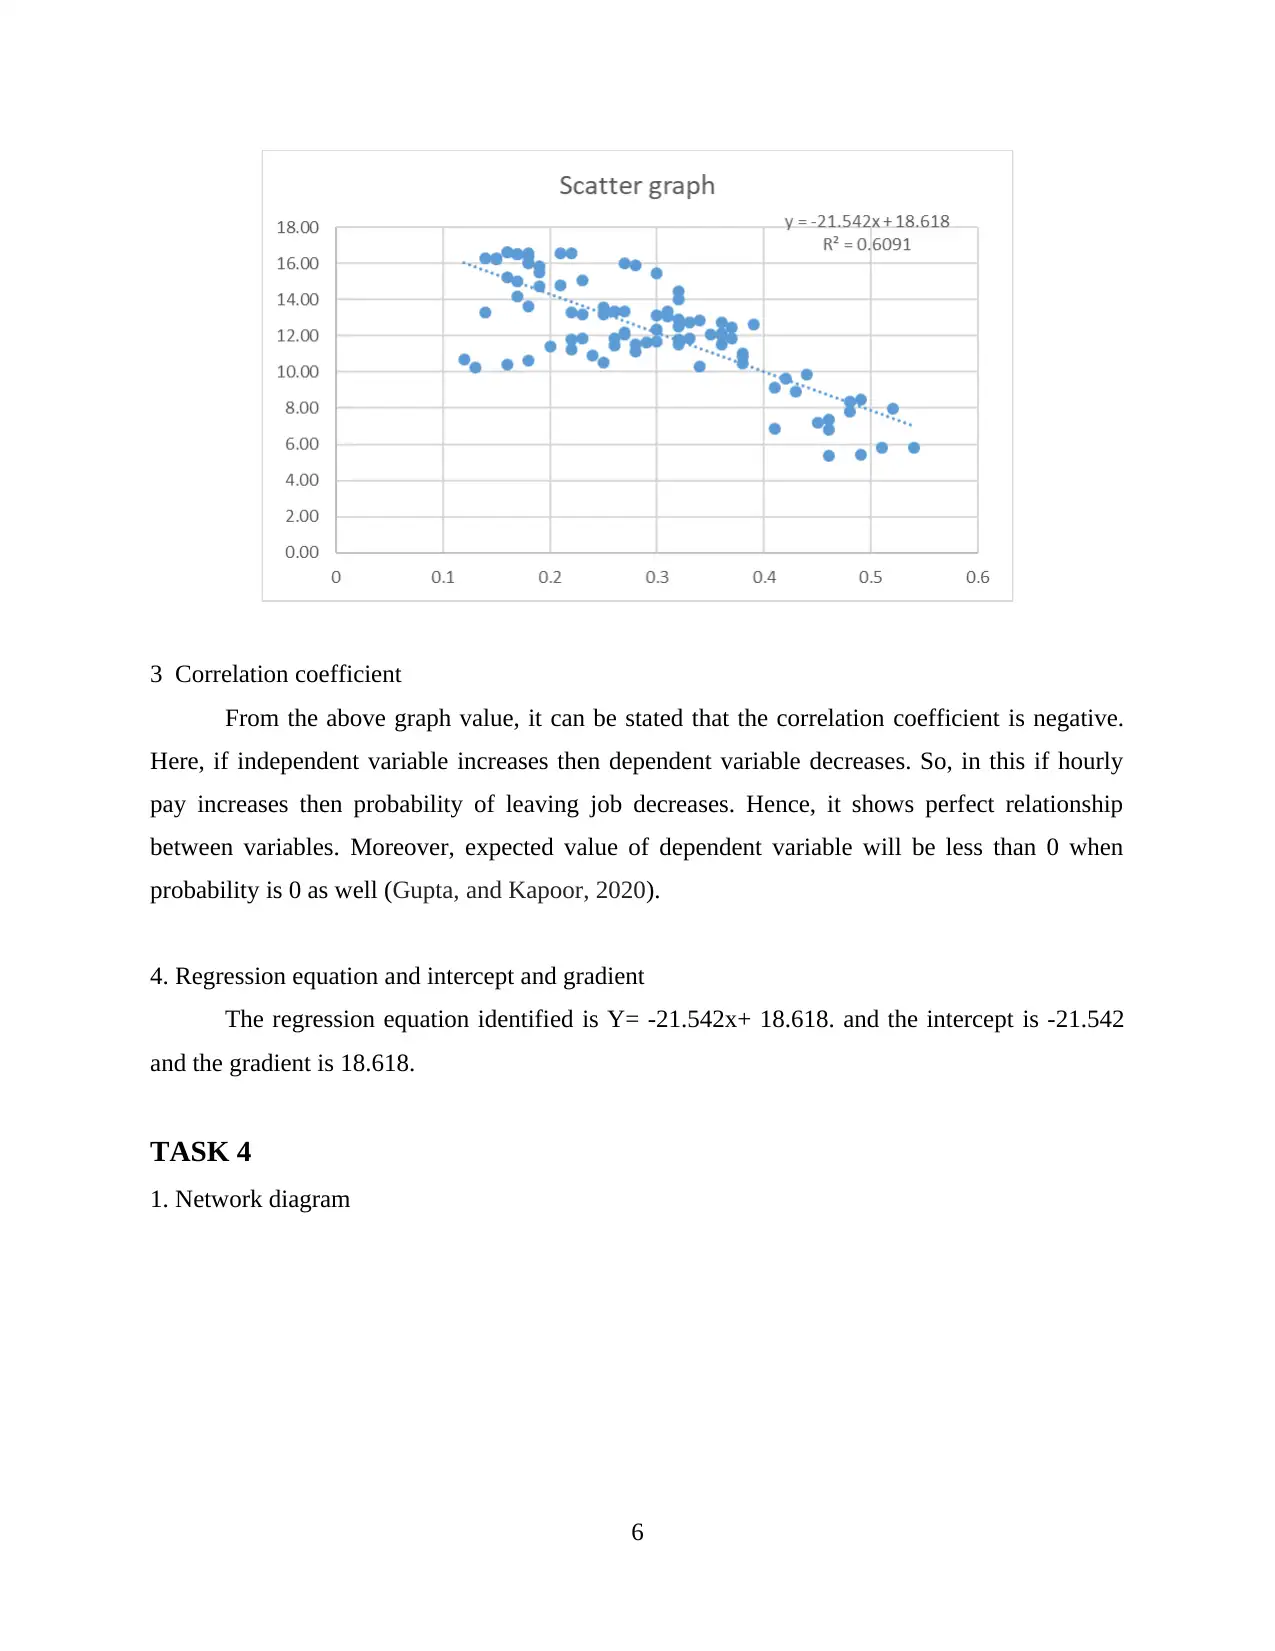
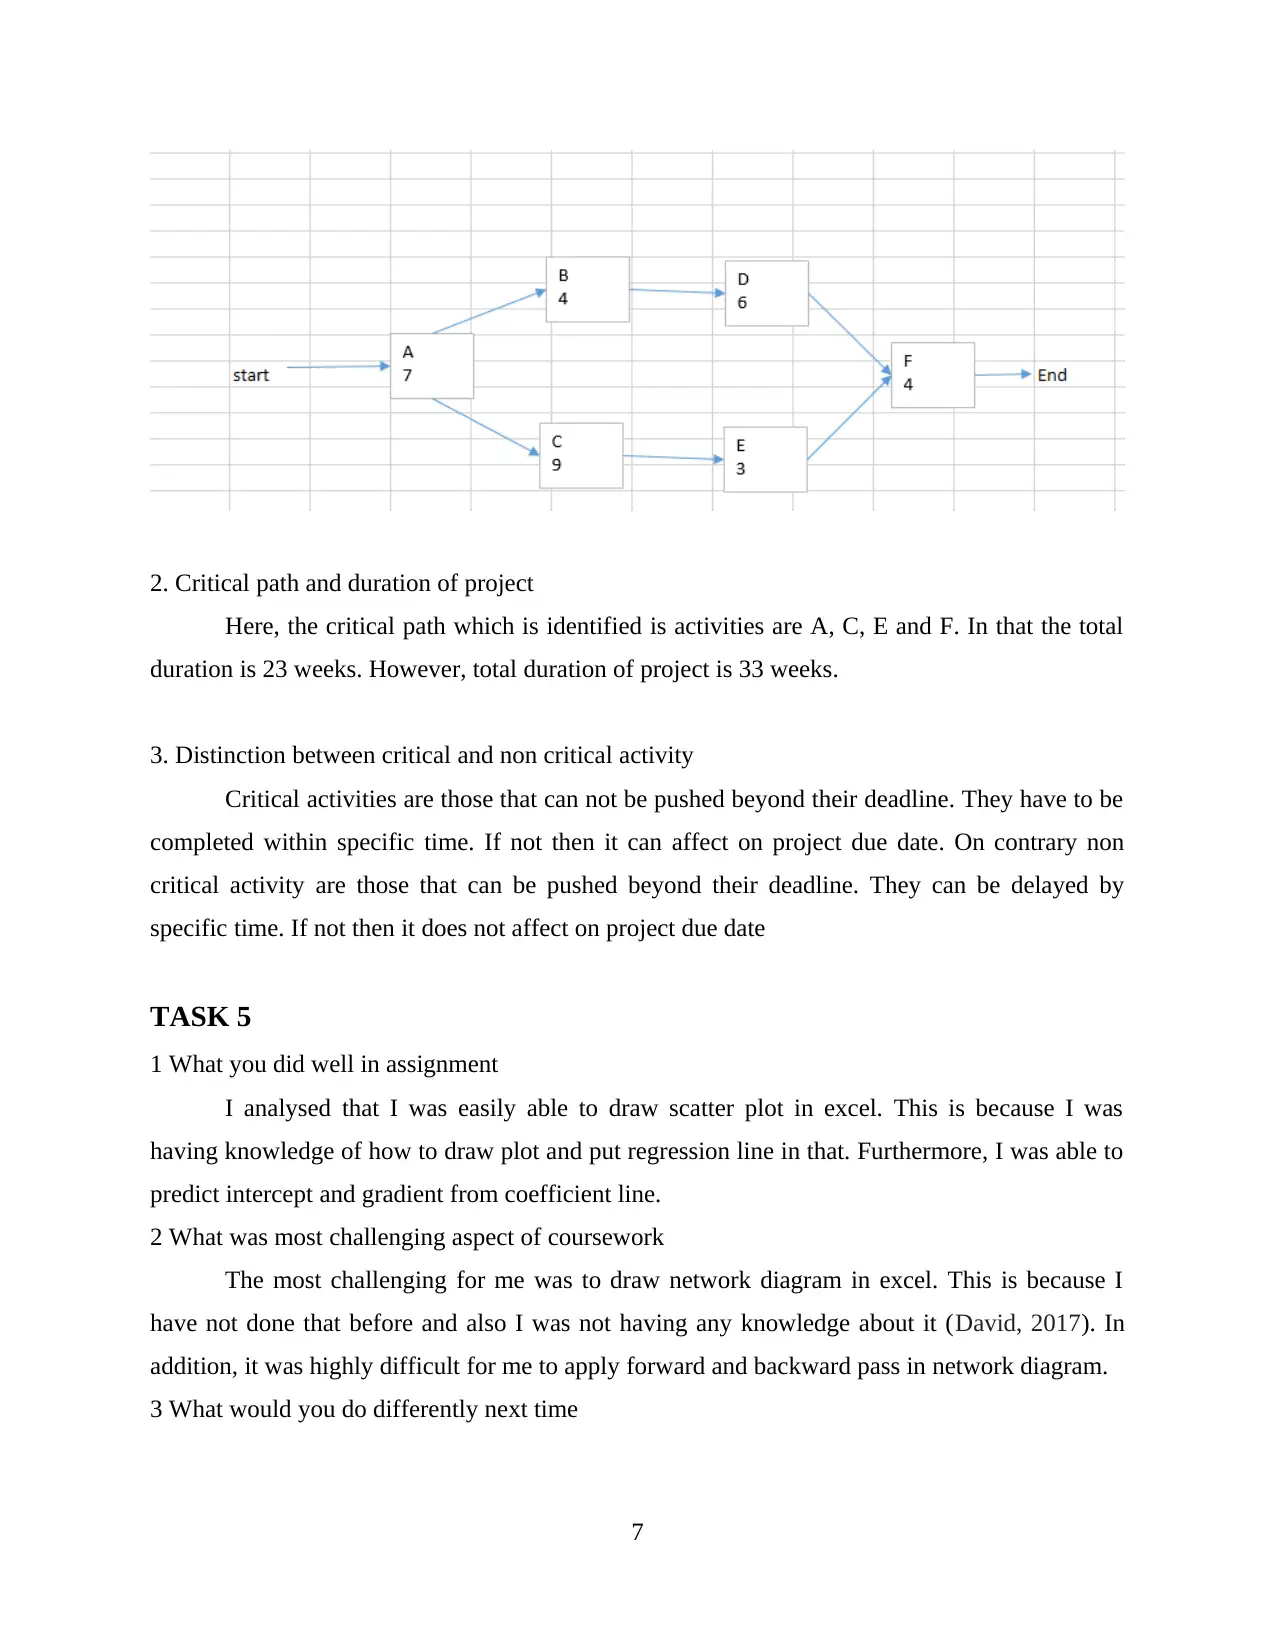
This assignment solution for a Business Decision Making course analyzes a dataset of Netflix subscribers' ages using descriptive statistics like mean, minimum, and standard deviation, and grouped frequency distributions. It then explores the relationship between hourly pay and job separation probability using scatter graphs, correlation coefficients, and regression analysis. The solution also involves creating a network diagram to identify the critical path and project duration. Finally, the assignment reflects on the student's strengths and weaknesses in completing the tasks, including challenges faced with network diagrams and plans for improvement. This assignment covers a wide range of statistical and project management techniques relevant to business decision-making.
Document Page
Business Decision Making
1
tabler-icon-diamond-filled.svg

Paraphrase This Document

Need a fresh take? Get an instant paraphrase of this document with our AI Paraphraser
Document Page
Table of Contents
TASK 1............................................................................................................................................3
TASK 2............................................................................................................................................3
TASK 3............................................................................................................................................5
TASK 4............................................................................................................................................6
TASK 5............................................................................................................................................7
REFERENCES................................................................................................................................9
2
Document Page
TASK 1
1
a) Mean= 40.88
It is said that mean is 40.88 that means average age of Netflix subscribers is 41 years. So,
people of age 41 mostly view Netflix. It is because they were getting more free time than any
another people.
b) Minimum = 15
It can be stated that minimum value of data is 15. This means that minimum age of
subscribes is 15 years. So, children have also subscribed to Netflix to view movies and TV
shows. They are highly interested in this as well.
c) SD= 16.25
it can be analysed that SD is 16.24 that means data is highly spread. There is high
variation in data and it is distributed around mean.
d) Coefficient of variation = .39
From above it can be interpreted that coefficient of variable is .39 which is no acceptable.
Thus, there is low variances in it. By that distribution is there but with low variation.
TASK 2
1
Age
Category Frequency
percentage
frequency
cummulative
frequency
cummulative percetane
frequency
Under 25 15 13.04347826 15 13.04347826
25 to 34 25 21.73913043 40 34.7826087
35 to 44 30 26.08695652 70 60.86956522
45 to 54 25 21.73913043 95 82.60869565
55 and over 20 17.39130435 115 100
Total Count 115
Mean and SD
3
Document Page
Age
Category Frequency mid value fixi
Under 25 15 12.5 187.5
25 to 34 25 29.5 737.5
35 to 44 30 39.5 1185
45 to 54 25 49.5 1237.5
55 and over 20 59.5 1190
Total Count 115 4537.5
mean 39.45652174
SD 2.73
2 Comparing mean and SD from task 1 and 2
It can be interpreted that findings from ungrouped statistics is accurate as there are mode,
median, sum, sample size, etc. is given. Thus, from that mean and SD is calculated by directly
applying formula. But in grouped the mid value may vary and it can lead to inaccurate mean and
SD.
3 Linear interpolation
Age
Category Frequency
0 15 x 30
25 25 x1 25
35 30 x2 35
45 25 y1 25
55 20 y2 30
Total Count 115
y 27.5
The estimate of median age of viewers is 27.5.
4 Cumulative frequency curve
4
tabler-icon-diamond-filled.svg

Paraphrase This Document

Need a fresh take? Get an instant paraphrase of this document with our AI Paraphraser
Document Page
TASK 3
1. It can be stated that the variable gross hourly pay is best predictor. This is because workers
whose hourly pay is less is more likely to leave job. Thus, from hourly pay it is simple to find out
job separation probability. Therefore, from hourly pay it is predictor the probability of leaving
job.
2 Scatter graph
5
Document Page
3 Correlation coefficient
From the above graph value, it can be stated that the correlation coefficient is negative.
Here, if independent variable increases then dependent variable decreases. So, in this if hourly
pay increases then probability of leaving job decreases. Hence, it shows perfect relationship
between variables. Moreover, expected value of dependent variable will be less than 0 when
probability is 0 as well (Gupta, and Kapoor, 2020).
4. Regression equation and intercept and gradient
The regression equation identified is Y= -21.542x+ 18.618. and the intercept is -21.542
and the gradient is 18.618.
TASK 4
1. Network diagram
6
Document Page
2. Critical path and duration of project
Here, the critical path which is identified is activities are A, C, E and F. In that the total
duration is 23 weeks. However, total duration of project is 33 weeks.
3. Distinction between critical and non critical activity
Critical activities are those that can not be pushed beyond their deadline. They have to be
completed within specific time. If not then it can affect on project due date. On contrary non
critical activity are those that can be pushed beyond their deadline. They can be delayed by
specific time. If not then it does not affect on project due date
TASK 5
1 What you did well in assignment
I analysed that I was easily able to draw scatter plot in excel. This is because I was
having knowledge of how to draw plot and put regression line in that. Furthermore, I was able to
predict intercept and gradient from coefficient line.
2 What was most challenging aspect of coursework
The most challenging for me was to draw network diagram in excel. This is because I
have not done that before and also I was not having any knowledge about it (David, 2017). In
addition, it was highly difficult for me to apply forward and backward pass in network diagram.
3 What would you do differently next time
7
tabler-icon-diamond-filled.svg

Paraphrase This Document

Need a fresh take? Get an instant paraphrase of this document with our AI Paraphraser
Document Page
Next time, I will first of all do search on internet, watch video and then learn it that how
to do forward and backward pass in network diagram. This will help me to do in proper way and
also I will gain knowledge about it.
8
Document Page
REFERENCES
Books and journals
Gupta, S.C. and Kapoor, V.K., 2020. Fundamentals of mathematical statistics. Sultan Chand &
Sons.
David, M., 2017. Statistics for managers, using Microsoft excel. Pearson Education India.
9
chevron_up_icon
1 out of 9
circle_padding
hide_on_mobile
zoom_out_icon
[object Object]