Business Decision Making Assignment: Analysis and Hypothesis Testing

Verified

Added on  2020/02/24

|7
|845
|102
Homework Assignment
AI Summary
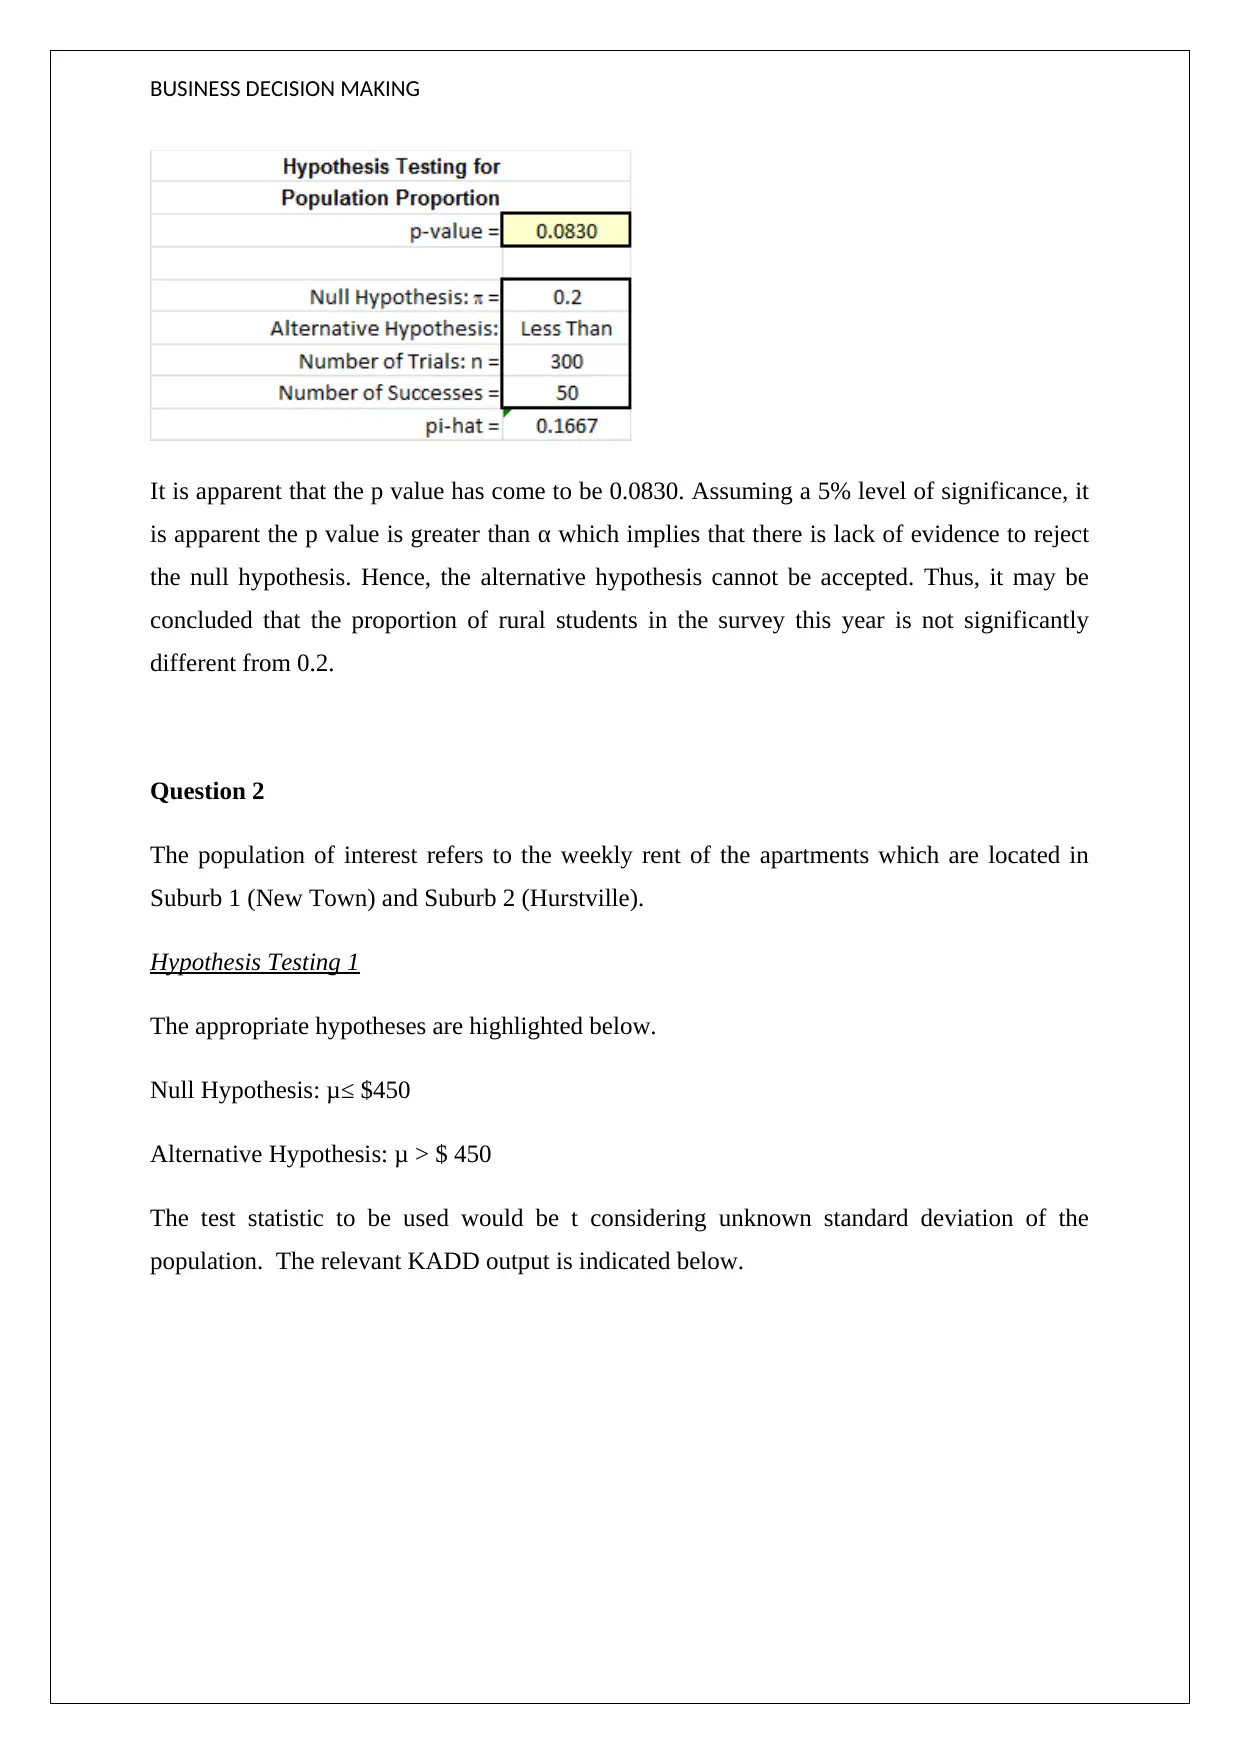
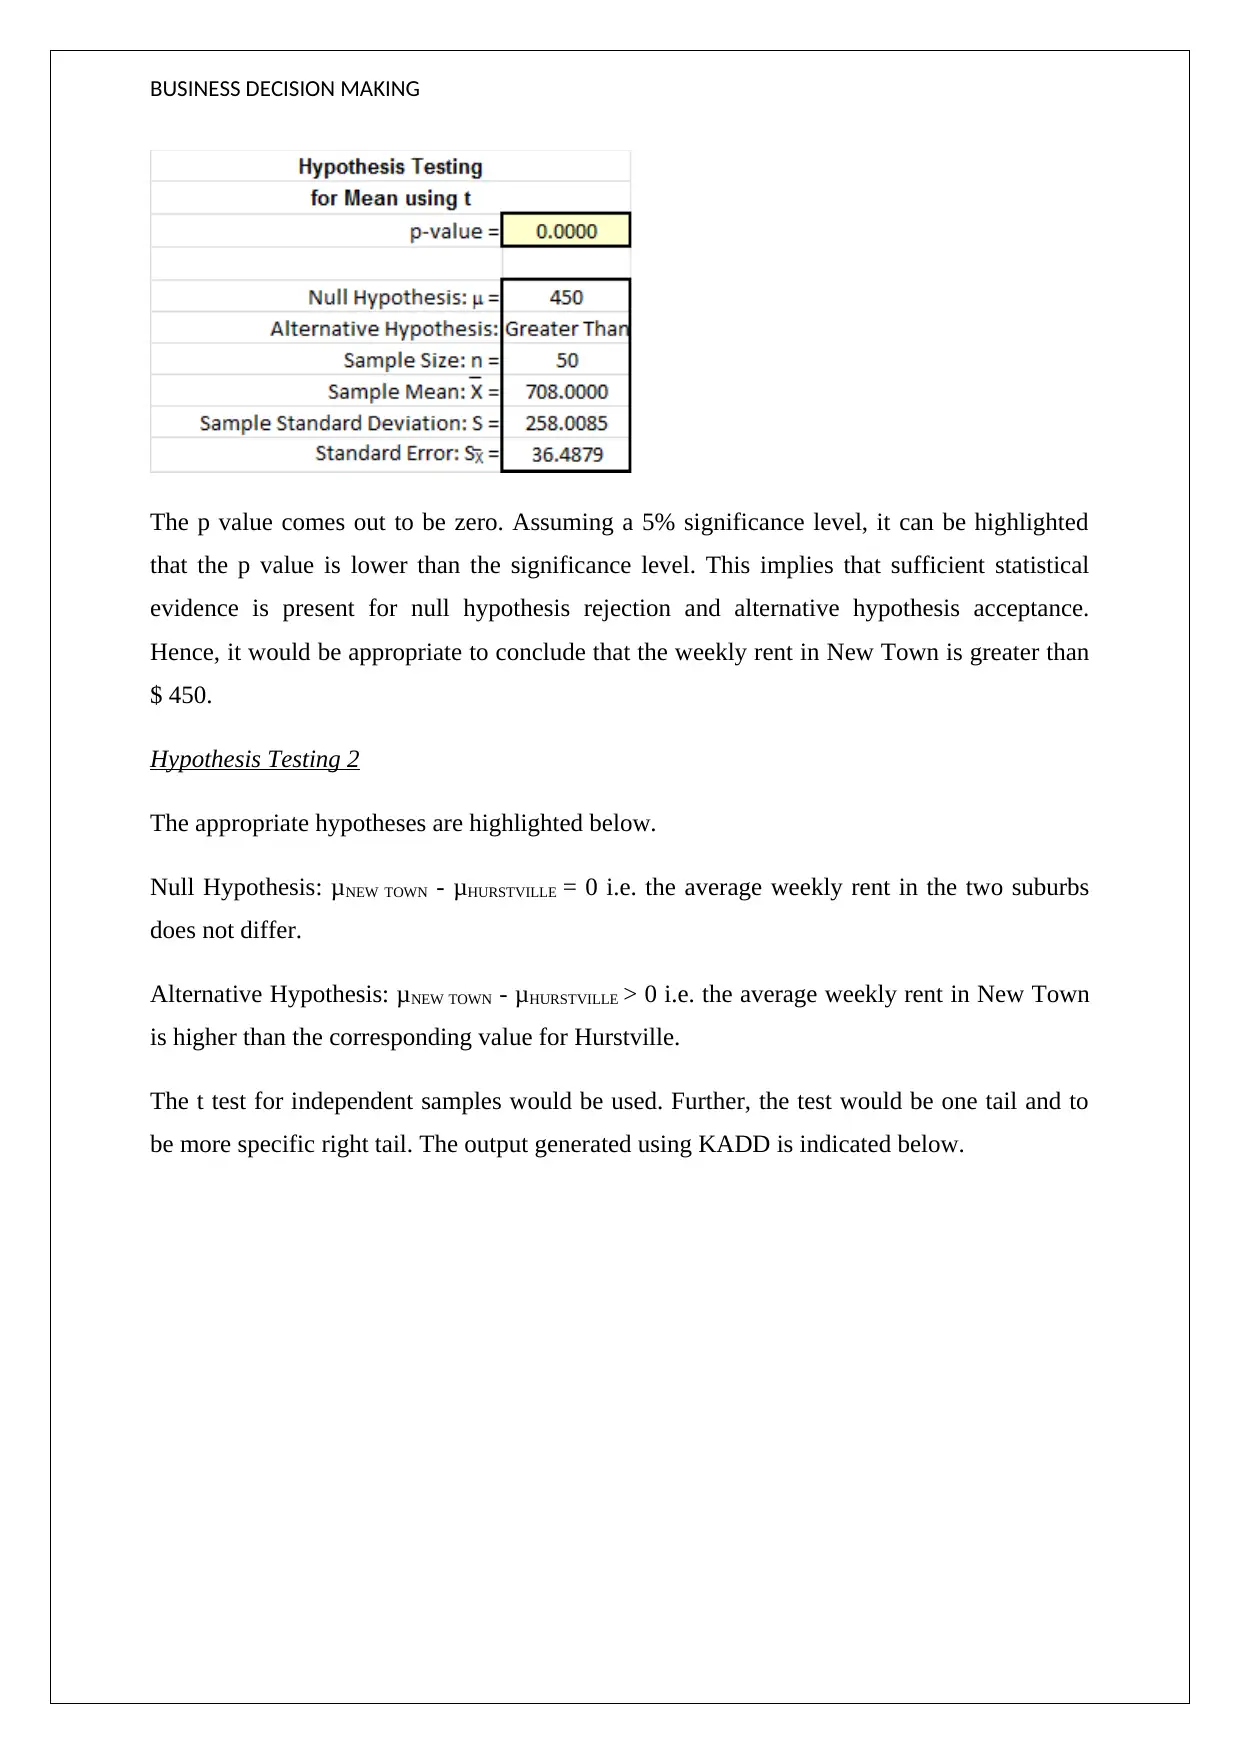
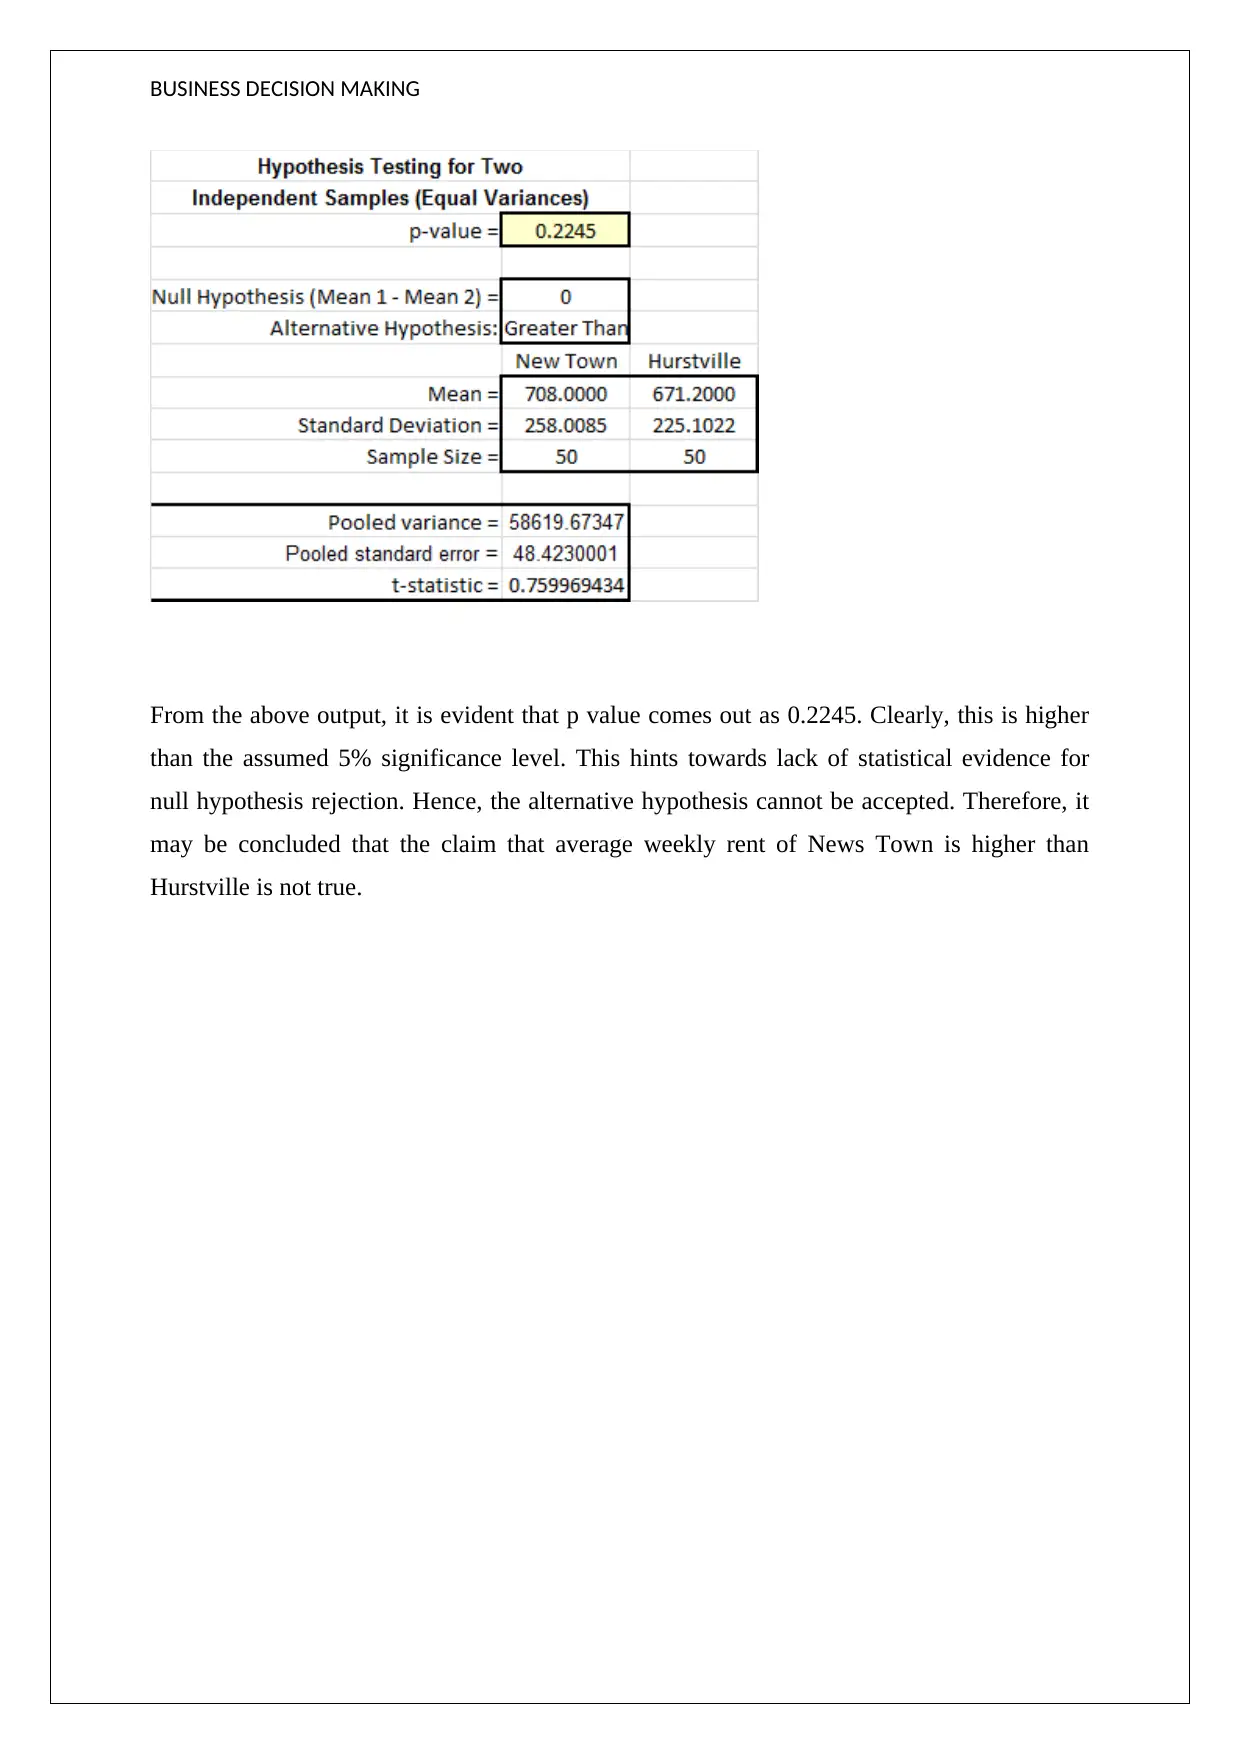
This assignment solution focuses on business decision-making using statistical analysis. The student analyzes survey data from University A, examining GPA distribution, birthday frequency, and child rank to identify patterns and potential biases. Inferential statistics, including z-tests and t-tests, are employed to test hypotheses related to the proportion of rural students and weekly rent comparisons between two suburbs. The solution presents the null and alternative hypotheses, test statistics, p-values, and conclusions drawn from the analysis, providing a comprehensive understanding of statistical techniques applied to business scenarios. The assignment demonstrates the application of hypothesis testing to determine if there is a significant difference in the proportion of rural students and to compare average weekly rent in two different suburbs.
tabler-icon-diamond-filled.svg

Contribute Materials

Your contribution can guide someone’s learning journey. Share your documents today.
Document Page
BUSINESS DECISION MAKING
STUDENT ID:
[Pick the date]
tabler-icon-diamond-filled.svg

Secure Best Marks with AI Grader

Need help grading? Try our AI Grader for instant feedback on your assignments.
Document Page
BUSINESS DECISION MAKING
Question 1
1) The population that University A is interested in refers to all the students who are studying
in Australian campuses. From this particular population, a sample of 300 students has been
drawn for the given survey.
2) The numerical and graphical illustration of the requisite variables is highlighted below.
GPA
Lower
End
Upper
End
Frequenc
y
0.0 1.5 3
1.5 2.0 3
2.0 2.5 18
2.5 3.0 58
3.0 3.5 109
3.5 4.0 83
1.5 2 2.5 3 3.5
0
20
40
60
80
100
120
GPA
Frequency
From the above numerical and graphical display, it is apparent that the distribution of GPA is
not normally distributed as there is presence of skew in the data which is reflected by the tail
on the left side. This indicates towards presence of negative skew and also outliers on the
lower side. Further, the measures of central tendency also seem unequal owing to presence of
skew.
Birthday
Document Page
BUSINESS DECISION MAKING
Birthday Frequency
Monday 42
Tuesday 38
Wednesday 50
Thursday 46
Friday 28
Saturday 40
Sunday 36
Monday Tuesday Wednesday Thursday Friday Saturday Sunday
0
10
20
30
40
50
60
Birthday
Frequency
It is apparent from the above that majority of the students in the sample have their birthday
on Wednesday while the least amount of them have their birthday on Friday. If left to chance,
it would be expected that the representation of each of the days should be equal and as the
sample size becomes higher, it would be expected to see more uniformity in representation of
birthdays.
Childrank
Lower
End
Upper
End
Frequenc
y
1 2 170
Document Page
BUSINESS DECISION MAKING
2 3 67
3 4 27
4 5 13
5 6 2
6 7 1
2 3 4 5 6
0
20
40
60
80
100
120
140
160
180
Childrank
Frequency
It is apparent from the above that the given distribution is non-normal due to the presence of
positive skew or rightward tail. Further, the median and mode of the given variable is 1 which
indicates that the concerned child was the first child of the parents. The high proportion of 1
is understandable from the fact that there is a trend of having few children and hence many
families tend to have only one child.
3) Inferential statistics would be used to test if there has been a decrease in the proportion of
rural students in the survey. The appropriate test statistic would be z considering the size
of the sample where it is approximate to assume that the distribution is normal. Further, a
left tail test would be used.
The relevant hypotheses are as highlighted below.
Null Hypothesis (H0): p=0.2
Alternative hypothesis (HA): p<0.2
The relevant output from Excel generated using KADD is indicated below.
tabler-icon-diamond-filled.svg

Secure Best Marks with AI Grader

Need help grading? Try our AI Grader for instant feedback on your assignments.
Document Page
BUSINESS DECISION MAKING
It is apparent that the p value has come to be 0.0830. Assuming a 5% level of significance, it
is apparent the p value is greater than α which implies that there is lack of evidence to reject
the null hypothesis. Hence, the alternative hypothesis cannot be accepted. Thus, it may be
concluded that the proportion of rural students in the survey this year is not significantly
different from 0.2.
Question 2
The population of interest refers to the weekly rent of the apartments which are located in
Suburb 1 (New Town) and Suburb 2 (Hurstville).
Hypothesis Testing 1
The appropriate hypotheses are highlighted below.
Null Hypothesis: μ≤ $450
Alternative Hypothesis: μ > $ 450
The test statistic to be used would be t considering unknown standard deviation of the
population. The relevant KADD output is indicated below.
Document Page
BUSINESS DECISION MAKING
The p value comes out to be zero. Assuming a 5% significance level, it can be highlighted
that the p value is lower than the significance level. This implies that sufficient statistical
evidence is present for null hypothesis rejection and alternative hypothesis acceptance.
Hence, it would be appropriate to conclude that the weekly rent in New Town is greater than
$ 450.
Hypothesis Testing 2
The appropriate hypotheses are highlighted below.
Null Hypothesis: μNEW TOWN - μHURSTVILLE = 0 i.e. the average weekly rent in the two suburbs
does not differ.
Alternative Hypothesis: μNEW TOWN - μHURSTVILLE > 0 i.e. the average weekly rent in New Town
is higher than the corresponding value for Hurstville.
The t test for independent samples would be used. Further, the test would be one tail and to
be more specific right tail. The output generated using KADD is indicated below.
Document Page
BUSINESS DECISION MAKING
From the above output, it is evident that p value comes out as 0.2245. Clearly, this is higher
than the assumed 5% significance level. This hints towards lack of statistical evidence for
null hypothesis rejection. Hence, the alternative hypothesis cannot be accepted. Therefore, it
may be concluded that the claim that average weekly rent of News Town is higher than
Hurstville is not true.
chevron_up_icon
1 out of 7
circle_padding
hide_on_mobile
zoom_out_icon
logo.png

Your All-in-One AI-Powered Toolkit for Academic Success.

Available 24*7 on WhatsApp / Email

[object Object]