Business Decision Making: Data Analysis and Decision Making Assignment

Verified

Added on  2023/04/11

|11
|647
|147
Homework Assignment
AI Summary
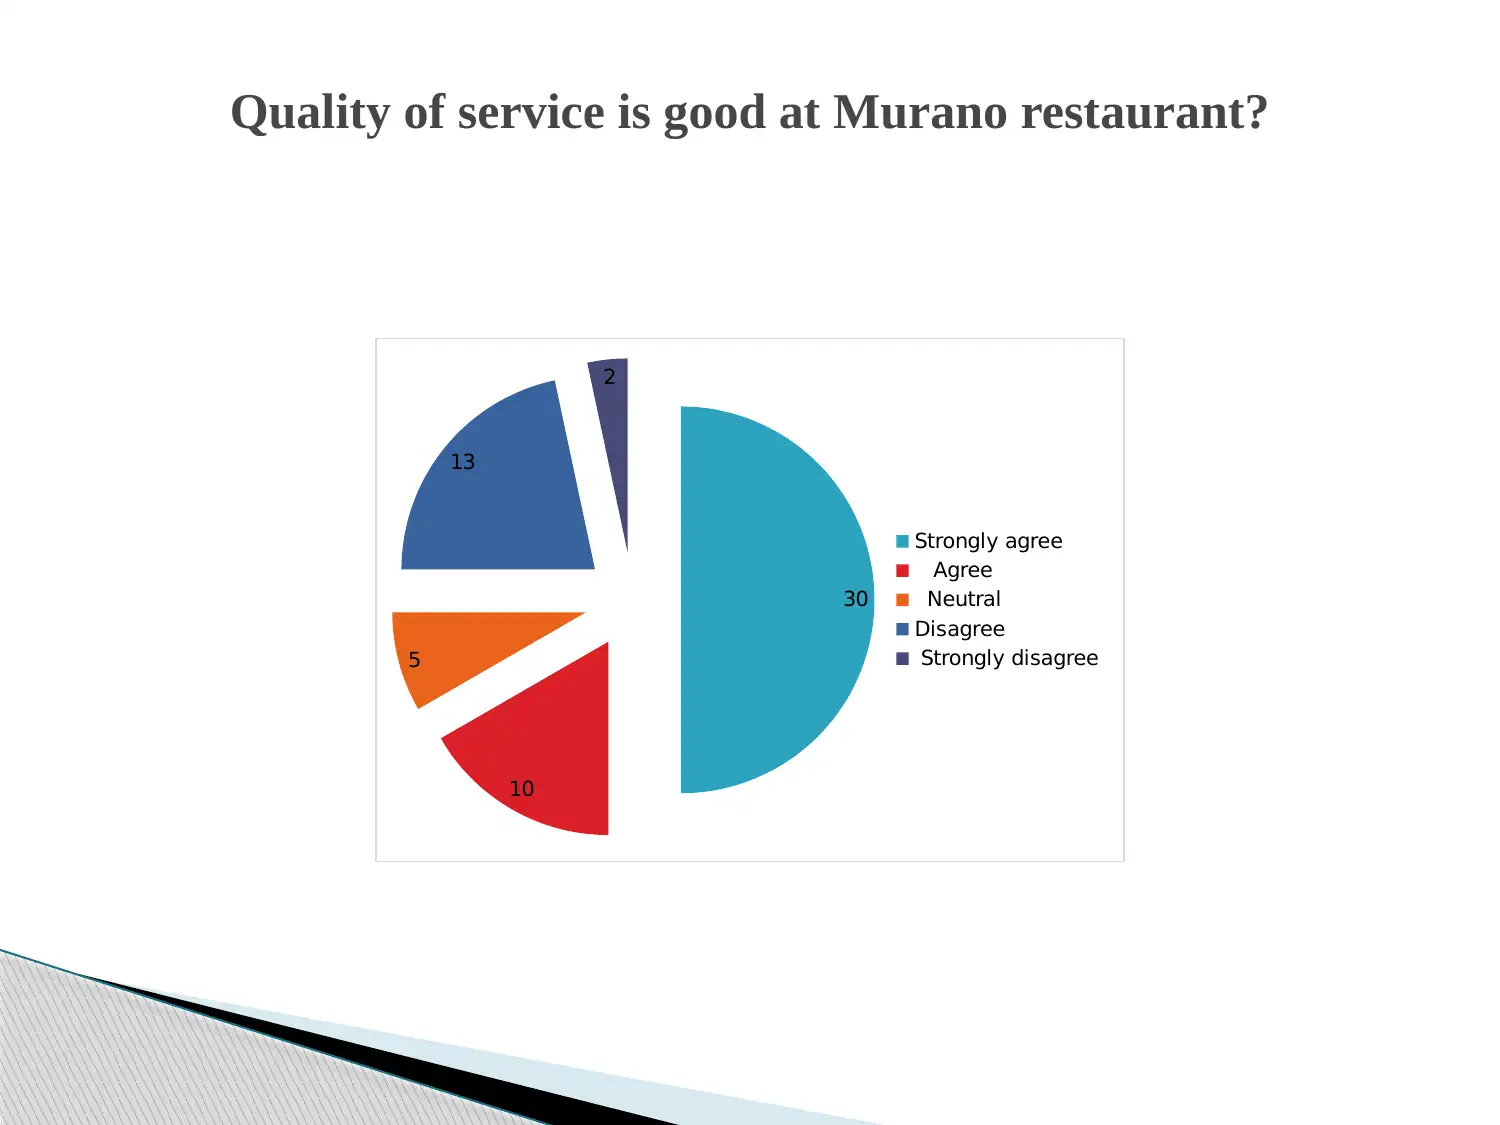
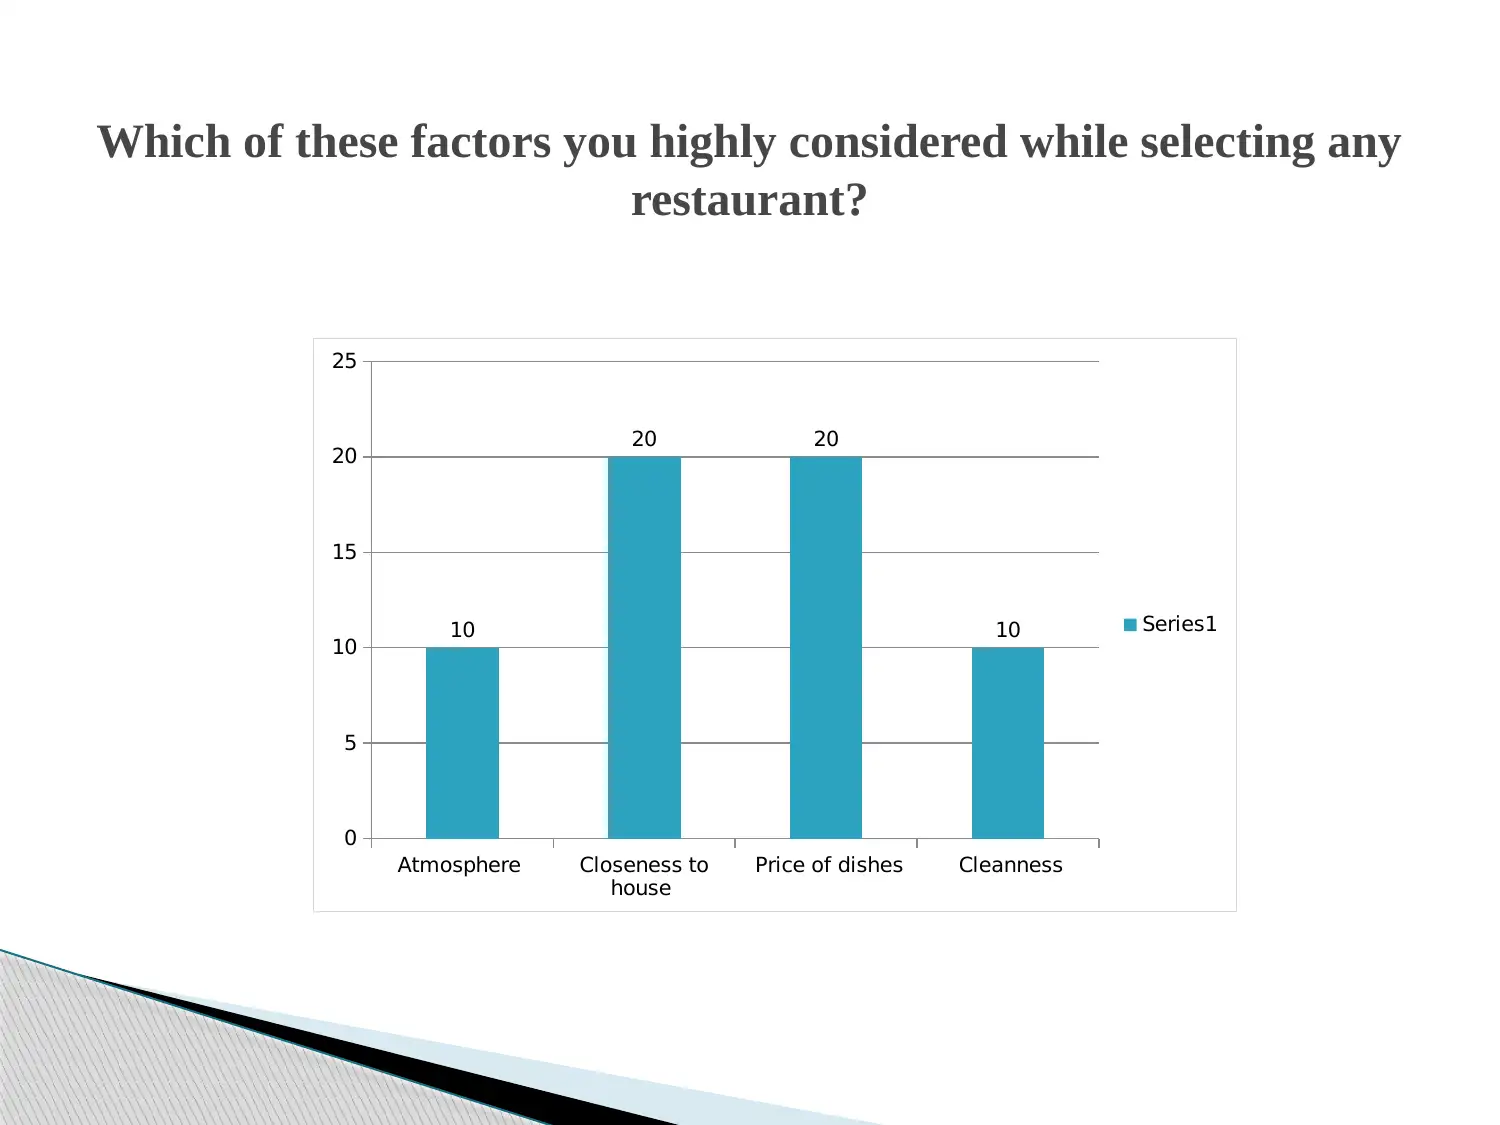
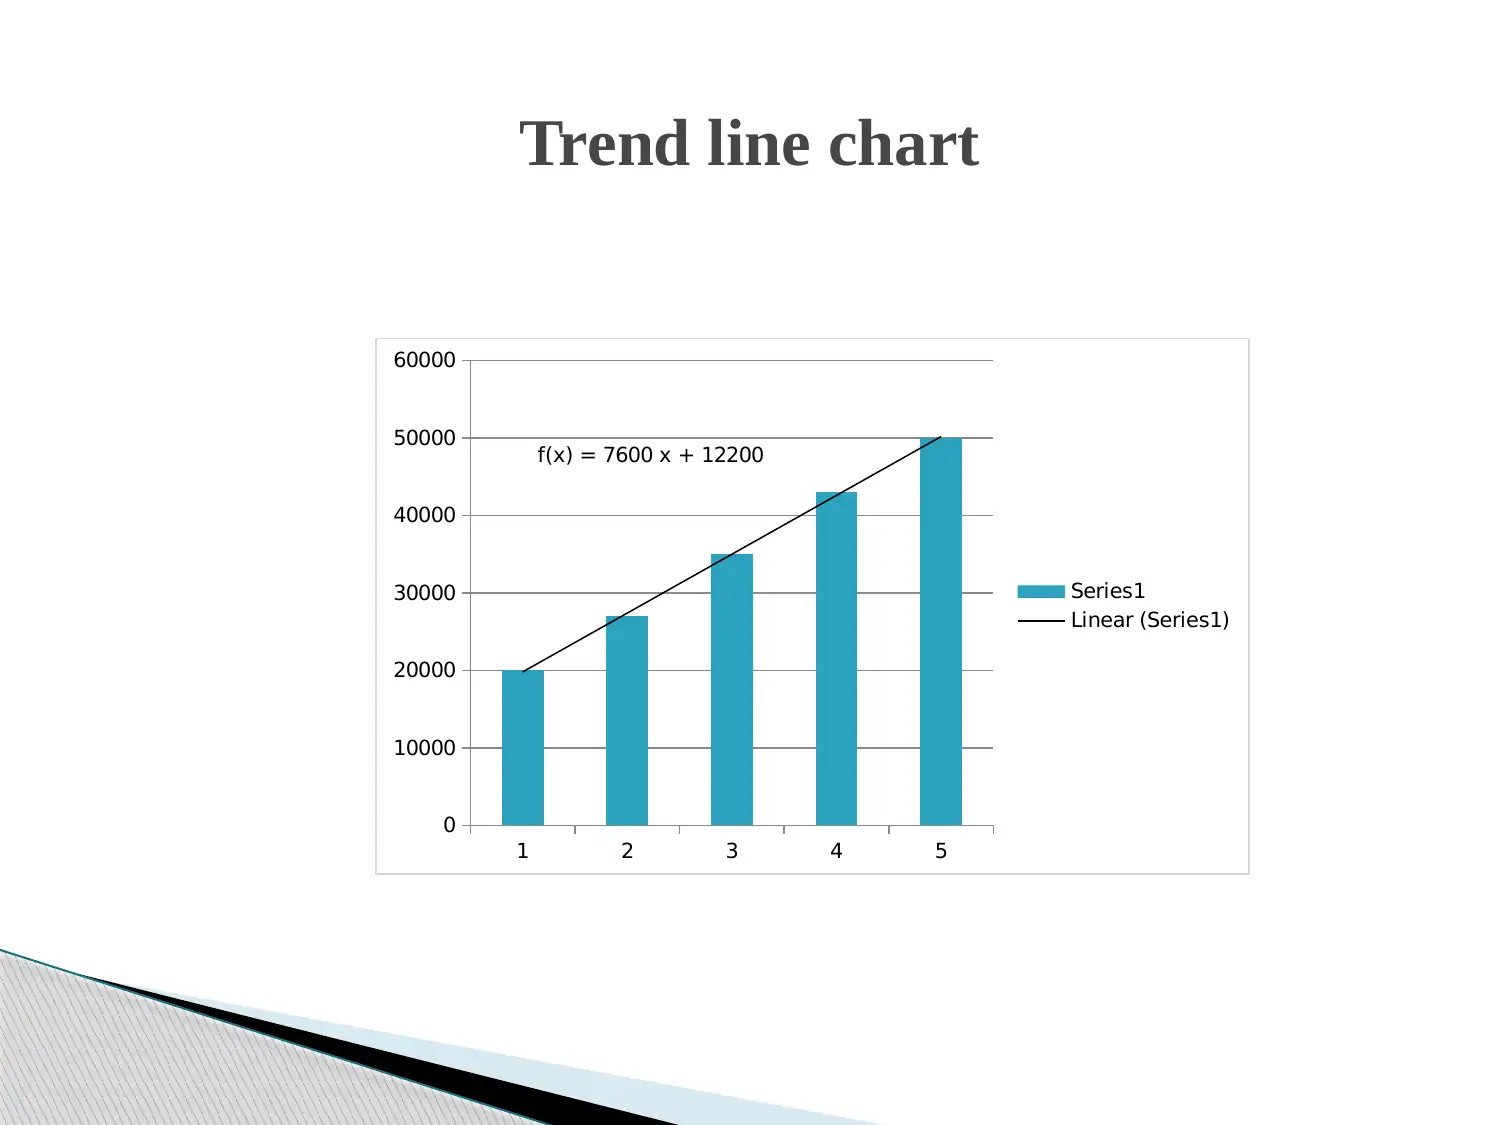
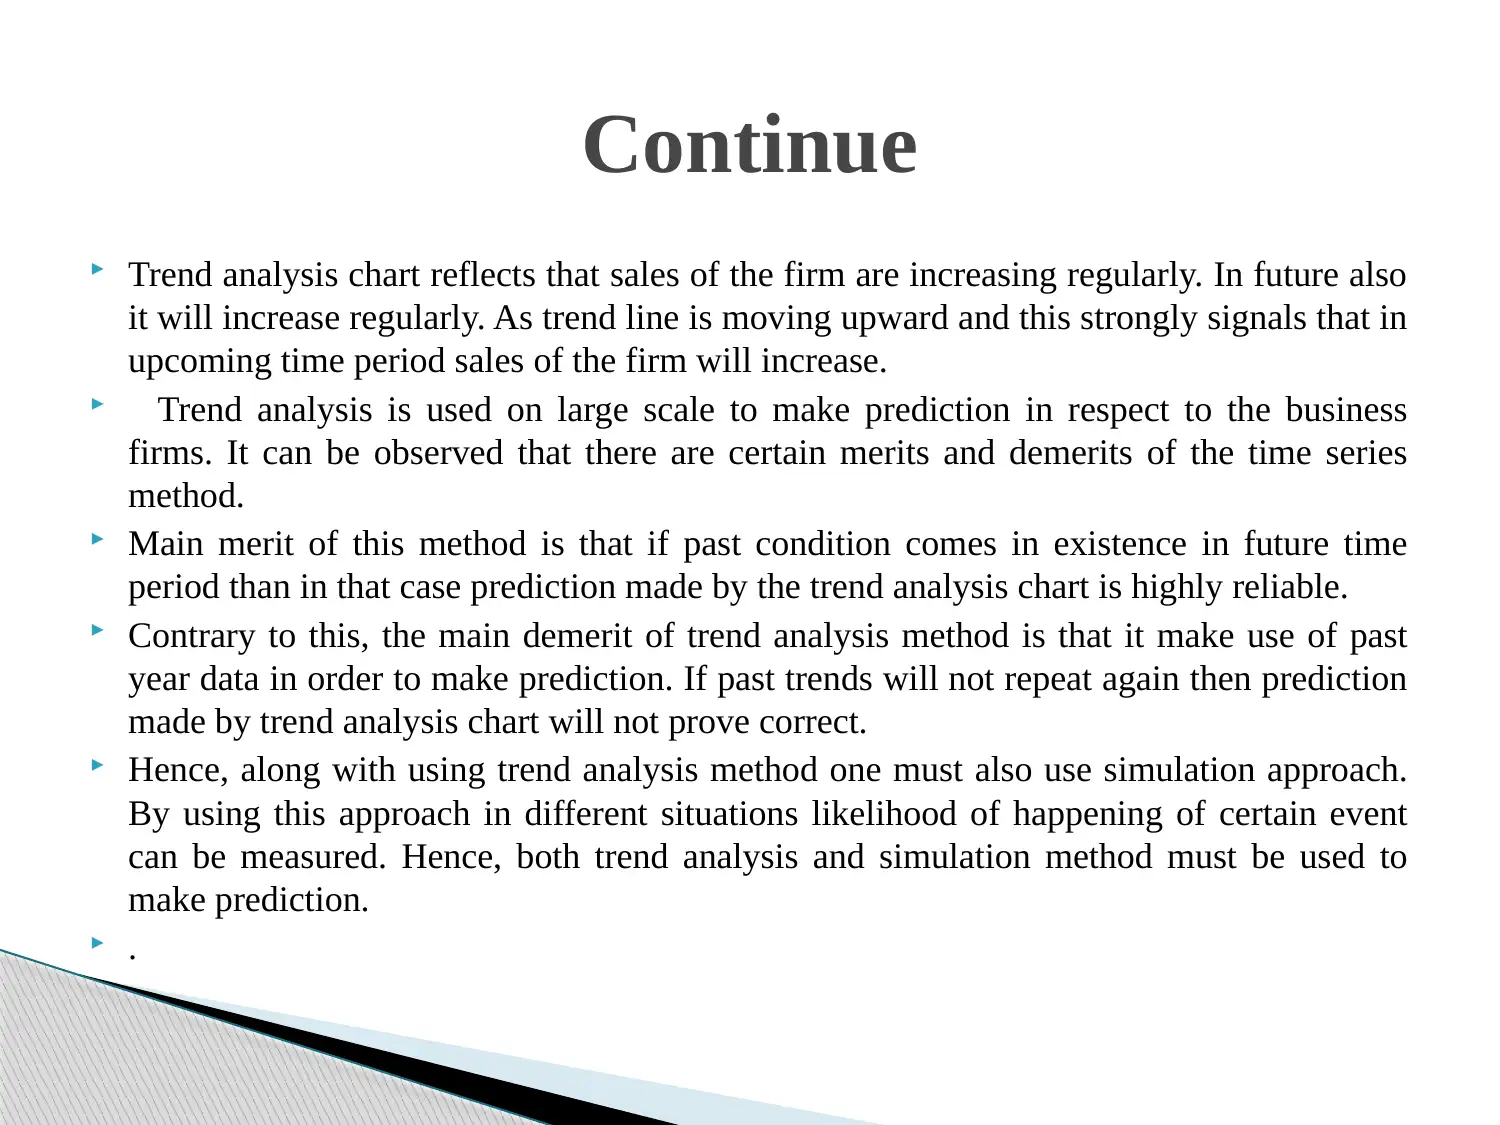
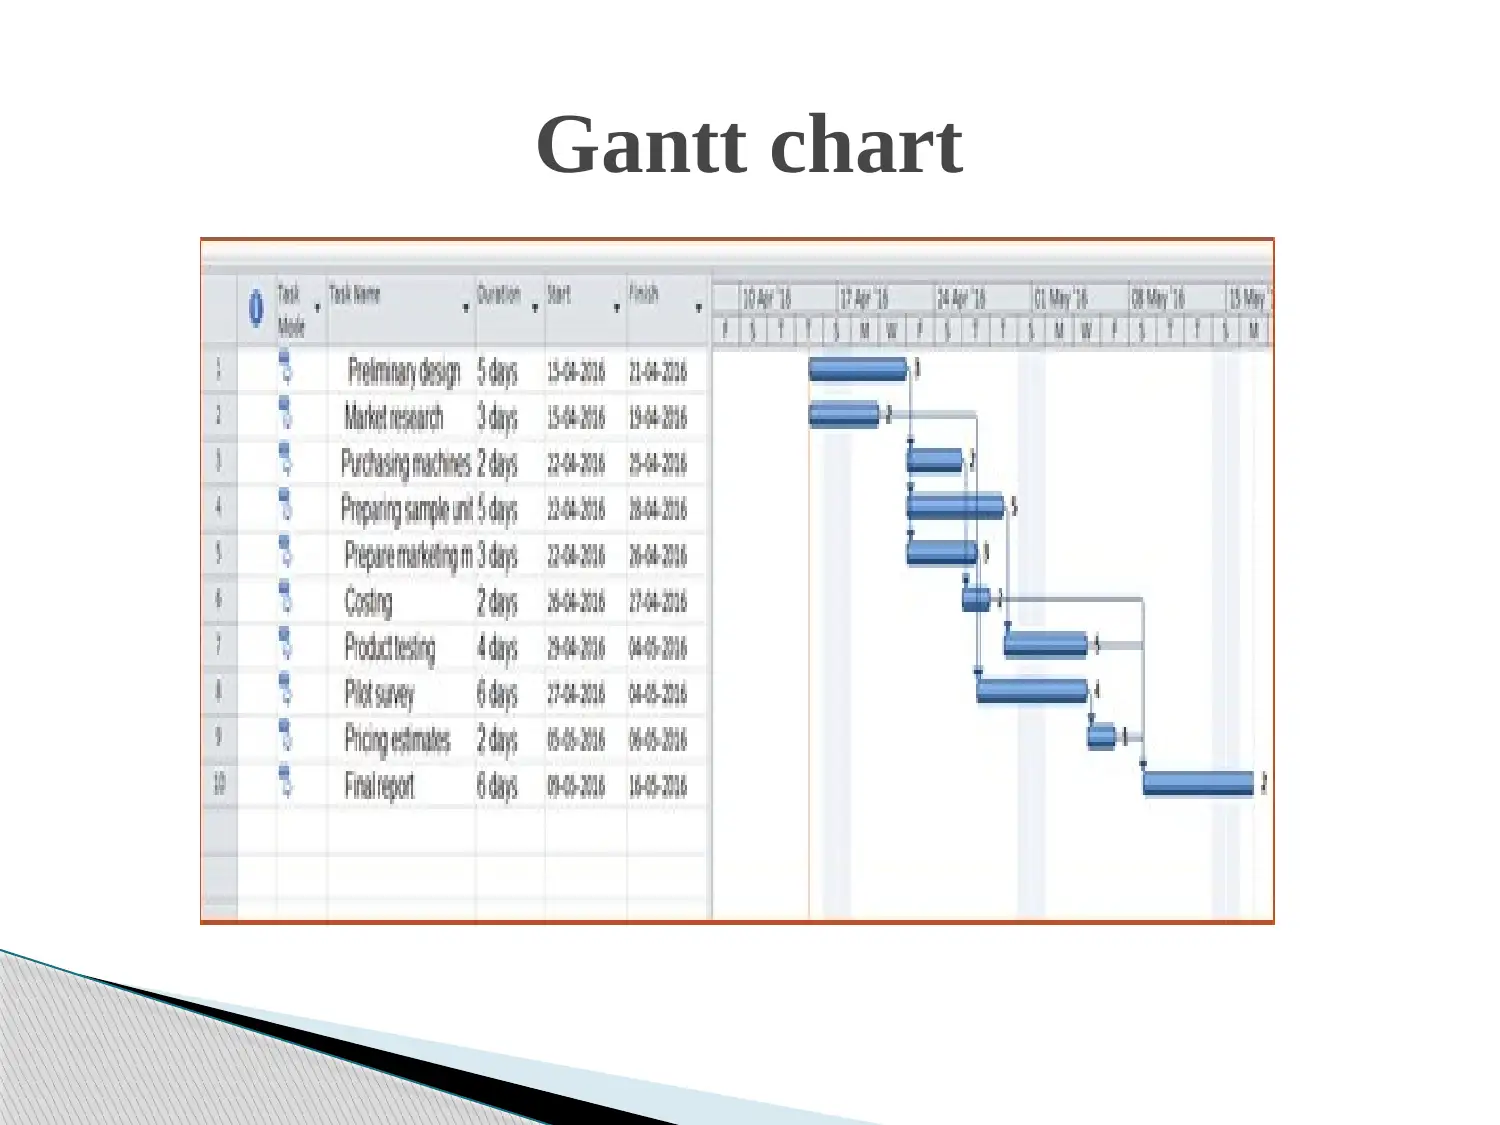
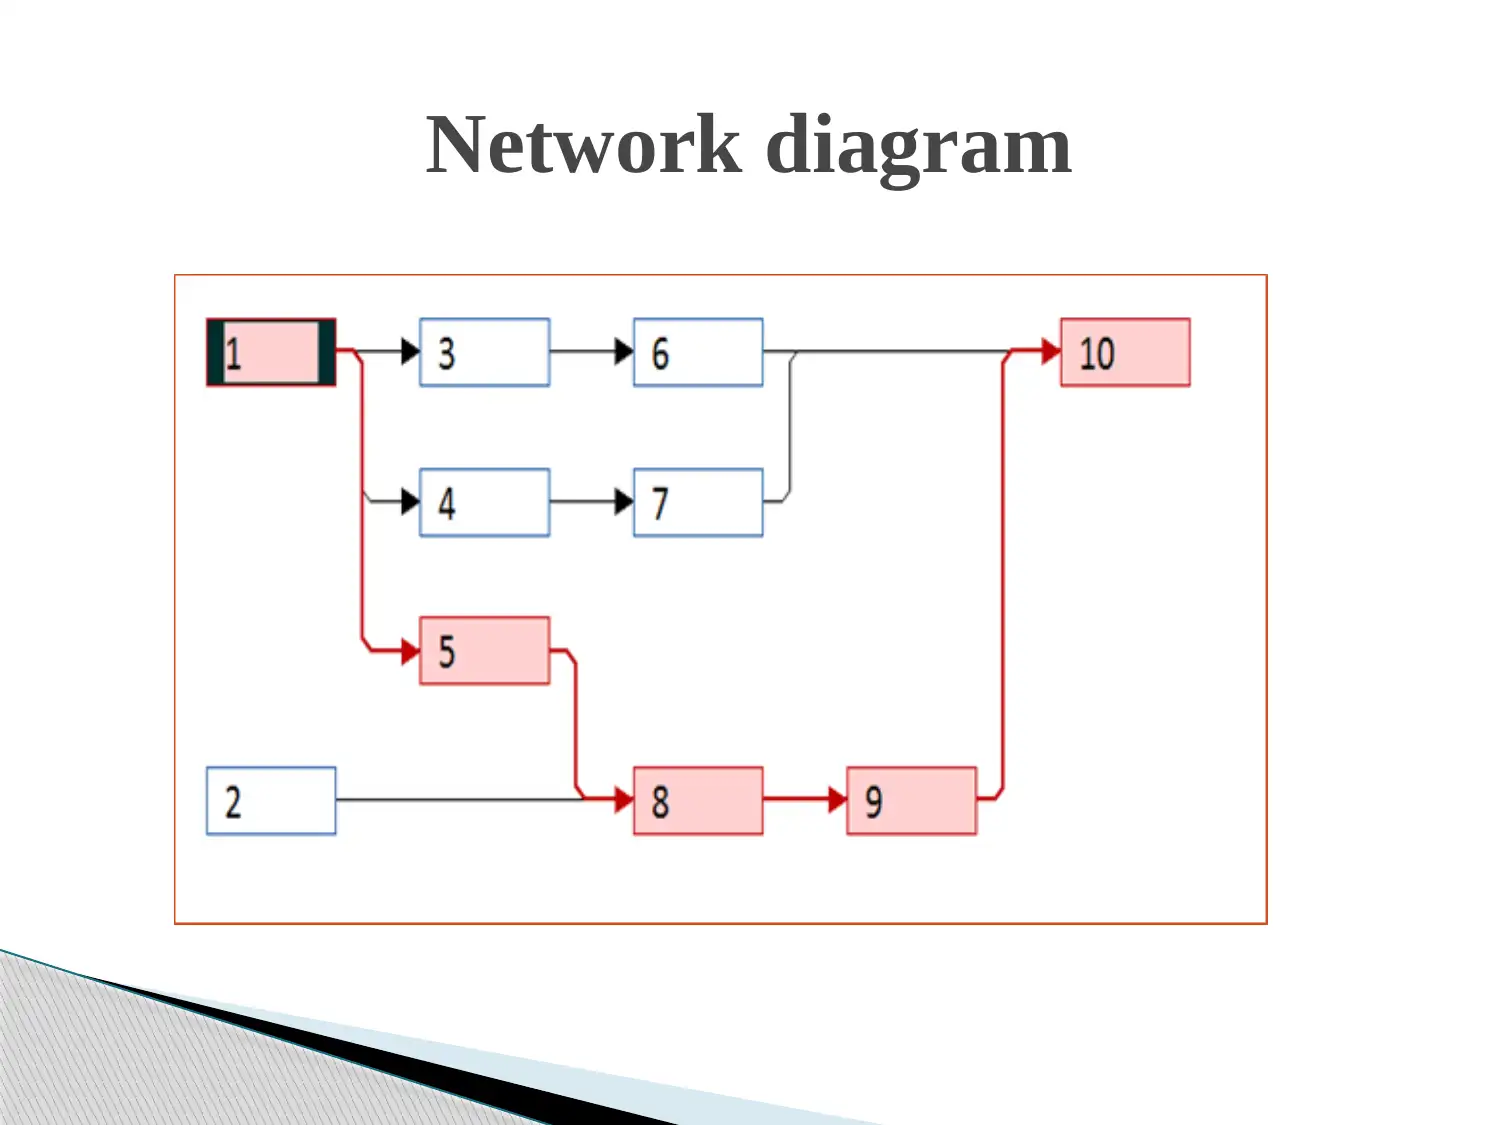
This assignment solution addresses the core concepts of business decision-making, focusing on data collection, analysis, and presentation. It begins with an analysis of survey results regarding customer service quality in a restaurant, using tables to summarize responses and draw conclusions. The assignment then explores factors influencing customer restaurant choices, analyzing data on atmosphere, location, price, and cleanliness. Trend analysis is applied to sales data, with an explanation of its merits and demerits, and the importance of using simulation. Finally, the solution covers project management techniques, including Gantt charts and network diagrams, explaining their role in decision-making, project execution, and cost control. The assignment incorporates references to relevant statistical and business management literature.
Document Page
BUSINESS DECISION
MAKING
tabler-icon-diamond-filled.svg

Paraphrase This Document

Need a fresh take? Get an instant paraphrase of this document with our AI Paraphraser
Document Page
Quality of service is good at Murano restaurant?
30
10
5
13
2
Strongly agree
Agree
Neutral
Disagree
Strongly disagree
Document Page
It can be seen from the table that in respect to
quality of service there are 30 respondents out of 60
who think that firm is providing excellent quality
service to the people. Apart from this, there are 10
respondents who are agreeing on same statement. Apart
from this, there are 5 respondents who are neutral on
same statement. 13 respondents are disagreeing and 2
are strong disagree on same statement. Hence, it can be
said that most of the people have an opinion that good
quality of service is provided to them by the people.
Continue
Document Page
Which of these factors you highly considered while selecting any
restaurant?
Atmosphere Closeness to
house
Price of dishes Cleanness
0
5
10
15
20
25
10
20 20
10 Series1
tabler-icon-diamond-filled.svg

Paraphrase This Document

Need a fresh take? Get an instant paraphrase of this document with our AI Paraphraser
Document Page
It can be seen from the table that there are 10 out of 60 who
think that good atmosphere in the restaurant is the factor that
influence their purchase decisions. There are 20 respondents
who think that closeness to house is the factor that affects their
decision in respect to selection of restaurant. Same number of
people think that it is the price factor that affects their choice
for restaurant. There are only 10 respondents who state that
they give due importance to the clean factor in selection of
any restaurant.
.
Continue
Document Page
Trend line chart
1 2 3 4 5
0
10000
20000
30000
40000
50000
60000
f(x) = 7600 x + 12200
Series1
Linear (Series1)
Document Page
Trend analysis chart reflects that sales of the firm are increasing regularly. In future also
it will increase regularly. As trend line is moving upward and this strongly signals that in
upcoming time period sales of the firm will increase.
Trend analysis is used on large scale to make prediction in respect to the business
firms. It can be observed that there are certain merits and demerits of the time series
method.
Main merit of this method is that if past condition comes in existence in future time
period than in that case prediction made by the trend analysis chart is highly reliable.
Contrary to this, the main demerit of trend analysis method is that it make use of past
year data in order to make prediction. If past trends will not repeat again then prediction
made by trend analysis chart will not prove correct.
Hence, along with using trend analysis method one must also use simulation approach.
By using this approach in different situations likelihood of happening of certain event
can be measured. Hence, both trend analysis and simulation method must be used to
make prediction.
.
Continue
tabler-icon-diamond-filled.svg

Paraphrase This Document

Need a fresh take? Get an instant paraphrase of this document with our AI Paraphraser
Document Page
Gantt chart
Document Page
Network diagram
Document Page
Network diagram is the one of the most important method which is
used by the managers to make business decisions. In this method
the way in which project will be executed is determined. By using
specific approach order of activities is determined in the critical
path method. All activities that are related to project are performed
in the sequence that is reflected by the network diagram.
If project will be performed by following sequence 1+5+8+9+10
then it will be completed at minimum cost and on time. Contrary to
this, if sequence that is revealed in the chart will not be followed
then project cost will increase at rapid pace. In present case order
of tasks of project will be 1+5+8+9+10 and it means that which
means that project will be executed in the 22 days.
Continue
tabler-icon-diamond-filled.svg

Paraphrase This Document

Need a fresh take? Get an instant paraphrase of this document with our AI Paraphraser
Document Page
Cramér, H., 2016. Mathematical Methods of Statistics.
Princeton university press.
Anderberg, M.R., 2014. Cluster analysis for
applications: probability and mathematical statistics: a
series of monographs and textbooks. Academic press.
Mardia, K.V., 2014. Statistics of directional data.
Academic press.
REFERENCES
chevron_up_icon
1 out of 11
circle_padding
hide_on_mobile
zoom_out_icon
[object Object]