Business Decision Making Report: Data Analysis for Blackfriars
VerifiedAdded on 2020/01/07
|31
|4156
|150
Report
AI Summary
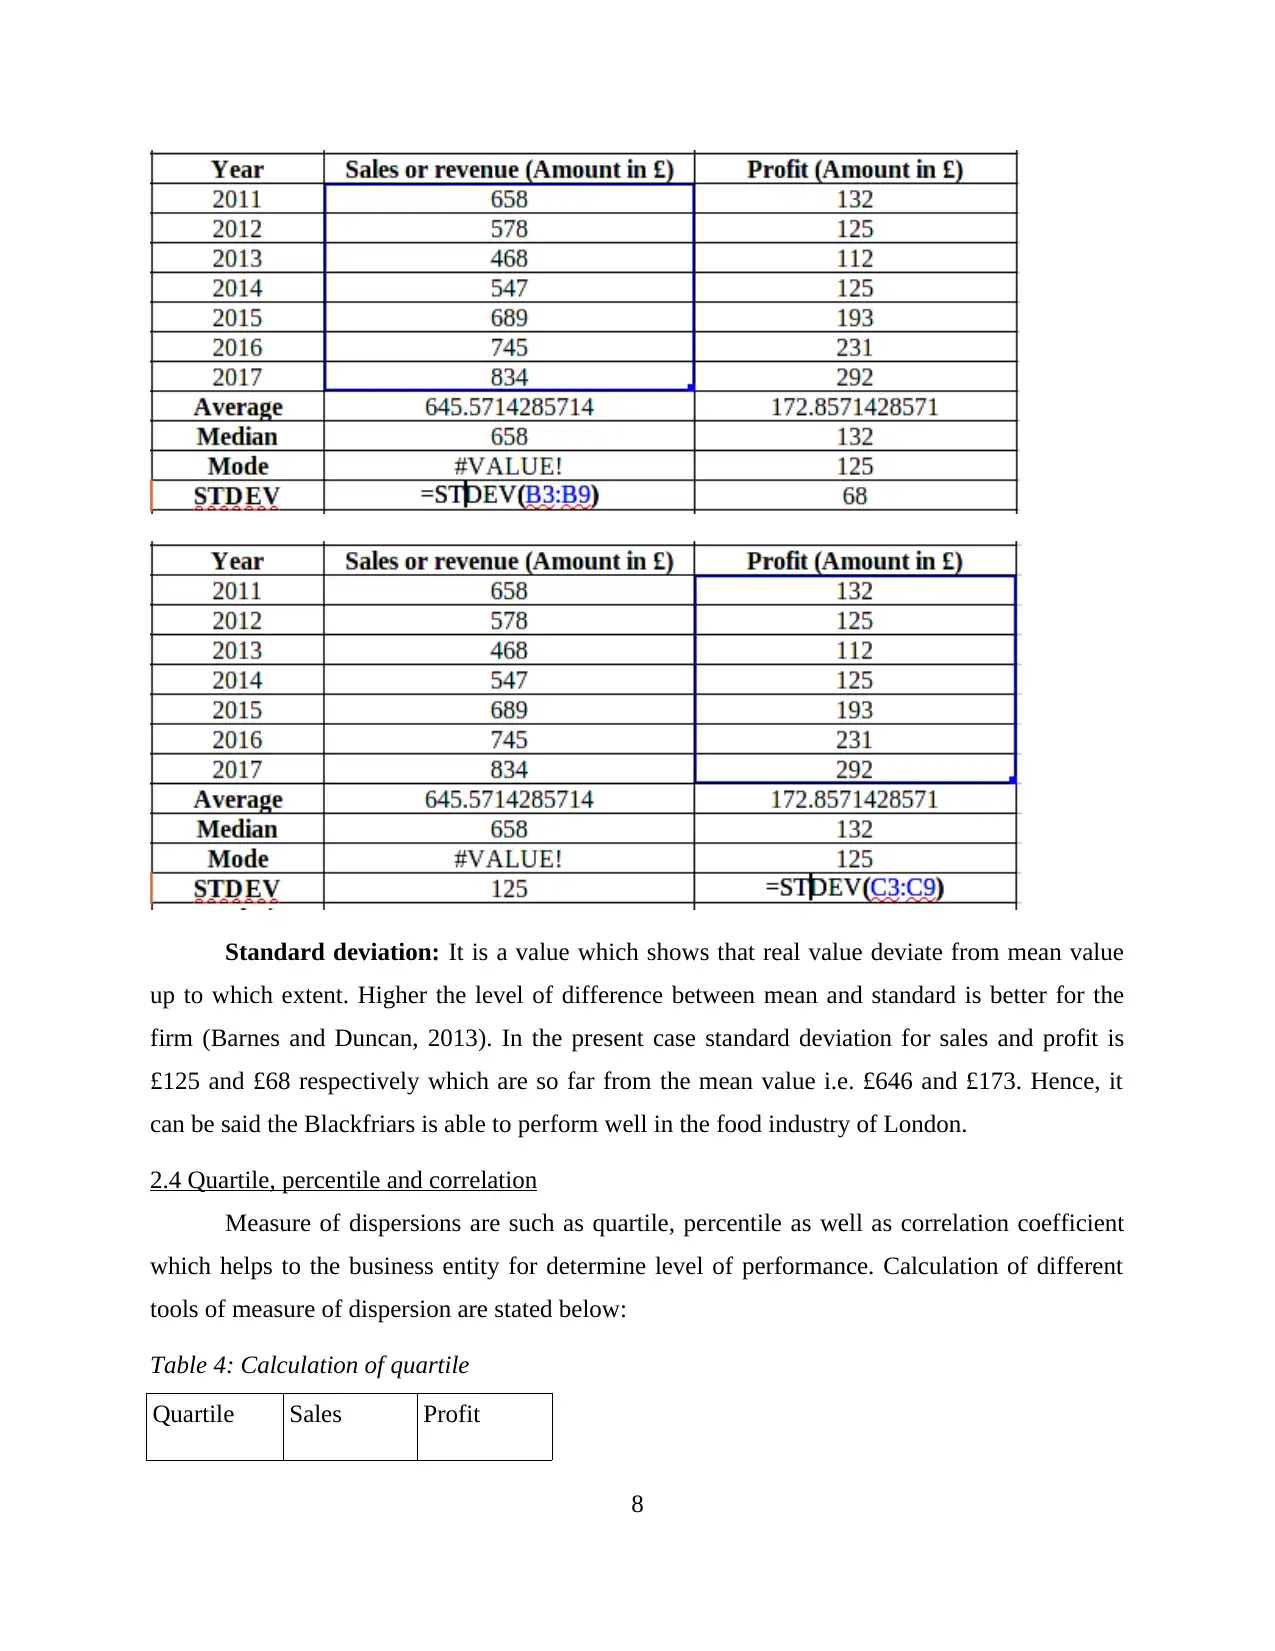
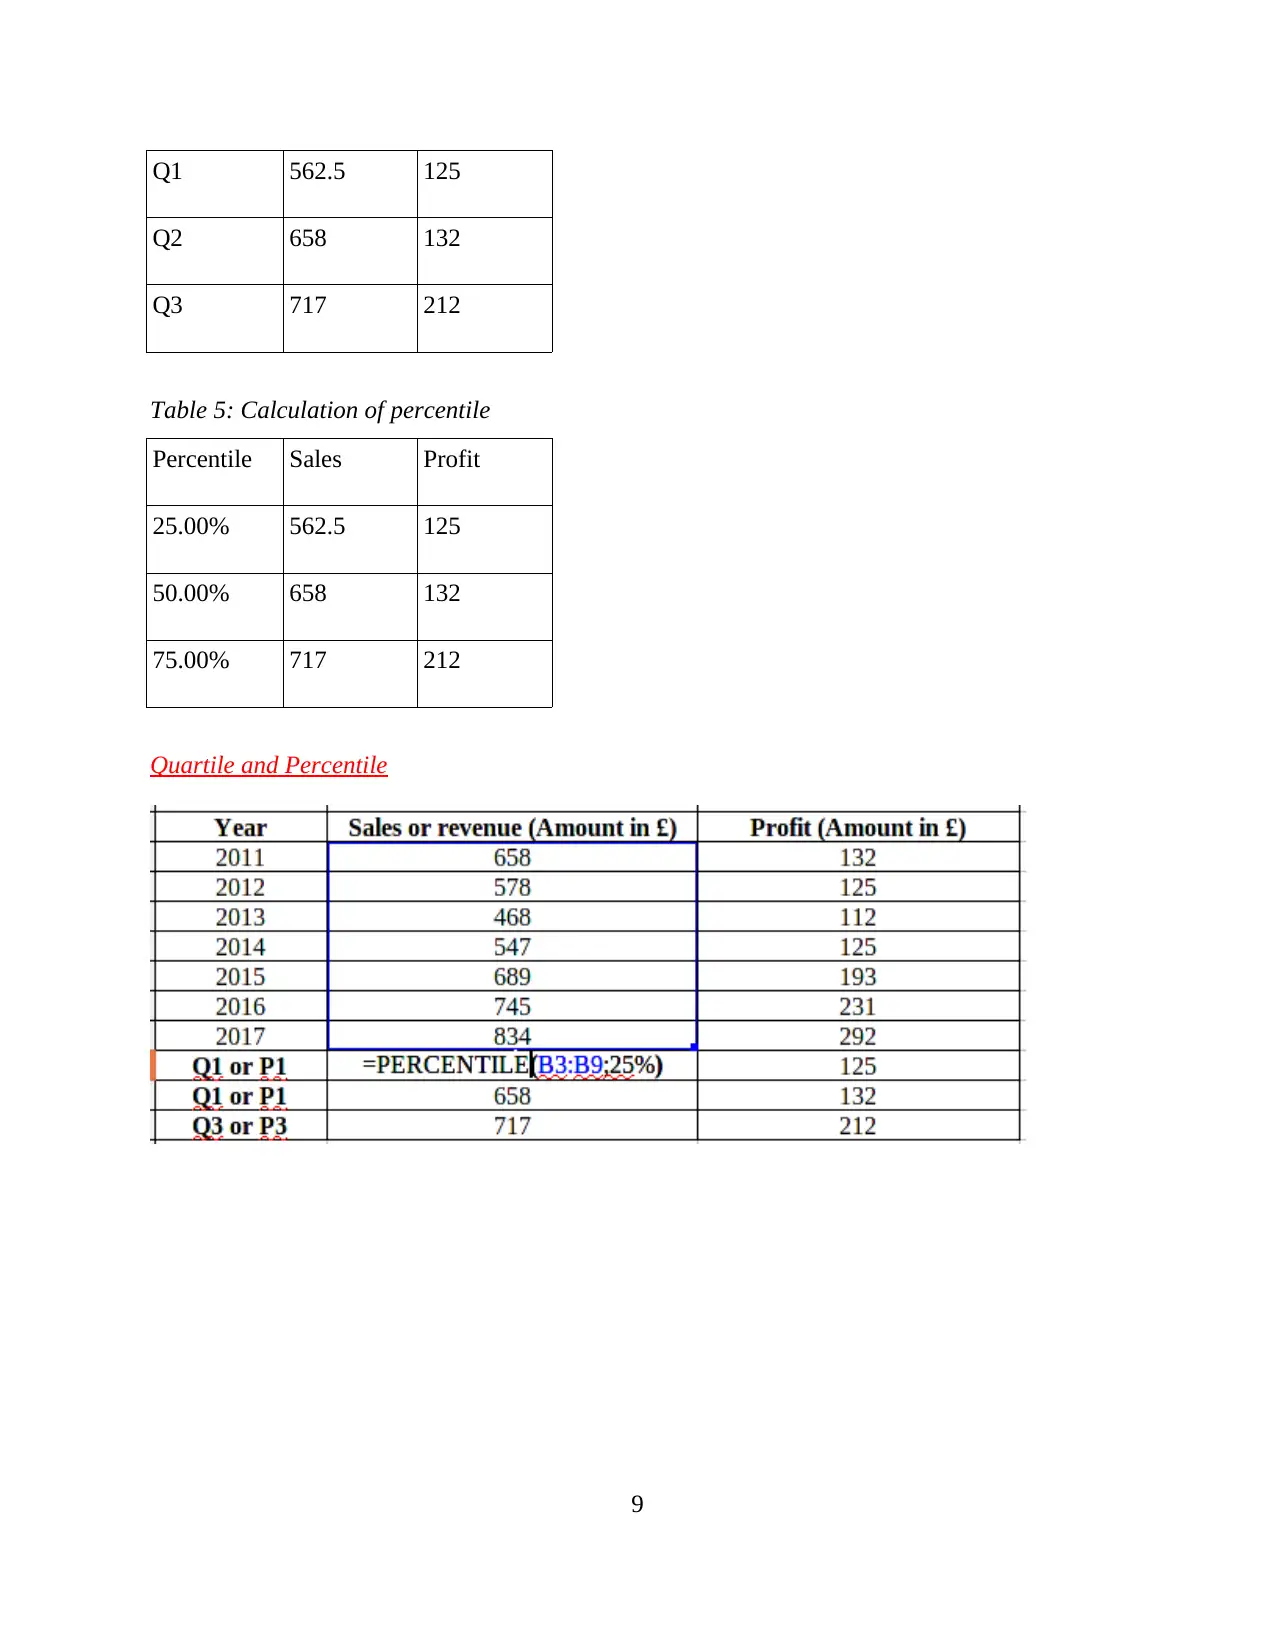
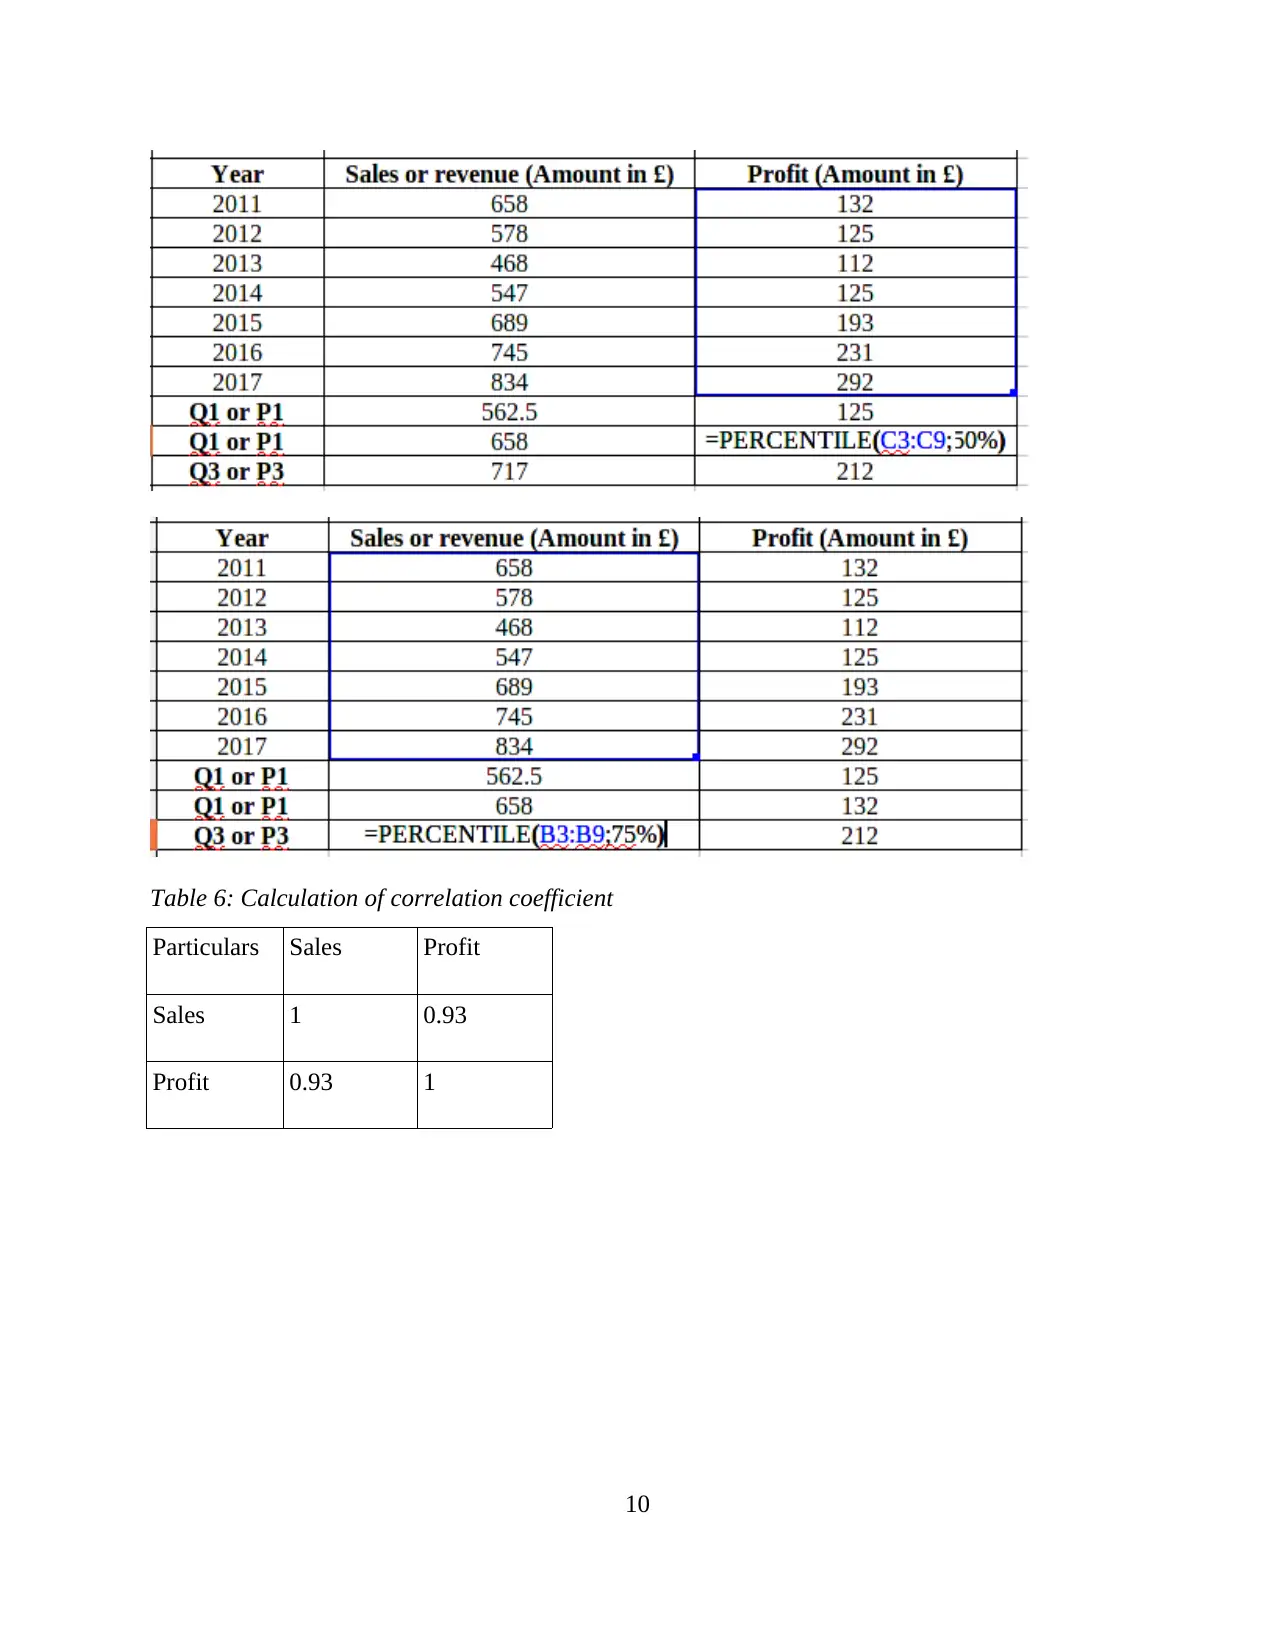
This report analyzes the business decision-making process for Blackfriars Restaurant in London, which is planning to open a new branch. The report details the methods for collecting primary and secondary data, emphasizing the use of questionnaires and annual reports. It explores various statistical tools such as mean, median, mode, standard deviation, correlation, quartiles, and percentiles to analyze financial data (sales and profit) from 2011 to 2017. The analysis includes graphical representations like column graphs and pie charts to visualize the data. The report also includes a questionnaire design and discusses sampling techniques, concluding with an assessment of the restaurant's performance and recommendations for its expansion.
Contribute Materials
Your contribution can guide someone’s learning journey. Share your
documents today.

BUSINESS DECISION
MAKING
MAKING
Secure Best Marks with AI Grader
Need help grading? Try our AI Grader for instant feedback on your assignments.


INTRODUCTION
Decisions plays a very significant role in every kind of business entities which helps to
make the firm more profitable by taking appropriate decisions. The current study is based on a
Blackfriars Restaurant which is operating in London and going to open a new branch. The report
focuses on plan that how to collect primary as well as secondary data for research. It shows
various statistical tools and method which helps to take effective business decisions and draw a
reliable conclusion. Moreover, it describes about graphical representation, financial tools as well
as critical plan to complete a project in the proper manner on or before time.
TASK 1
1.1 Plan for collecting primary and secondary data
Data is a most essential part of the any research project where data should be more useful
and specific. Make sure data should be more specific and reliable. Data collection is way to
generating information through the different different source. Data collection is technical way to
gathering information. In any research project research main role is collect relevant data from the
suitable source. Data gathering is away to provide information for the related topic. Data
collection have a various source. In order to collect data there is two specific way to gathering g
information. One is primary data where information generate by the questionnaire and books and
journals (Jankowicz, 2005). As per this report in data generate through the questionnaire forms.
Which are very useful for the research report which the help of primary question data company
generate information about the current market problems. On the other hand secondary data is
way to generating information through the secondary source of the data collection where
information is old which means information is investigated n earlier time and now we use those
data in present report. Primary data is first handed data where information through the online
questionnaire. Company fill online questionnaire from the respected public in the current market.
Furthermore, secondary data is to be generated by the investigators which the help of annual
report of the company.
1.2 Presenting survey methodology as well as used sampling technique
There are various type of sampling methods which are useful to data collections .
Survey methodology- in this sampling method survey is to be done on the basis of
questionnaire where the researcher use online method . In this questionnaire are distributed
1

through online way where this method is useful to reduce time and increase efficiency (Little,
2011).
Convenience sampling method : in this sampling method data should be in generate via
easily. Most of the researcher are used convenience data methodology because this method of
data collection is very easy and understandable by the researcher.
Sample random sampling method: simple random sampling method is a very easy
method from all over the above methods of sampling. In this research Blackfriars restaurant use
simple random sampling methods where they easy generate information. In this sampling
method there is no parameter used. This method is free and randomly determine.
As per the current research report we can use 30 sample size of sampling where used
simple Brandon sampling methodology. In this research report research used online
questionnaire forms for generating authentic information (Nicholson and Aman, 2012).
1.3 Questionnaire for research
2
Secure Best Marks with AI Grader
Need help grading? Try our AI Grader for instant feedback on your assignments.

Questionnaire
Demographic information
Name ________________
Gender _______________
Age __________________
Que. 1. How often do you visit to restaurant for taking food ?
Daily
Once in a week
Once in a month
Rarely
Que. 2. Do you think that, Blackfriars restaurant provides high quality of food items ?
Yes
No
Que. 3. Which factor do you consider while taking food from Blackfriars restaurant ?
Quality of food
Service
Location
Prices
Que. 4. Do you agree that, Blackfriars satisfy your requirements related to food ?
Strongly agree
Agree
Neutral
Disagree
3

Strongly disagree
Que. 5. Do you think that, price level of food products in Blackfriars restaurant are effective ?
Yes
No
Que. 6. From the following marketing strategies, which strategy affects your buying
behaviour ?
Social media
Word of mouth
Newspapers
Promotional activities
Que. 7. Are you satisfy that, services provided by personnels of Blackfriars restaurant are
better ?
Highly satisfy
Satisfy
Neutral
Dissatisfy
Highly dissatisfy
Que. 8. Do you think that, food products of Blackfriars have higher nutritions as compare to its
rivalry restaurants ?
Yes
No
Que. 9. Is there marketing strategy used by Blackfriars is impact on your buying behaviour ?
Yes
No
4

Que. 10. Please provide your valuable feedbacks and suggestions
________________________________________________
TASK 2
2.1 Summarizing collected data
For analysing and research on the company there are different informations and data are
required. The data are collected with the help of primary as well as secondary sources and used
to analyse regarding business problems. In the present scenario raw data are collected from
annual report of the company such as Blackfriars restaurant (Arnicans, 2013). There are mainly
two kinds of financial data are derived and summarized which are like as sales or revenue and
profit from the FY 2011 to 2017. Further, respective raw data are summarized as below:
Table 1: Raw data for calculation
Year Sales or revenue (Amount in £) Profit (Amount in £)
2011 658 132
2012 578 125
2013 468 112
2014 547 125
2015 689 193
2016 745 231
2017 834 292
The above mentioned table shows collected raw data for researching of Blackfriars
restaurant and make valid conclusions. Here revenue generated by the restaurant as well as profit
level is to determine from the accounting year 2011 to 2017. With the statistical tools such as
mean, median and mode the represented raw data are calculated.
5
Paraphrase This Document
Need a fresh take? Get an instant paraphrase of this document with our AI Paraphraser

2.2 Calculations of mean, median and mode
In the business entity data and analysed using various techniques such as thematic,
statistical, mathematical tools etc. In the present case, various kinds of statistical tools and
techniques are used such as mean, median as well as mode which are calculated as below:
Table 2: Calculation of mean, median and mode
Sales Profit
Mean 646 173
Median 658 132
Mode 0 125
Mean or Average
Median
Mode
6

Mean: The tool which helps to the scholar in order to determine average value of the
whole data set is known as mean. When the Blackfriars restaurant wants to know average
value of the sales and profit then mean is the best tool. In the present case value of mean
for sales and profit is £646 and £173 respectively (Arnold, 2015). On the basis of such
outcomes it can be determined that performance of the firm is well. Median: As per the statistical tool, researcher able to know middle value of whole data
set and can draw a valid interpretation. Further, it helps to divide overall data into two
equal parts when there are huge data in firm. Here middle value of revenue and profit is
£658 and £132 which shows that before FY 2015 performance of the firm is poor. After
the middle value level sales and profit both are consistently increases.
Mode: By using the mean tool management of Blackfriars easily able to know that which
data is often occurs in business process. In the current study, sales is not repeated in any
year but on the other side profit worth of £125 is repeated in year 2014.
2.3 Computation of standard deviation
Table 3: Calculation of standard deviation
Sales Profit
Standard deviation 125 68
Standard Deviation
7

Standard deviation: It is a value which shows that real value deviate from mean value
up to which extent. Higher the level of difference between mean and standard is better for the
firm (Barnes and Duncan, 2013). In the present case standard deviation for sales and profit is
£125 and £68 respectively which are so far from the mean value i.e. £646 and £173. Hence, it
can be said the Blackfriars is able to perform well in the food industry of London.
2.4 Quartile, percentile and correlation
Measure of dispersions are such as quartile, percentile as well as correlation coefficient
which helps to the business entity for determine level of performance. Calculation of different
tools of measure of dispersion are stated below:
Table 4: Calculation of quartile
Quartile Sales Profit
8
Secure Best Marks with AI Grader
Need help grading? Try our AI Grader for instant feedback on your assignments.

Q1 562.5 125
Q2 658 132
Q3 717 212
Table 5: Calculation of percentile
Percentile Sales Profit
25.00% 562.5 125
50.00% 658 132
75.00% 717 212
Quartile and Percentile
9
Q2 658 132
Q3 717 212
Table 5: Calculation of percentile
Percentile Sales Profit
25.00% 562.5 125
50.00% 658 132
75.00% 717 212
Quartile and Percentile
9

Table 6: Calculation of correlation coefficient
Particulars Sales Profit
Sales 1 0.93
Profit 0.93 1
10
Particulars Sales Profit
Sales 1 0.93
Profit 0.93 1
10

Quartile: The tool by which scholar able to divide whole data set in four parts in equal
manner. There are three levels of quartile are calculated which are denotes with Q1, Q2
and Q3. At every level value of quartile increase which indicates that performance of the
Blackfriars is better in the industry (Measures of Central Tendency and Dispersion.
2013). Value of Q1, Q2 as well as Q3 is worth of £125, £132 and £212 respectively and
as level increase the value also raises in the firm.
Correlation coefficient: Another measure of dispersion is correlation coefficient which
shows that relationship between two interrelated variables is whether in positive direction
or negative. Value of the correlation is always between -1 to +1. In the present case
correlation between sales and profit is 0.93 which shows that there are very strong
relations among both the variables in Blackfriars restaurant. Hence, it can be said that if
sales will increase then it will impact on the level of profit in same direction (Hohna and
et.al., 2014).
Conclusion-
It can be concluded from all the above calculations using statistical tools that, Blackfriars
restaurant having effective and better performance in the food industry and due to which it seems
highly feasible. The chosen entity is going to establish another outlet or store and due to which
financial condition must be high and of the enhancing trend. Moreover, as per the measure of
central tendency it can be said that it able to meet with all the values and perfomring well as
compare to the average value. On the basis of quartile or percentile data and information it can
11
Paraphrase This Document
Need a fresh take? Get an instant paraphrase of this document with our AI Paraphraser

be said that at each and every level values improving continuously. At the end when looking at
the value of correlation then sales and profit both have highly positive relations and affect in
same direction to each other. Hence, it can be discussed and ascertained that Blackfriars
restaurant performing well within food industry.
TASK 3
3.1 Graphical representation of data
Graphs and diagrams are prepared by using various data which helps to make better and
valid interpretations. Here on the basis of sales and profit of Blackfriars restaurant column graph
as well as pie chart are prepared which are such as follows:
Data for representing graphs
Year Sales or revenue (Amount in £) Profit (Amount in £)
2011 658 132
2012 578 125
2013 468 112
2014 547 125
2015 689 193
2016 745 231
2017 834 292
Pie chart for sales
12

658
578
468
547 689
745
834
Illustration 1: Pie chart for sales
Column graph for sales
2011 2012 2013 2014 2015 2016 2017
0
100
200
300
400
500
600
700
800
900
658
578
468
547
689
745
834
Illustration 2: Column chart for sales
Interpretation
From the above chart it can be interpreted that sales or revenue of Blackfriars restaurant
is decreases from the year 2011 to 2013 from £658 to £468. It shows that the firm is not able to
sale its products and services in the market. Afterwards level of sales start to increase from £468
and reaches up to £834 at the end of accounting year 2017 (Lee and et.al., 2014). It can be said
13
2011
2012
2013
2014
2015
2016
2017
578
468
547 689
745
834
Illustration 1: Pie chart for sales
Column graph for sales
2011 2012 2013 2014 2015 2016 2017
0
100
200
300
400
500
600
700
800
900
658
578
468
547
689
745
834
Illustration 2: Column chart for sales
Interpretation
From the above chart it can be interpreted that sales or revenue of Blackfriars restaurant
is decreases from the year 2011 to 2013 from £658 to £468. It shows that the firm is not able to
sale its products and services in the market. Afterwards level of sales start to increase from £468
and reaches up to £834 at the end of accounting year 2017 (Lee and et.al., 2014). It can be said
13
2011
2012
2013
2014
2015
2016
2017

that after the year 2013 Blackfriars restaurant having effective strategies to attract more number
of customers which lead to enhance revenue on continuously basis.
Pie chart for profit
132
125
112
125
193
231
292
Illustration 3: Pie chart for profit
Column graph for profit
2011 2012 2013 2014 2015 2016 2017
0
50
100
150
200
250
300
350
132 125 112 125
193
231
292
Illustration 4: Column chart for profit
Interpretation
The above pie chart and column graphs shows value of profit generated by the
Blackfriars restaurant from the accounting year 2011 to 2017. It can be analysed from the above
14
2011
2012
2013
2014
2015
2016
2017
Secure Best Marks with AI Grader
Need help grading? Try our AI Grader for instant feedback on your assignments.

graphical representations that profit reduce from £132 to 112 from the FY 2011 to 2013. On the
basis of this it can be said that the firm not able to manage its expenses. After the year 2013 level
of profit is enhances on continuous basis which is from worth of £112 to £292 by which it can be
said that management is highly able to control over the expenditures.
3.2 Trend line for forecasting data
The graph or tool which helps to the manager of Blackfriars restaurant in order to
determine trend of data and estimate future performance is known as trend line (Smith, 2015).
Which is stated as below:
Trend line for sales
2011 2012 2013 2014 2015 2016 2017
0
100
200
300
400
500
600
700
800
900
658
578
468
547
689
745
834
f(x) = 38.6785714286x + 490.8571428571
Illustration 5: Trend line for sales
Trend line for profit
15
Sales
Linear (Sales)

2011 2012 2013 2014 2015 2016 2017
0
50
100
150
200
250
300
350
132 125 112 125
193
231
292
f(x) = 27.6328571429x + 62.2357142857
Illustration 6: Trend line for profit
Interpretation
It can be visualized from above trend line that sales and profit both have increasing trend
from the financial year 2011 to 2017. Further, sales increase with the lower growth rate while
level of profit enhance with the higher growth rate. It can be predicted that in the future profit
and sales both will increase with the higher and lower growth rate respectively.
16
Profit
Linear (Profit)

3.3 Business presentation
17
17
Paraphrase This Document
Need a fresh take? Get an instant paraphrase of this document with our AI Paraphraser

18

19

20
Secure Best Marks with AI Grader
Need help grading? Try our AI Grader for instant feedback on your assignments.

21

22

3.4 Formal business report
Formal Business Report
To,
Board of Directors,
Blackfriars Restaurant
Date: 18th March 2017
The present report is on the basis of financial data of the Blackfriars restaurant which are
derived from annual report of it. From the financial data such as sales and profit from year 2011
to 2017, it can be analysed that the firm not able to sale its food products and services properly
from the FY 2011 to 2013. Due to this reason level of profit is also gets down in respective
years which impact adversely on financial position of Blackfriars restaurant. Apart from this
after the accounting period 2013 the firm formulate and applied highly effective marketing
strategies by which sales increase. Further, as level of sales and goes up from the year 2013
profit is also reacted in same direction. It can be said from the trend line that level of sales and
profit both will be enhance in the future accounting periods. The reason is that business entity
increases amount of sales from the year 2013 up to 2017 on the consistent basis. Along with
this, profit value is also giving response to the company in same direction of revenue. It can be
said that due to increasing revenue the Blackfriars restaurant able to generate more profit which
is beneficial for it. Moreover, it has highly effectual kind of advertisement techniques which
lead to attract more customers towards its food items which result is improving sales
continuously.
Conclusion- From the present report it can be concluded that company is performing well in the
industry of food items. On the basis of sales as well as profit figures and facts the conclusion is
to be made which is highly beneficial fir it. When looking at the sales data then at the end of
2011 it is £658 which reduces in 2012. After that, in the just next year Blackfriars restaurant not
able to attract more customers which result s that sales reduces and reaches up to £468. After
the accounting 2013 level of revenue enhances on consistent basis up to the FY 2017 which is
from £468 to £834. While taking base of profit value to assess business performance then it can
be identified that at the end of FY profit was worth of £132 which reduces up to FY 2013.
23
Paraphrase This Document
Need a fresh take? Get an instant paraphrase of this document with our AI Paraphraser

Moreover, the profitability giving response in accordance to sales and due to which it improves
from £112 to £292 from the fiscal year 2013 to 2017. By considering the trend line also it can
be said that Blackfriars restaurant will become more strong in terms of financial because sales
and profit both will enhance consistently.
TASK 4
4.1 Different tools of information processing Transaction processing system: It helps to the Blackfriars restaurant in order to record
different kinds of financial transactions in appropriate way (Indiveri and Liu, 2015).
When the data are recorded then the management able to know that firm how much
financially sound in the present as well as past. Management information system: Another information processing tool is MIS which
helps to the company in order to determine different management oriented reports and
data. It is very helpful tool for the managers of Blackfriars restaurant for taking effective
business decisions and make the firm highly profitable.
Decision support system: The technique or tool by which the management able to resolve
typical and complex situations of business is known as decision support system. It can be
said that the DSS tool is highly better for the business environment for making complex
decisions in firm (Weise and Chiong, 2015).
4.2 Preparation of project plan and determination of critical path
In the business there are different kinds of projects and plans are prepared and for that
project management tools are used by the manager. In the present scenario the Blackfriars
restaurant is going to open a new branch and for that it has to make plan and determine different
activities for completion of project. Plan of the project along with critical path and network
diagram given as below:
Serial
No. Task Name Duration Activity Preceding
activity Start Finish
1 Identify overall market 2 days A - Sat 3/18/17 Mon 3/20/17
24

2 select a location for
establish business 4 days B A Mon 3/20/17 Thu 3/23/17
3 Preparing layout for
kitchen 9 days C B Tue 3/21/17 Fri 3/31/17
4 Preparing layout for
dining room 7 days D B Tue 3/21/17 Wed 3/29/17
5 Fitting electricity 5 days E C Wed 3/22/17 Tue 3/28/17
6 Plumbing 4 days F D, E Thu 3/23/17 Tue 3/28/17
7 Painting and finishing 3 days G F Fri 3/24/17 Tue 3/28/17
Illustration 7: Network Diagram
Illustration 8: Gantt Chart
Interpretation
25

The above mentioned diagram helps to the Blackfriars restaurant in order to reduce total
time duration for project completion in effective manner. Along with this, the project manager
able to start two or more activities simultaneously by using the respective diagram. Gantt chart is
another tool of project management which shows all the activities of project in horizontal form
(Narain, 2016). On the basis of such diagrams critical path of project is such as follows:
Critical path: 1+2+3+5+6+7
The company can start activity 3 as well as 4 simultaneously which lead to reduce total
time of one activity. As per the critical path project will be complete within 27 days which is as
below:
Time duration: 2+4+9+5+4+3 = 27 days.
4.3 Assessing financial tools for making business decisions
In the business entity the entrepreneur make investment to generate return and make the
firm more profitable. In context to this, there are different financial tools are available which
shows that the project will be viable for the firm or not. In the present case, Blackfriars has an
option to make investment in second restaurant which is located in London (Milis, 2009). With
the help of NPV and IRR calculation of project viability and recommendations are given as
below:
Table 7: Calculation of NPV
Year Cash flow (in £) Discounting factor @ 12% Present value (in £)
Initial investment -190000
1 50000 0.893 44643
2 64000 0.797 51020
3 58000 0.712 41283
4 70000 0.636 44486
Total 181433
26
Secure Best Marks with AI Grader
Need help grading? Try our AI Grader for instant feedback on your assignments.

Less: Initial investment 190000
NPV -£8567
Table 8: Calculation of IRR
27
NPV -£8567
Table 8: Calculation of IRR
27

Year Cash flow (in £)
Initial investment -190000
1 50000
2 64000
3 58000
4 70000
IRR 9.94%
It can be analysed from the above calculation that when the firm will make investment in
second restaurant then it will provide negative return which is worth of -£8567. Apart from this,
internal rate of return is also low of the potential investment which is 9.94% at the end of four
years. Hence, it can be said that the project or investment is not profitable for Blackfriars
restaurant.
Recommendation
On the basis of above discussion it can be suggested to the Blackfriars restaurant that it
should not make investment in the second restaurant because it provides negative NPV and lower
IRR to the firm.
CONCLUSION
From the above carried out research on the business decision making it can be concluded
that, for collecting primary and secondary data questionnaire and annual report of Blackfriars
28

restaurant is used. Further, performance of the respective restaurant is not better but good in the
food industry of London on the basis of various statistical tools and method. It can be concluded
from graphical representation that, sales and profit both are reacting in same direction in the
firm. Revenue of Blackfriars restaurant is decreases from 2011 to 2013 and then start to increase
up to year 2017 and level of profit is as well. It can be analysed as per the financial tools that the
investment gives negative return so the firm should not make investment in second restaurant.
29
1 out of 31
Related Documents

Your All-in-One AI-Powered Toolkit for Academic Success.
+13062052269
info@desklib.com
Available 24*7 on WhatsApp / Email
Unlock your academic potential
© 2024 | Zucol Services PVT LTD | All rights reserved.