Business Decision Making Report: Balti Palace Expansion Strategy
VerifiedAdded on 2020/07/22
|20
|4278
|31
Report
AI Summary
This report focuses on business decision-making, particularly in the context of a restaurant, Balti Palace, aiming to expand its operations. The report begins with a plan for collecting both primary and secondary data, detailing survey methodologies and sampling frameworks, along with the design and justification of a questionnaire. The data collected is then summarized and analyzed using various statistical tools, including measures of central tendency (mean, median, mode), measures of dispersion, and techniques like quartiles, percentiles, and correlation coefficients. The report also incorporates graphical representations and trend lines to visualize the data, culminating in a business presentation and report. Furthermore, the report explores the application of information processing tools, the critical path method, and financial tools in the decision-making process, providing a comprehensive analysis to guide the restaurant's expansion strategy. The assignment demonstrates the application of data analysis and strategic planning to support sound business decisions.

BUSINESS DECISION
MAKING
MAKING
Paraphrase This Document
Need a fresh take? Get an instant paraphrase of this document with our AI Paraphraser
Table of Contents
INTRODUCTION...........................................................................................................................1
TASK 1............................................................................................................................................1
1.1 Plan for collecting primary and secondary data....................................................................1
1.2 Survey methodology and sampling framework....................................................................2
1.3 Justification and preparation of questionnaire......................................................................2
2.1 Summarisation of gathered data............................................................................................4
2.2 Analysing data by using central tendency.............................................................................7
2.3 Applying measures of dispersion..........................................................................................7
2.4 Applying of quartile, percentile and correlation coefficient for taking correct decision......9
TASK 2............................................................................................................................................9
3.1 Graph and Charts...................................................................................................................9
3.2 Trend line............................................................................................................................12
3.3 Business presentation..........................................................................................................15
3.4 Business report ...................................................................................................................15
TASK 3 .........................................................................................................................................15
4.1 Use of information processing tool.....................................................................................15
4.2 Critical path.........................................................................................................................16
4.3 Use of financial tools in the procedure of decision making ..............................................17
CONCLUSION..............................................................................................................................17
REFERENCES..............................................................................................................................18
INTRODUCTION
A business can only succeed if they continuously take correct decisions. Making right
call is not an easy task because managers of a company have to gather and analyse different kind
of data (Aronson, Liang and Turban, 2011). The main problems faced by a firm starts when they
try to expand their operations. Corporations always have a fear that if their judgement regarding
'''where to invest'' get wrong then may financially derail whole organisation. Balti Palace is
restaurant, they want to expand their business and open one more outlet in London. This
assignment will discuss about primary and second data, some sampling method will also become
part of this report. A questionnaire will be developed for knowing the views of respondents.
Some statistical tools like standards deviation, mean, median, mode will be explained in this
report. This assist in making important decision regarding opening of a new restaurant.
TASK 1
1.1 Plan for collecting primary and secondary data
Without a proper plan, an organisation should not try to start performing any task. The
significance of various vital information is increasing the because external and internal factors
have ability to reduce the effectiveness of the strategy which is made by managers of a company.
Below is the plan for gathering data:
Planning for the methods of selection – Researchers can find necessary data from
different sources but they have to decide the best place so a reliable and relevant content can be
gathered. Their are popularly two kind of data, primary and secondary. The prior one is the
information which come in light for the first time. Other one is already present some where and
researcher just have to copy it (Nielsen and Nielsen, 2011). Both kind of data have their own
importance and they have to be used at the time of conducting a research. Quantitative and
qualitative are two other kind of methods for research. First one is deals with the frequency i.e.
the numbers and later one is related to option.
Plan required resources – Some people may think that identifying and collecting various
content is as easy task but in reality it is very complicated. Fist of all, researcher need to find
appropriate people who can provide essential information. The data that is record is past will also
be needed for in the whole process. Government sources always provide authenticate data, these
websites will be visited for collection necessary content. Money will be a significant resources
1
⊘ This is a preview!⊘
Do you want full access?
Subscribe today to unlock all pages.
Trusted by 1+ million students worldwide
which is required for conducting a proper research. Technology has changed the business
environment and option of a large number of customer can be taken by starting an online survey
(O’Fallon and Butterfield, 2015).
Plan right time for gathering data – Most of the researcher commit a blunder by
recording information in the wrong time. The significance of correct timing is increasing, this
researcher will done done when respondents will not have any kind of biased viewpoint.
1.2 Survey methodology and sampling framework
Choosing the right method of organising survey is necessary for attaining better outcome.
Balti Palace want to expand their organisation and knowing views of their stakeholder is
essential for performing this task in a effective way. Questionnaire will be used by the researcher
for analysing the thinking of respondents. This survey will have questions regarding different
aspects like interior of restaurant, quality of food, etc. Primary data is reliable and it helps in
providing the exact and relevant information which is demanded by the researcher.
Balti Palace has many stakeholders, involving all of them in survey is not possible for
this company (Pfeffer and Salancik, 2011). Random sampling will be an option for researcher.
In this approach, respondents are selected randomly i.e. without creating any pattern or making a
strategy. This is simple method and the chances of baisness is almost nil. Sometime some
stakeholder feel bad when they views are not taken but others are involved in the survey, if this
technique is used by the company then they can explain that they have selected sample
randomly. Stratified sampling is another option, it is a better version of random sampling. First
some group are made created in this approach and then one of them in chosen randomly. Both
methods are effective and they are not very expensive. They are simple to implement and they
does not take much time.
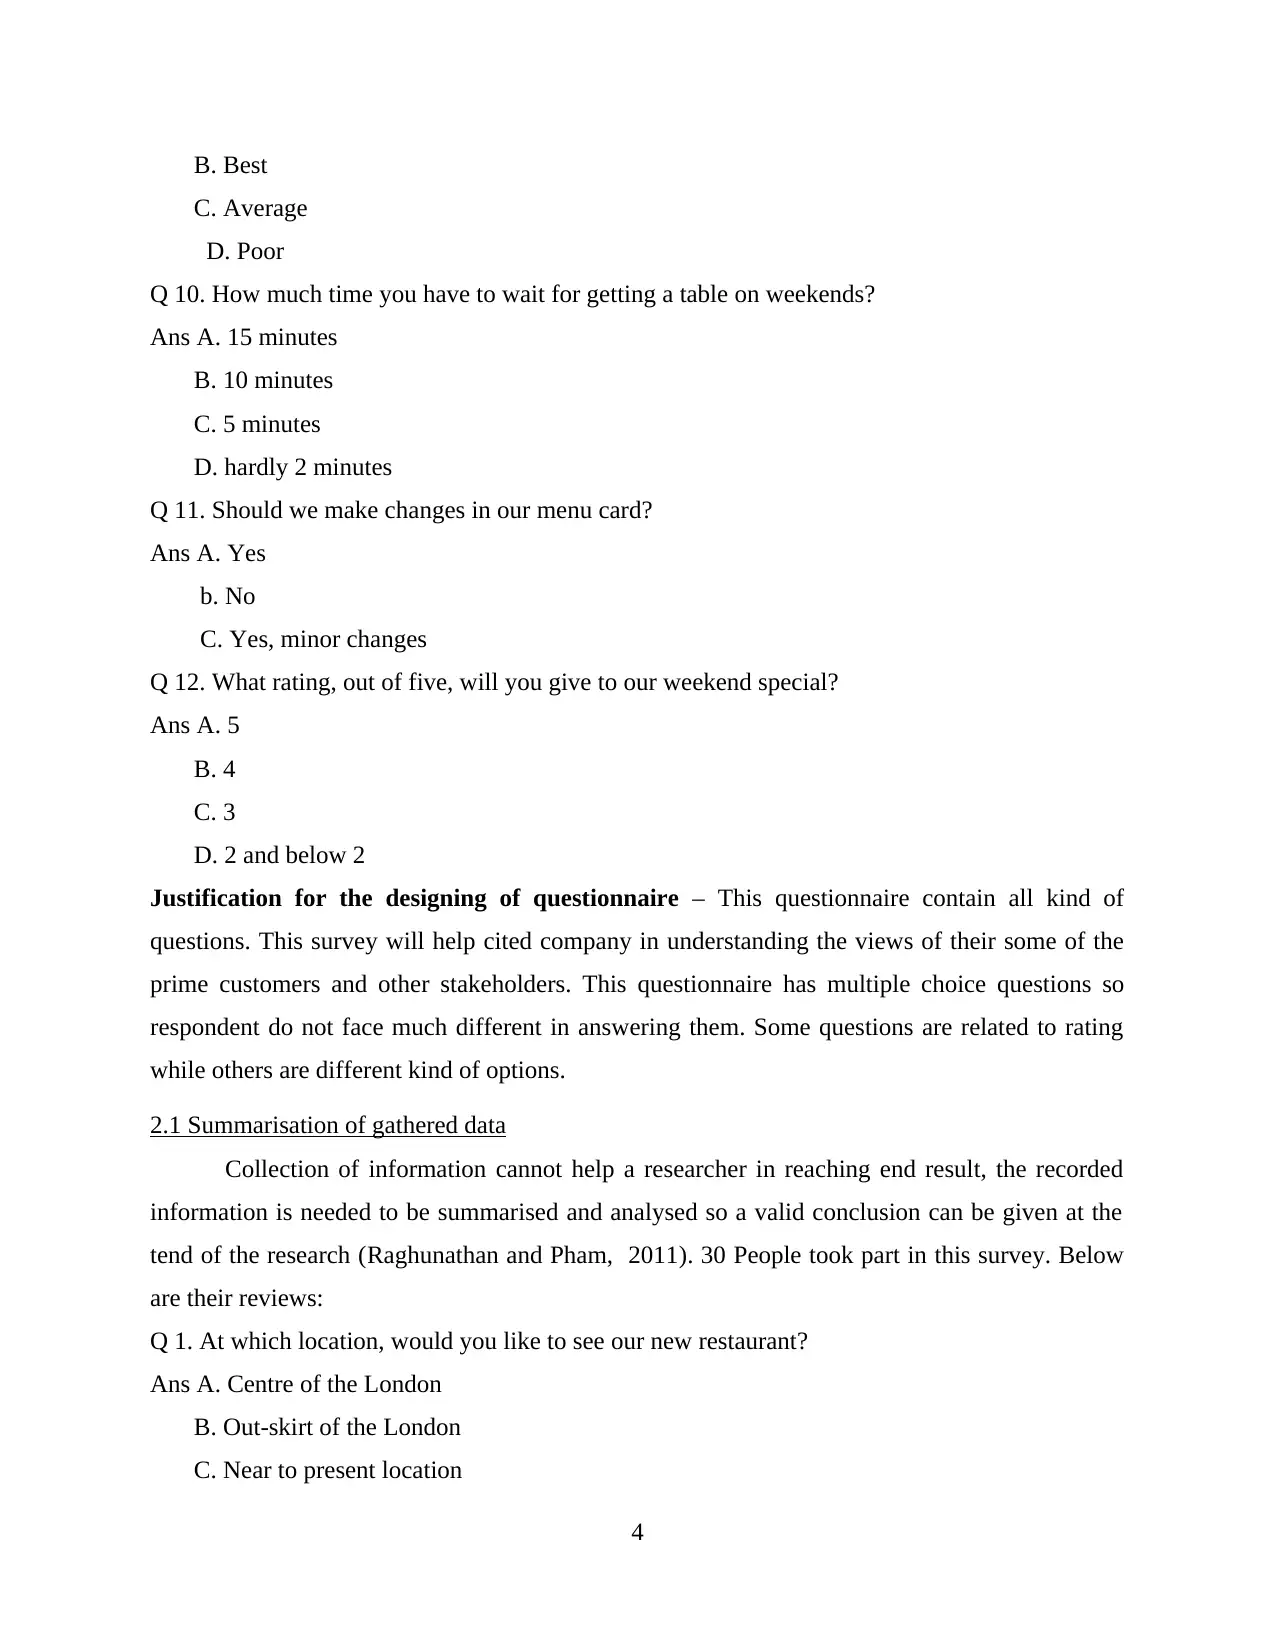
1.3 Justification and preparation of questionnaire
This questionnaire will be filled by 30 respondents. They are either directly or indirectly
related to the business of Balti Palace.
Q 1. At which location, would you like to see our new restaurant?
Ans A. Centre of the London
B. Out-skirt of the London
C. Near to present location
Q 2. What rating would you like to give for the service you get at our restaurant?
2
environment and option of a large number of customer can be taken by starting an online survey
(O’Fallon and Butterfield, 2015).
Plan right time for gathering data – Most of the researcher commit a blunder by
recording information in the wrong time. The significance of correct timing is increasing, this
researcher will done done when respondents will not have any kind of biased viewpoint.
1.2 Survey methodology and sampling framework
Choosing the right method of organising survey is necessary for attaining better outcome.
Balti Palace want to expand their organisation and knowing views of their stakeholder is
essential for performing this task in a effective way. Questionnaire will be used by the researcher
for analysing the thinking of respondents. This survey will have questions regarding different
aspects like interior of restaurant, quality of food, etc. Primary data is reliable and it helps in
providing the exact and relevant information which is demanded by the researcher.
Balti Palace has many stakeholders, involving all of them in survey is not possible for
this company (Pfeffer and Salancik, 2011). Random sampling will be an option for researcher.
In this approach, respondents are selected randomly i.e. without creating any pattern or making a
strategy. This is simple method and the chances of baisness is almost nil. Sometime some
stakeholder feel bad when they views are not taken but others are involved in the survey, if this
technique is used by the company then they can explain that they have selected sample
randomly. Stratified sampling is another option, it is a better version of random sampling. First
some group are made created in this approach and then one of them in chosen randomly. Both
methods are effective and they are not very expensive. They are simple to implement and they
does not take much time.
1.3 Justification and preparation of questionnaire
This questionnaire will be filled by 30 respondents. They are either directly or indirectly
related to the business of Balti Palace.
Q 1. At which location, would you like to see our new restaurant?
Ans A. Centre of the London
B. Out-skirt of the London
C. Near to present location
Q 2. What rating would you like to give for the service you get at our restaurant?
2
Paraphrase This Document
Need a fresh take? Get an instant paraphrase of this document with our AI Paraphraser
Ans A. 5
B. 4
C. 3
D. Below 3
Q 3. What countries food is our speciality?
Ans A. Italian
B. Spanish
C. Chinese
D. Indian
Q 4. Which countries food will you prefer to eat in our new restaurant?
Ans A. Indian
B. Japanese
C. Lebanese
D. Sea food
Q 5. Should the interior of the new restaurant be different from present one?
Ans A. Yes
B. No
C. Yes, but not completely
Q 6. Should we play slow instrumental music in our restaurant?
Ans A. Yes
B. No
Q 7. Do you think that manpower in new restaurant should be more the present one?
Ans A. Yes
B. No
C. Yes, but only on weekends and holidays
Q 8. Would you prefer to pay more sum for getting better food and service?
Ans A. Yes
B. No
C. Yes, but not much
Q 9. What are your views about quality of our dishes?
Ans A. Good
3
B. Best
C. Average
D. Poor
Q 10. How much time you have to wait for getting a table on weekends?
Ans A. 15 minutes
B. 10 minutes
C. 5 minutes
D. hardly 2 minutes
Q 11. Should we make changes in our menu card?
Ans A. Yes
b. No
C. Yes, minor changes
Q 12. What rating, out of five, will you give to our weekend special?
Ans A. 5
B. 4
C. 3
D. 2 and below 2
Justification for the designing of questionnaire – This questionnaire contain all kind of
questions. This survey will help cited company in understanding the views of their some of the
prime customers and other stakeholders. This questionnaire has multiple choice questions so
respondent do not face much different in answering them. Some questions are related to rating
while others are different kind of options.
2.1 Summarisation of gathered data
Collection of information cannot help a researcher in reaching end result, the recorded
information is needed to be summarised and analysed so a valid conclusion can be given at the
tend of the research (Raghunathan and Pham, 2011). 30 People took part in this survey. Below
are their reviews:
Q 1. At which location, would you like to see our new restaurant?
Ans A. Centre of the London
B. Out-skirt of the London
C. Near to present location
4
⊘ This is a preview!⊘
Do you want full access?
Subscribe today to unlock all pages.
Trusted by 1+ million students worldwide
Q 2. What rating would you like to give for the service you get at our restaurant?
Ans A. 5
B. 4
C. 3
D. Below 3
Q 3. What countries food is our speciality?
Ans A. Italian
B. Spanish
C. Chinese
D. Indian
Q 4. Which countries food will you prefer to eat in our new restaurant?
Ans A. Indian
B. Japanese
C. Lebanese
D. Sea food
Q 5. Should the interior of the new restaurant be different from present one?
Ans A. Yes
B. No
C. Yes, but not completely
Q 6. Should we play slow instrumental music in our restaurant?
Ans A. Yes
B. No
Q 7. Do you think that manpower in new restaurant should be more the present one?
Ans A. Yes
B. No
C. Yes, but only on weekends and holidays
Q 8. Would you prefer to pay more sum for getting better food and service?
Ans A. Yes
B. No
C. Yes, but not much
Q 9. What are your views about quality of our dishes?
5
Paraphrase This Document
Need a fresh take? Get an instant paraphrase of this document with our AI Paraphraser
Ans A. Good
B. Best
C. Average
D. Poor
Q 10. How much time you have to wait for getting a table on weekends?
Ans A. 15 minutes
B. 10 minutes
C. 5 minutes
D. hardly 2 minutes
Q 11. Should we make changes in our menu card?
Ans A. Yes
b. No
C. Yes, minor changes
Q 12. What rating, out of five, will you give to our weekend special?
Ans A. 5
B. 4
C. 3
D. 2 and below 2
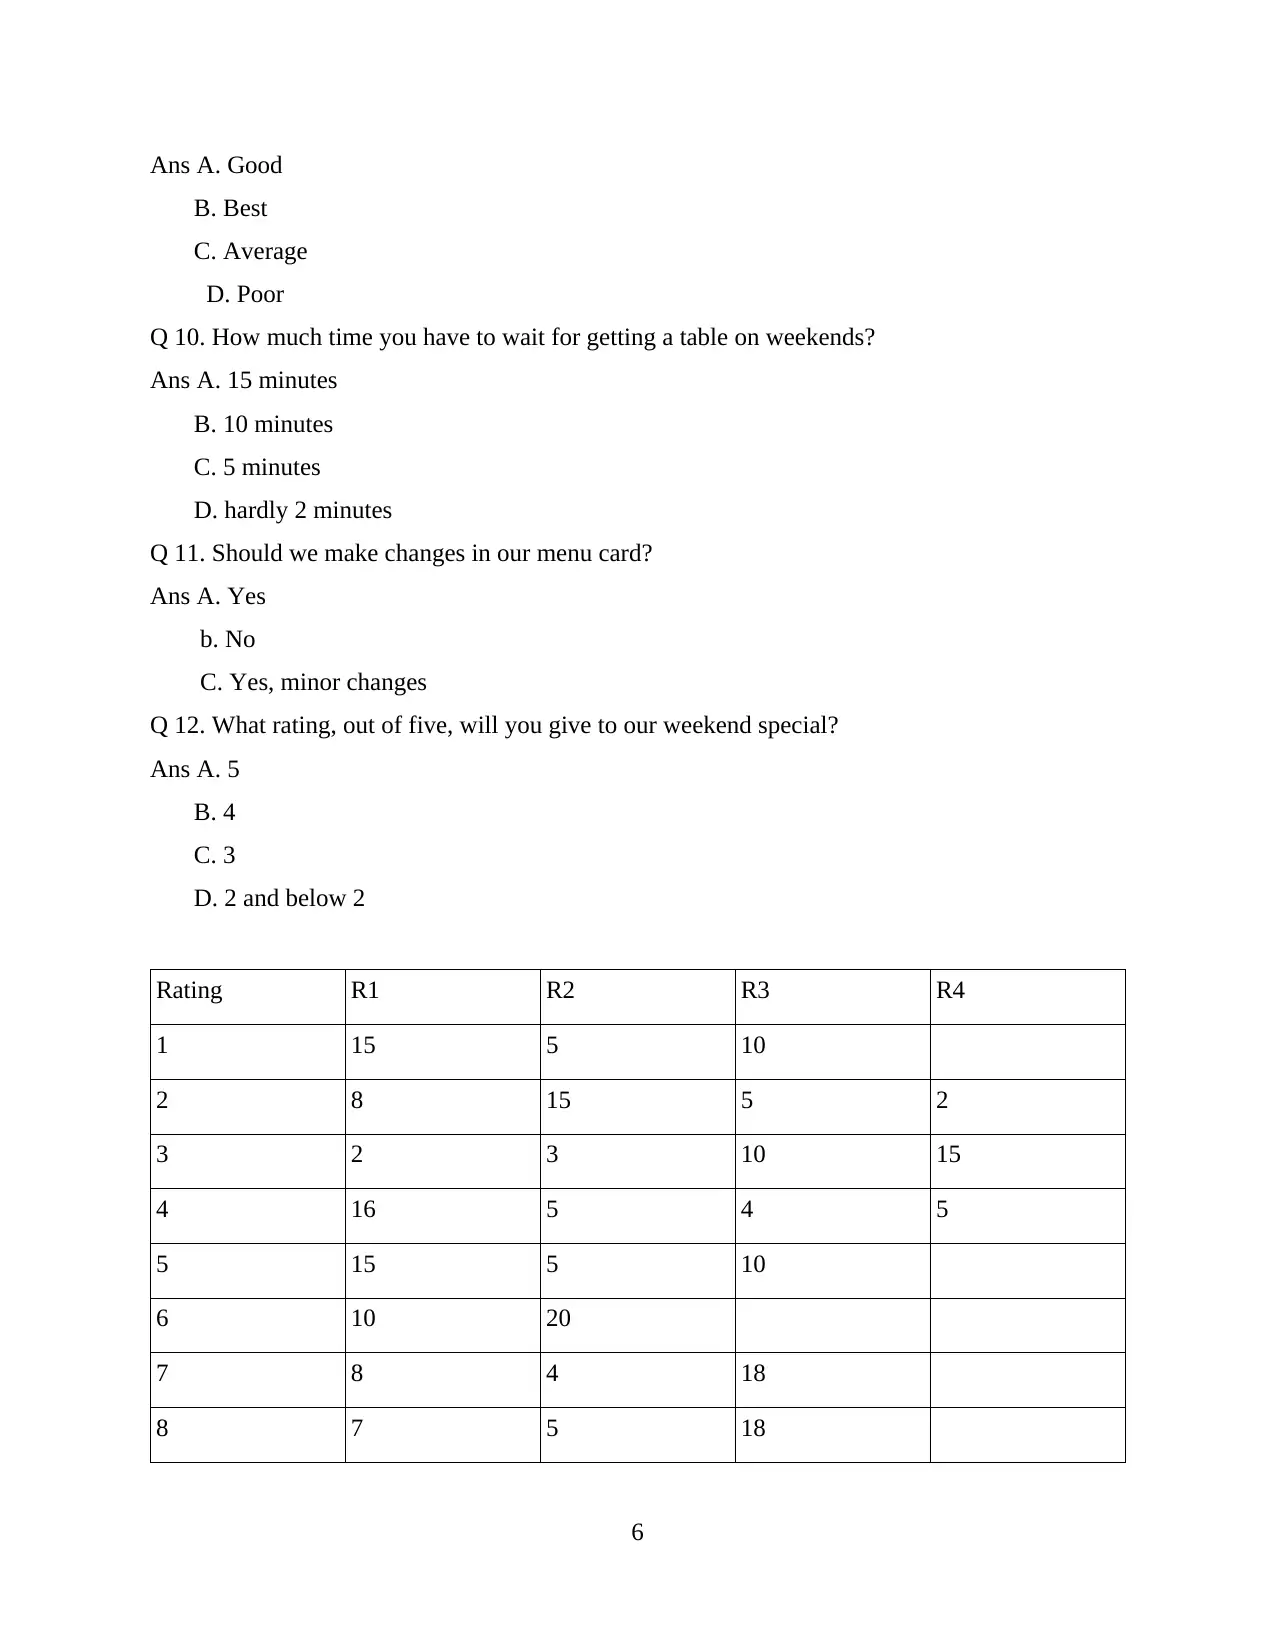
Rating R1 R2 R3 R4
1 15 5 10
2 8 15 5 2
3 2 3 10 15
4 16 5 4 5
5 15 5 10
6 10 20
7 8 4 18
8 7 5 18
6
B. Best
C. Average
D. Poor
Q 10. How much time you have to wait for getting a table on weekends?
Ans A. 15 minutes
B. 10 minutes
C. 5 minutes
D. hardly 2 minutes
Q 11. Should we make changes in our menu card?
Ans A. Yes
b. No
C. Yes, minor changes
Q 12. What rating, out of five, will you give to our weekend special?
Ans A. 5
B. 4
C. 3
D. 2 and below 2
Rating R1 R2 R3 R4
1 15 5 10
2 8 15 5 2
3 2 3 10 15
4 16 5 4 5
5 15 5 10
6 10 20
7 8 4 18
8 7 5 18
6
9 18 2 4 6
10 15 10 3 2
11 10 5 15
12 8 10 7 5
The above survey shows that people are satisfied with food quality which is offered by Balti
Palace but they are unhappy with the services of the restaurant specially on weekends. A decent
percentage of customers feel that in new outlet, this organisation should recruit more people so
they can speed up their services and reduce waiting time. The taste of customer are changing and
they want to eat Indian food.
2.2 Analysing data by using central tendency
Rating R1 R2 R3 R3 MEAN MEDIAN MODE
1 15 5 10 10 10 15
2 8 15 5 2 7.5 6.5 15
3 2 3 10 15 7.5 6.5 15
4 16 5 4 5 7.5 5 16
5 15 5 10 10 10 15
6 10 20 15 15 20
7 8 4 18 10 10 18
8 7 5 18 10 10 18
9 18 2 4 6 7.5 6.5 18
10 15 10 3 2 7.5 6.5 15
11 10 5 15 10 10 15
12 8 10 7 5 7.5 6.5 10
Location of hotel need to get establish at such place where more and more number of
customers easily reach towards them. Along with this, customers perspective towards
environment and amenities is also good which facilitate them in generating more and more profit
fir business and staring an association properly. Most number of customer prefer Indian food
rather than other services. This work as a beneficial tool for making their operations effective in
7
⊘ This is a preview!⊘
Do you want full access?
Subscribe today to unlock all pages.
Trusted by 1+ million students worldwide
nature. Management also try to control all waiting process by delivering goods and services with
in 15 minutes.
A major thing which have to take in account by business is to enforce the man power at
such context when number of customers are more at restaurant. Thus, business have to take all
such factor in account.
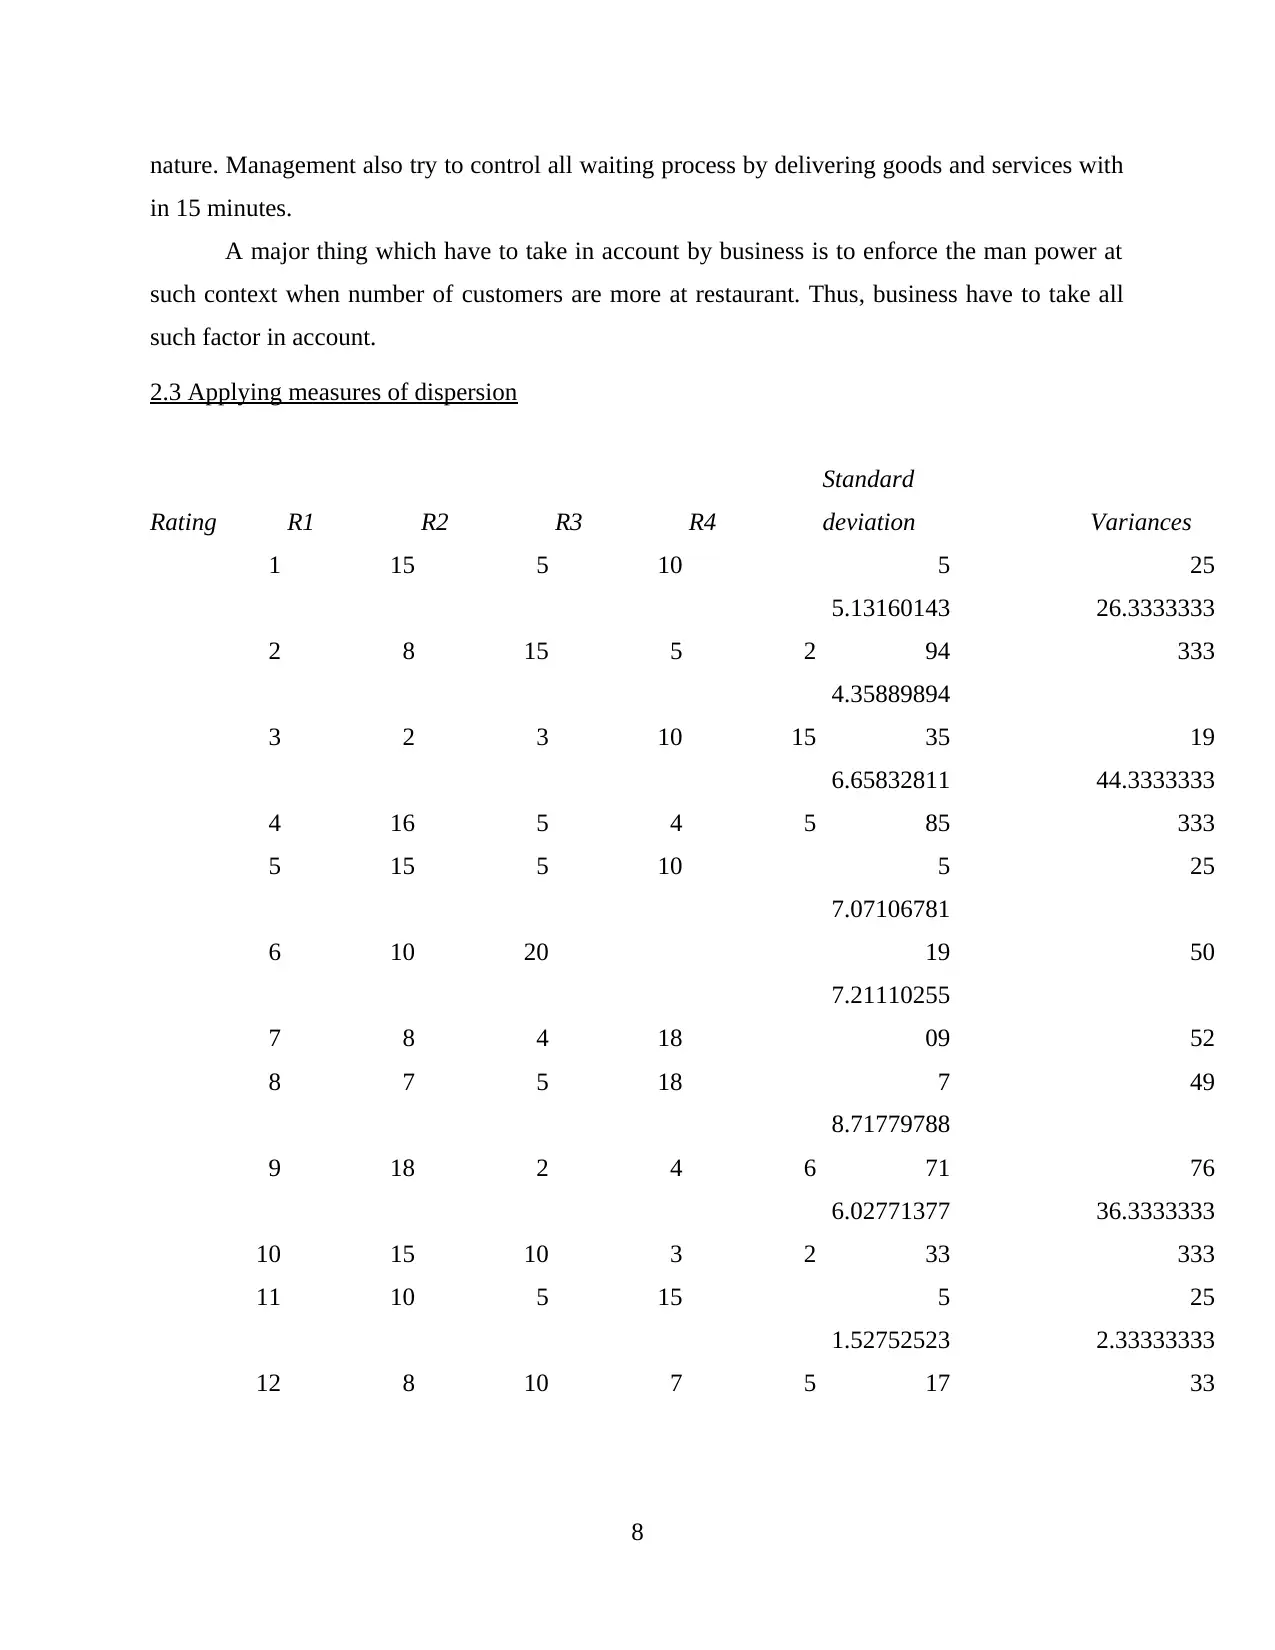
2.3 Applying measures of dispersion
Rating R1 R2 R3 R4
Standard
deviation Variances
1 15 5 10 5 25
2 8 15 5 2
5.13160143
94
26.3333333
333
3 2 3 10 15
4.35889894
35 19
4 16 5 4 5
6.65832811
85
44.3333333
333
5 15 5 10 5 25
6 10 20
7.07106781
19 50
7 8 4 18
7.21110255
09 52
8 7 5 18 7 49
9 18 2 4 6
8.71779788
71 76
10 15 10 3 2
6.02771377
33
36.3333333
333
11 10 5 15 5 25
12 8 10 7 5
1.52752523
17
2.33333333
33
8
in 15 minutes.
A major thing which have to take in account by business is to enforce the man power at
such context when number of customers are more at restaurant. Thus, business have to take all
such factor in account.
2.3 Applying measures of dispersion
Rating R1 R2 R3 R4
Standard
deviation Variances
1 15 5 10 5 25
2 8 15 5 2
5.13160143
94
26.3333333
333
3 2 3 10 15
4.35889894
35 19
4 16 5 4 5
6.65832811
85
44.3333333
333
5 15 5 10 5 25
6 10 20
7.07106781
19 50
7 8 4 18
7.21110255
09 52
8 7 5 18 7 49
9 18 2 4 6
8.71779788
71 76
10 15 10 3 2
6.02771377
33
36.3333333
333
11 10 5 15 5 25
12 8 10 7 5
1.52752523
17
2.33333333
33
8
Paraphrase This Document
Need a fresh take? Get an instant paraphrase of this document with our AI Paraphraser
Standard deviation: This stated about the difference between member of group and a
mean value of a group. This differentiation is essential to get determine in an appropriate manner
through which a distance between average and mean value from the mid get identify (Simon,
2011). On the basis of present analysis, several things get evaluated in an appropriate manner.
Many people think that interior of new restaurant need to get changed from others so that
maximum number of customers will get attracted. Along with this, their prices are appropriate in
nature because they are using effective pricing strategy which enables them to make operations
effective in nature. This provide support in organising better and effective things. Many people
provide views that changes support them to grow and developed. Ratings of a company on the
basis of customers is also good which emphasise that they are operating things properly.
Variances: It is a fact of quality which stated the difference between two groups. This is
helpful in analysing variances which are taking place for common cause on the basis of various
similar group opinion. Indian food is a preference of many customers, and variation between
these groups people is also high in nature (Smith, Binns and Tushman, 2011). Thus, management
have to hire such candidates whom are capable in manufacturing and producing Indian food
products. Quality of products are also good in nature which stated that Balti palace staff
members have good knowledge and skill to deal with various situation in an appropriate manner.
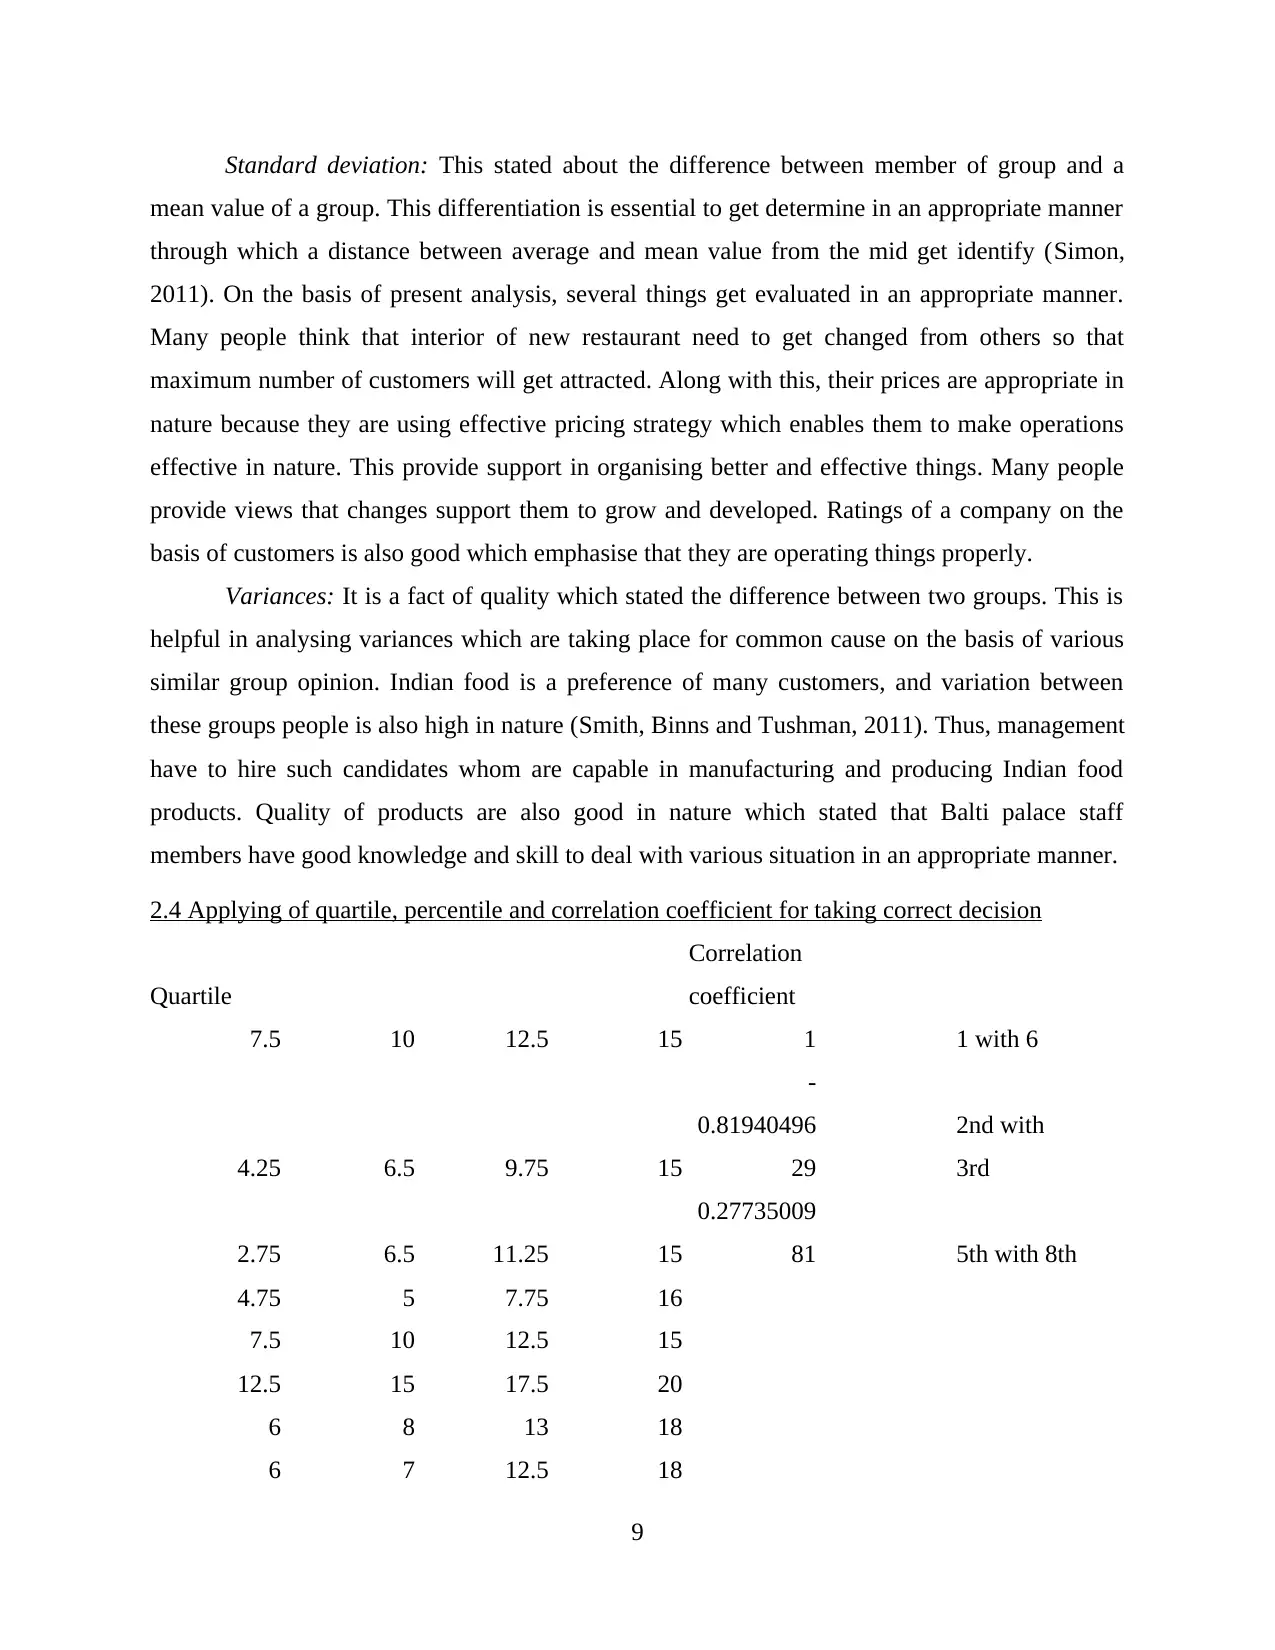
2.4 Applying of quartile, percentile and correlation coefficient for taking correct decision
Quartile
Correlation
coefficient
7.5 10 12.5 15 1 1 with 6
4.25 6.5 9.75 15
-
0.81940496
29
2nd with
3rd
2.75 6.5 11.25 15
0.27735009
81 5th with 8th
4.75 5 7.75 16
7.5 10 12.5 15
12.5 15 17.5 20
6 8 13 18
6 7 12.5 18
9
mean value of a group. This differentiation is essential to get determine in an appropriate manner
through which a distance between average and mean value from the mid get identify (Simon,
2011). On the basis of present analysis, several things get evaluated in an appropriate manner.
Many people think that interior of new restaurant need to get changed from others so that
maximum number of customers will get attracted. Along with this, their prices are appropriate in
nature because they are using effective pricing strategy which enables them to make operations
effective in nature. This provide support in organising better and effective things. Many people
provide views that changes support them to grow and developed. Ratings of a company on the
basis of customers is also good which emphasise that they are operating things properly.
Variances: It is a fact of quality which stated the difference between two groups. This is
helpful in analysing variances which are taking place for common cause on the basis of various
similar group opinion. Indian food is a preference of many customers, and variation between
these groups people is also high in nature (Smith, Binns and Tushman, 2011). Thus, management
have to hire such candidates whom are capable in manufacturing and producing Indian food
products. Quality of products are also good in nature which stated that Balti palace staff
members have good knowledge and skill to deal with various situation in an appropriate manner.
2.4 Applying of quartile, percentile and correlation coefficient for taking correct decision
Quartile
Correlation
coefficient
7.5 10 12.5 15 1 1 with 6
4.25 6.5 9.75 15
-
0.81940496
29
2nd with
3rd
2.75 6.5 11.25 15
0.27735009
81 5th with 8th
4.75 5 7.75 16
7.5 10 12.5 15
12.5 15 17.5 20
6 8 13 18
6 7 12.5 18
9
3.5 5 9 18
2.75 6.5 11.25 15
7.5 10 12.5 15
6.5 7.5 8.5 10
This evaluation reflect upon on relation of location with music which play by managers at
restaurant. It stated a negative relationship between each other which is not beneficial for the
long term projects and its execution. Interior design require more and more money which
business have to arrange some amount for making such property effective in nature.
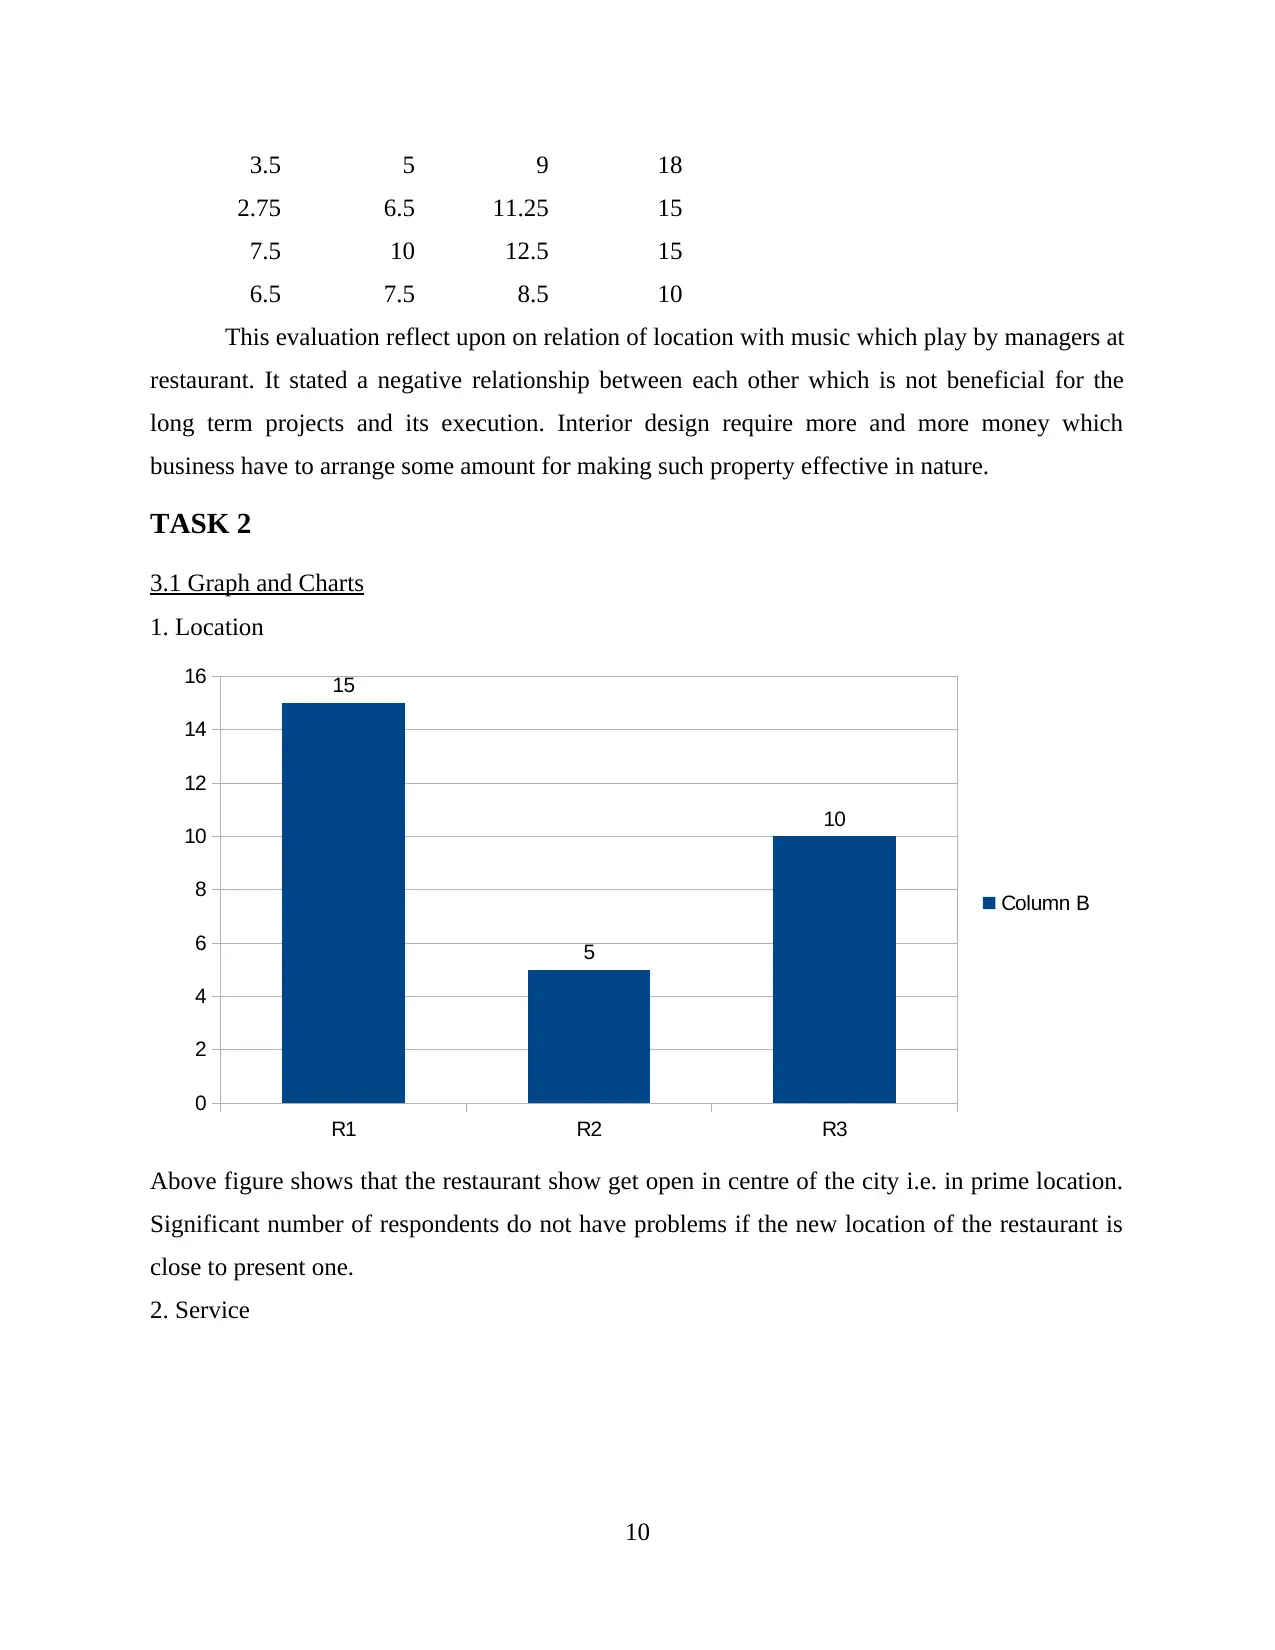
TASK 2
3.1 Graph and Charts
1. Location
Above figure shows that the restaurant show get open in centre of the city i.e. in prime location.
Significant number of respondents do not have problems if the new location of the restaurant is
close to present one.
2. Service
10
R1 R2 R3
0
2
4
6
8
10
12
14
16 15
5
10
Column B
2.75 6.5 11.25 15
7.5 10 12.5 15
6.5 7.5 8.5 10
This evaluation reflect upon on relation of location with music which play by managers at
restaurant. It stated a negative relationship between each other which is not beneficial for the
long term projects and its execution. Interior design require more and more money which
business have to arrange some amount for making such property effective in nature.
TASK 2
3.1 Graph and Charts
1. Location
Above figure shows that the restaurant show get open in centre of the city i.e. in prime location.
Significant number of respondents do not have problems if the new location of the restaurant is
close to present one.
2. Service
10
R1 R2 R3
0
2
4
6
8
10
12
14
16 15
5
10
Column B
⊘ This is a preview!⊘
Do you want full access?
Subscribe today to unlock all pages.
Trusted by 1+ million students worldwide
1 out of 20
Related Documents


Your All-in-One AI-Powered Toolkit for Academic Success.
+13062052269
info@desklib.com
Available 24*7 on WhatsApp / Email
![[object Object]](/_next/static/media/star-bottom.7253800d.svg)
Unlock your academic potential
Copyright © 2020–2026 A2Z Services. All Rights Reserved. Developed and managed by ZUCOL.