Business Decision Making Report: Analyzing a Fresh Juice Manufacturer
VerifiedAdded on 2020/01/15
|25
|5175
|117
Report
AI Summary
This report provides a comprehensive analysis of business decision-making for a fresh juice manufacturer and retailer in London. It begins with an introduction to the importance of business decision-making and its application to the firm, which is a UK-listed company. The report then covers primary and secondary research, including survey methodology, questionnaire design, and data collection. The analysis includes summarizing collected data, measures of dispersion, quartile, percentile, and correlation calculations to draw conclusions regarding product launch viability. Furthermore, the report uses spreadsheet-generated graphs, trend lines, and financial tools for decision-making. The report aims to provide insights into emerging market trends and the viability of introducing new products, ultimately aiding in informed business decisions.

BUSINESS DECISION MAKING
Paraphrase This Document
Need a fresh take? Get an instant paraphrase of this document with our AI Paraphraser
TABLE OF CONTENTS
INTRODUCTION...........................................................................................................................3
TASK 1............................................................................................................................................3
A Plan and carry out secondary and primary research................................................................3
B Presenting survey methodology and sampling frame used......................................................4
C Designing questionnaire to be used..........................................................................................4
TASK 2............................................................................................................................................6
A Summarizing the data collected from primary and secondary research..................................6
Analysis of collected data through measures of dispersion.........................................................7
B Quartile percentile and correlation in drawing conclusion......................................................9
TASK 3..........................................................................................................................................10
A Graphs using spreadsheet.......................................................................................................10
B Creation of trend line..............................................................................................................13
C This task has been covered in power point presentation........................................................13
D Formal business report...........................................................................................................13
TASK 4..........................................................................................................................................14
Appropriate information processing tools.................................................................................14
Preparation of project plan and determination of critical path..................................................15
....................................................................................................................................................18
Financial tools for decision making...........................................................................................18
CONCLUSION..............................................................................................................................22
2
Index of Tables
Table 1: Secondary data analysis.....................................................................................................8
Table 2: Descriptive statistics of Sales............................................................................................9
Table 3: Descriptive statistics of Profit............................................................................................9
Table 4: Percentile calculation for profit and sales........................................................................10
Table 5: Calculation of Quartile for sales and profit.....................................................................10
Table 6: Calculation of correlation................................................................................................11
3
⊘ This is a preview!⊘
Do you want full access?
Subscribe today to unlock all pages.
Trusted by 1+ million students worldwide
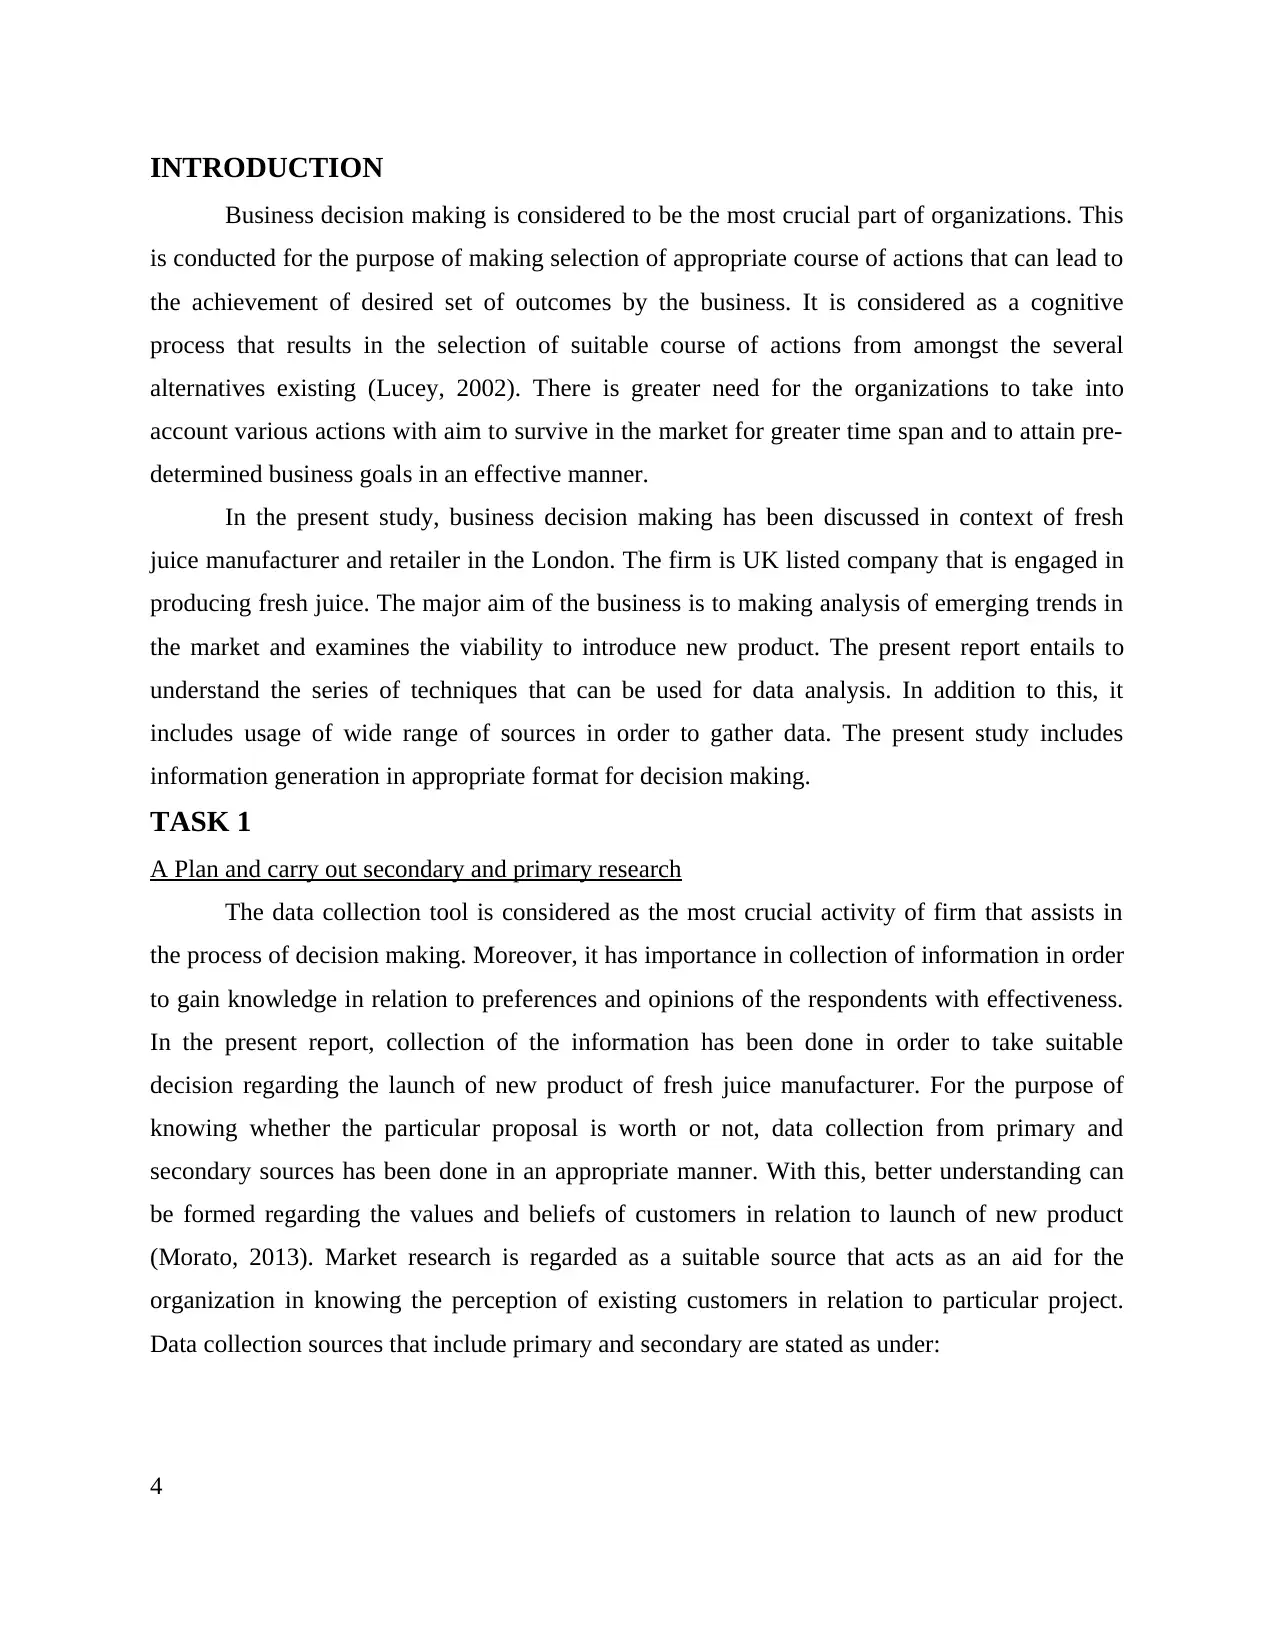
INTRODUCTION
Business decision making is considered to be the most crucial part of organizations. This
is conducted for the purpose of making selection of appropriate course of actions that can lead to
the achievement of desired set of outcomes by the business. It is considered as a cognitive
process that results in the selection of suitable course of actions from amongst the several
alternatives existing (Lucey, 2002). There is greater need for the organizations to take into
account various actions with aim to survive in the market for greater time span and to attain pre-
determined business goals in an effective manner.
In the present study, business decision making has been discussed in context of fresh
juice manufacturer and retailer in the London. The firm is UK listed company that is engaged in
producing fresh juice. The major aim of the business is to making analysis of emerging trends in
the market and examines the viability to introduce new product. The present report entails to
understand the series of techniques that can be used for data analysis. In addition to this, it
includes usage of wide range of sources in order to gather data. The present study includes
information generation in appropriate format for decision making.
TASK 1
A Plan and carry out secondary and primary research
The data collection tool is considered as the most crucial activity of firm that assists in
the process of decision making. Moreover, it has importance in collection of information in order
to gain knowledge in relation to preferences and opinions of the respondents with effectiveness.
In the present report, collection of the information has been done in order to take suitable
decision regarding the launch of new product of fresh juice manufacturer. For the purpose of
knowing whether the particular proposal is worth or not, data collection from primary and
secondary sources has been done in an appropriate manner. With this, better understanding can
be formed regarding the values and beliefs of customers in relation to launch of new product
(Morato, 2013). Market research is regarded as a suitable source that acts as an aid for the
organization in knowing the perception of existing customers in relation to particular project.
Data collection sources that include primary and secondary are stated as under:
4
Paraphrase This Document
Need a fresh take? Get an instant paraphrase of this document with our AI Paraphraser
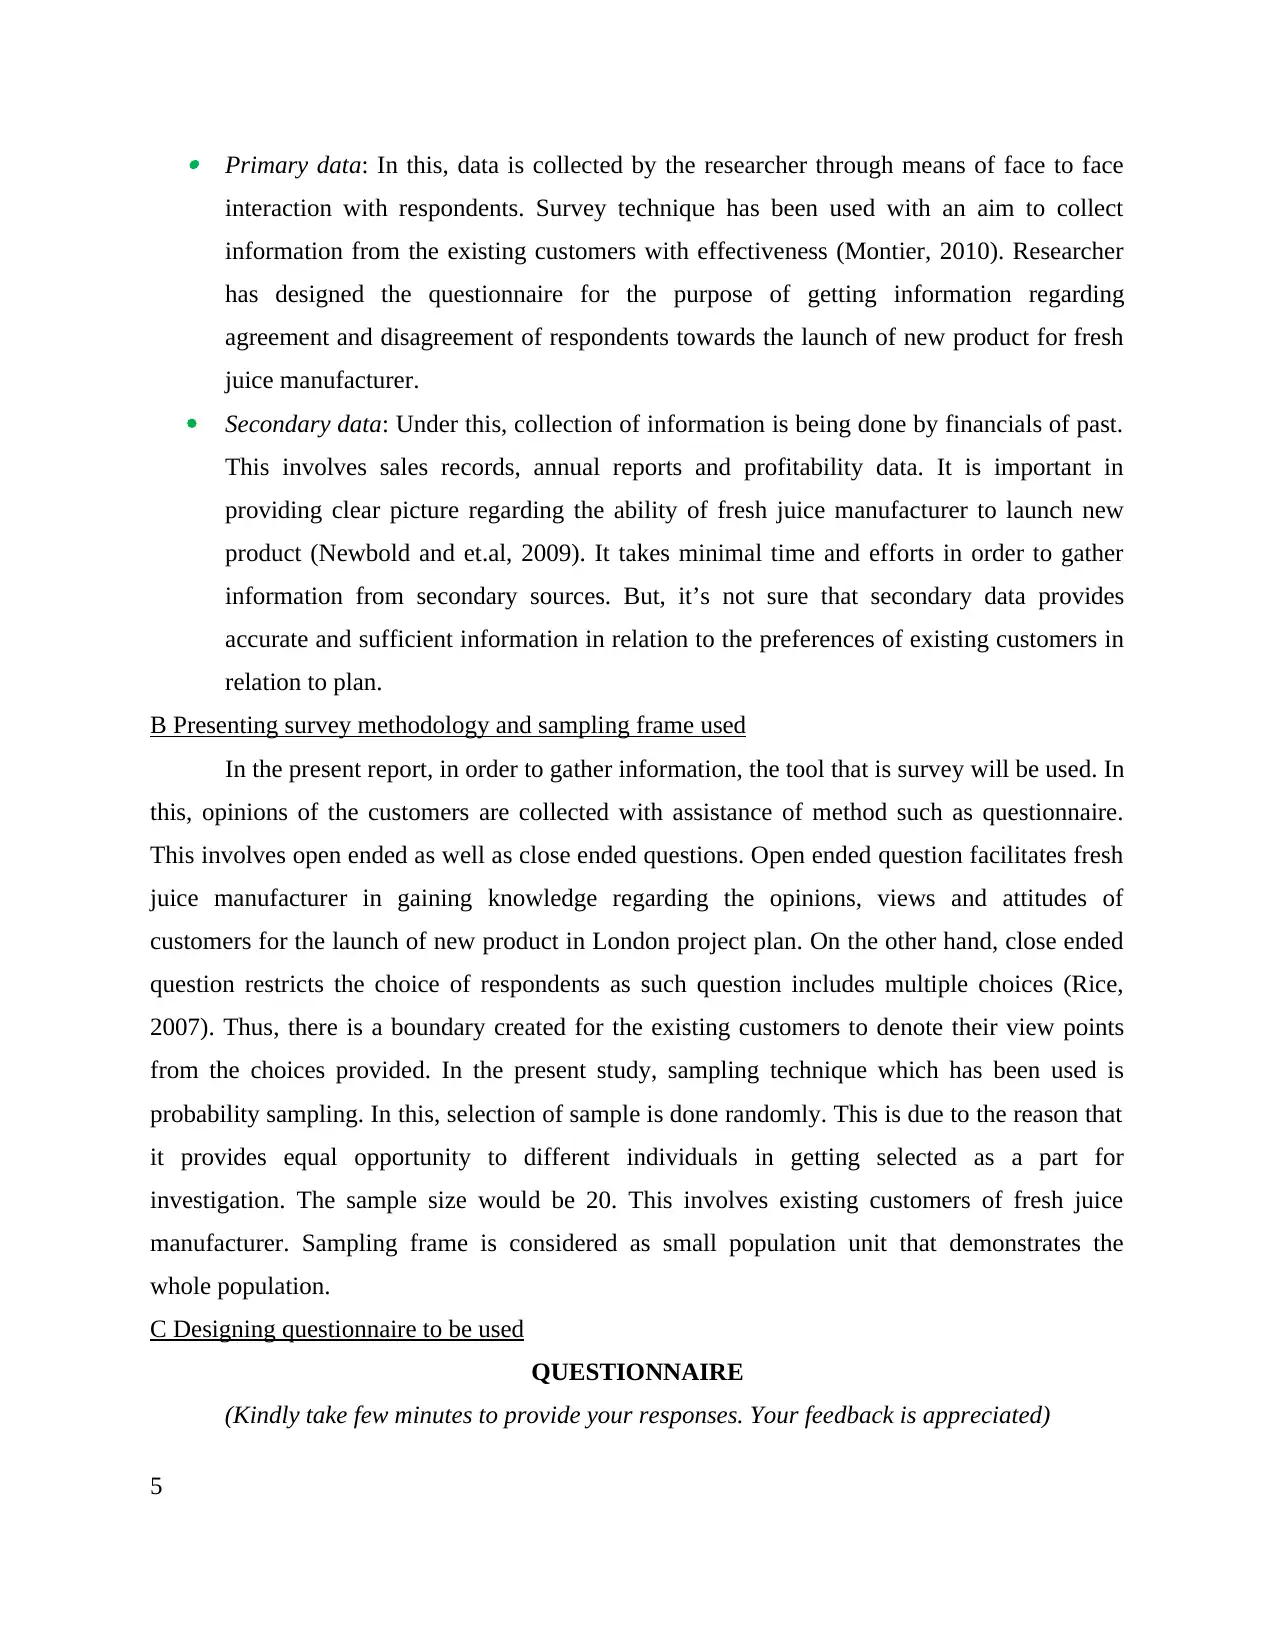
Primary data: In this, data is collected by the researcher through means of face to face
interaction with respondents. Survey technique has been used with an aim to collect
information from the existing customers with effectiveness (Montier, 2010). Researcher
has designed the questionnaire for the purpose of getting information regarding
agreement and disagreement of respondents towards the launch of new product for fresh
juice manufacturer.
Secondary data: Under this, collection of information is being done by financials of past.
This involves sales records, annual reports and profitability data. It is important in
providing clear picture regarding the ability of fresh juice manufacturer to launch new
product (Newbold and et.al, 2009). It takes minimal time and efforts in order to gather
information from secondary sources. But, it’s not sure that secondary data provides
accurate and sufficient information in relation to the preferences of existing customers in
relation to plan.
B Presenting survey methodology and sampling frame used
In the present report, in order to gather information, the tool that is survey will be used. In
this, opinions of the customers are collected with assistance of method such as questionnaire.
This involves open ended as well as close ended questions. Open ended question facilitates fresh
juice manufacturer in gaining knowledge regarding the opinions, views and attitudes of
customers for the launch of new product in London project plan. On the other hand, close ended
question restricts the choice of respondents as such question includes multiple choices (Rice,
2007). Thus, there is a boundary created for the existing customers to denote their view points
from the choices provided. In the present study, sampling technique which has been used is
probability sampling. In this, selection of sample is done randomly. This is due to the reason that
it provides equal opportunity to different individuals in getting selected as a part for
investigation. The sample size would be 20. This involves existing customers of fresh juice
manufacturer. Sampling frame is considered as small population unit that demonstrates the
whole population.
C Designing questionnaire to be used
QUESTIONNAIRE
(Kindly take few minutes to provide your responses. Your feedback is appreciated)
5
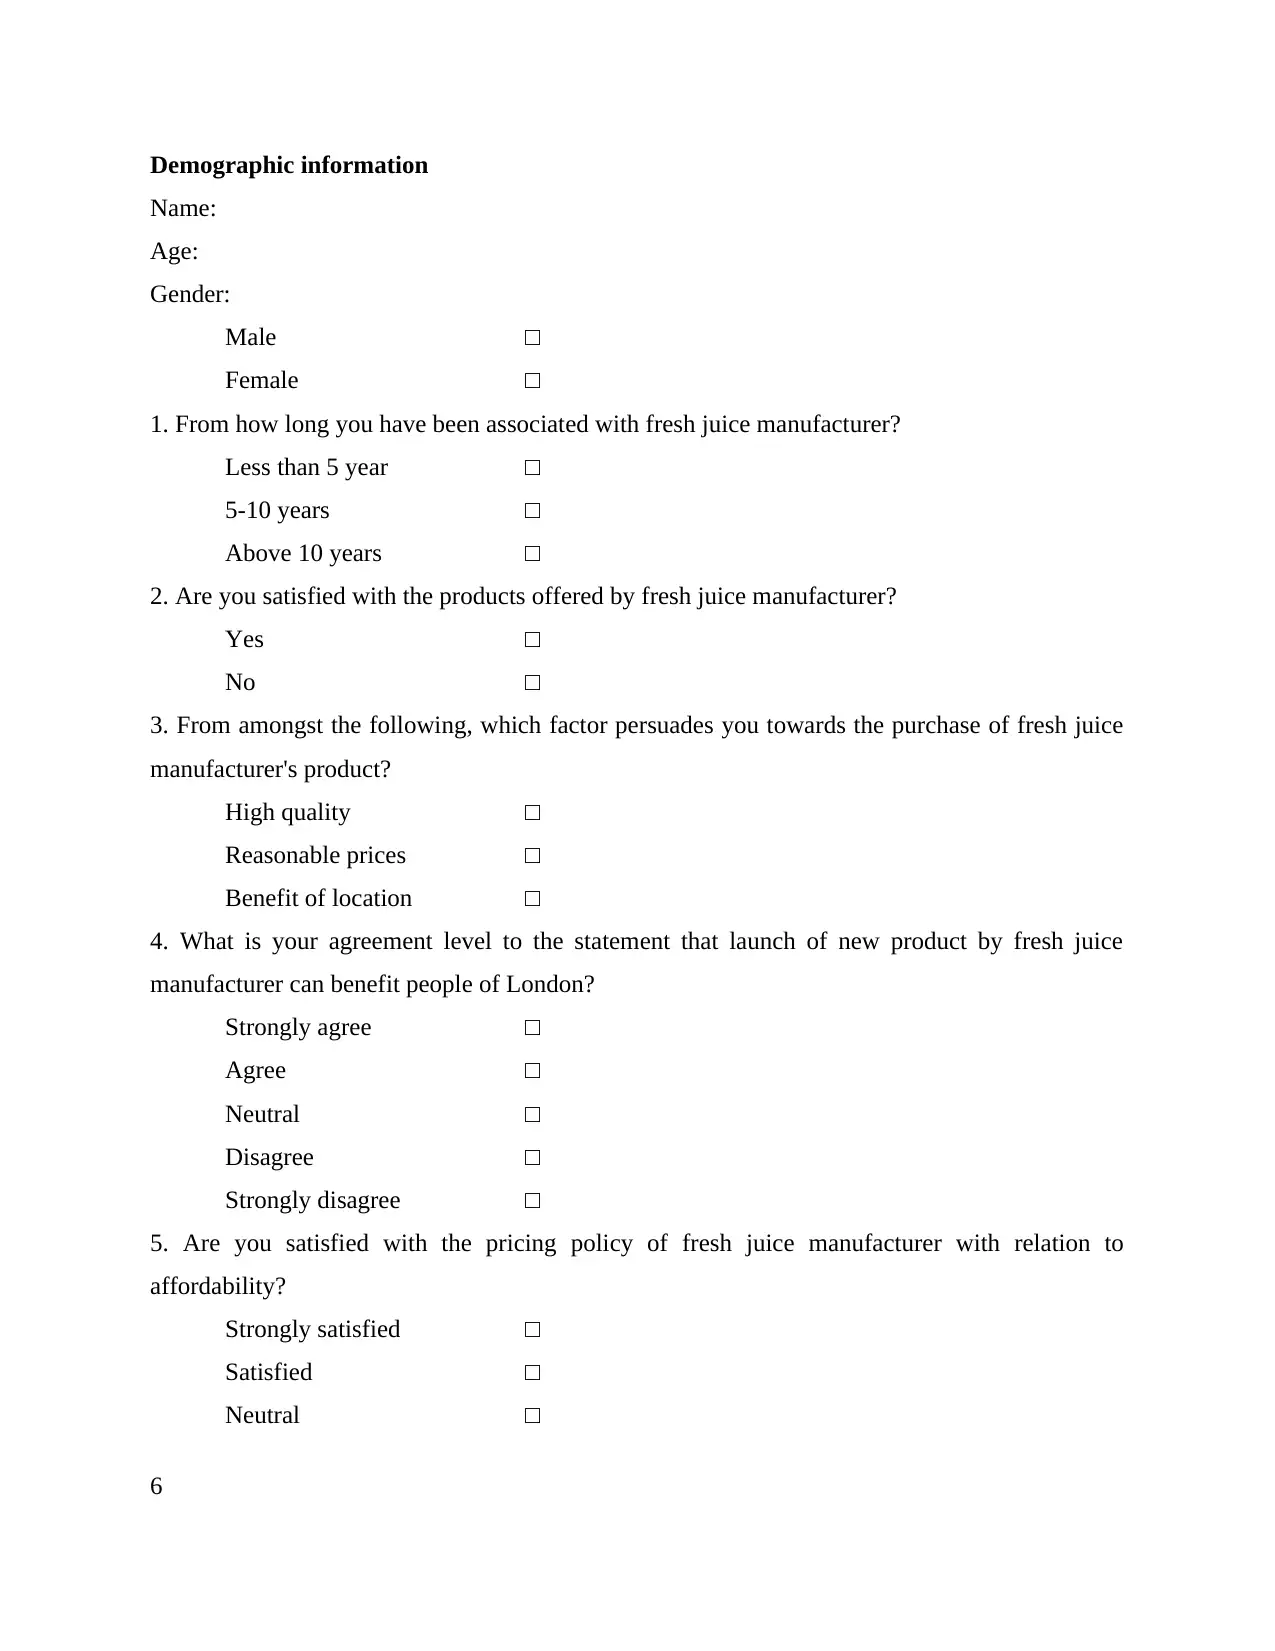
Demographic information
Name:
Age:
Gender:
Male □
Female □
1. From how long you have been associated with fresh juice manufacturer?
Less than 5 year □
5-10 years □
Above 10 years □
2. Are you satisfied with the products offered by fresh juice manufacturer?
Yes □
No □
3. From amongst the following, which factor persuades you towards the purchase of fresh juice
manufacturer's product?
High quality □
Reasonable prices □
Benefit of location □
4. What is your agreement level to the statement that launch of new product by fresh juice
manufacturer can benefit people of London?
Strongly agree □
Agree □
Neutral □
Disagree □
Strongly disagree □
5. Are you satisfied with the pricing policy of fresh juice manufacturer with relation to
affordability?
Strongly satisfied □
Satisfied □
Neutral □
6
⊘ This is a preview!⊘
Do you want full access?
Subscribe today to unlock all pages.
Trusted by 1+ million students worldwide
Dissatisfied □
Strongly dissatisfied □
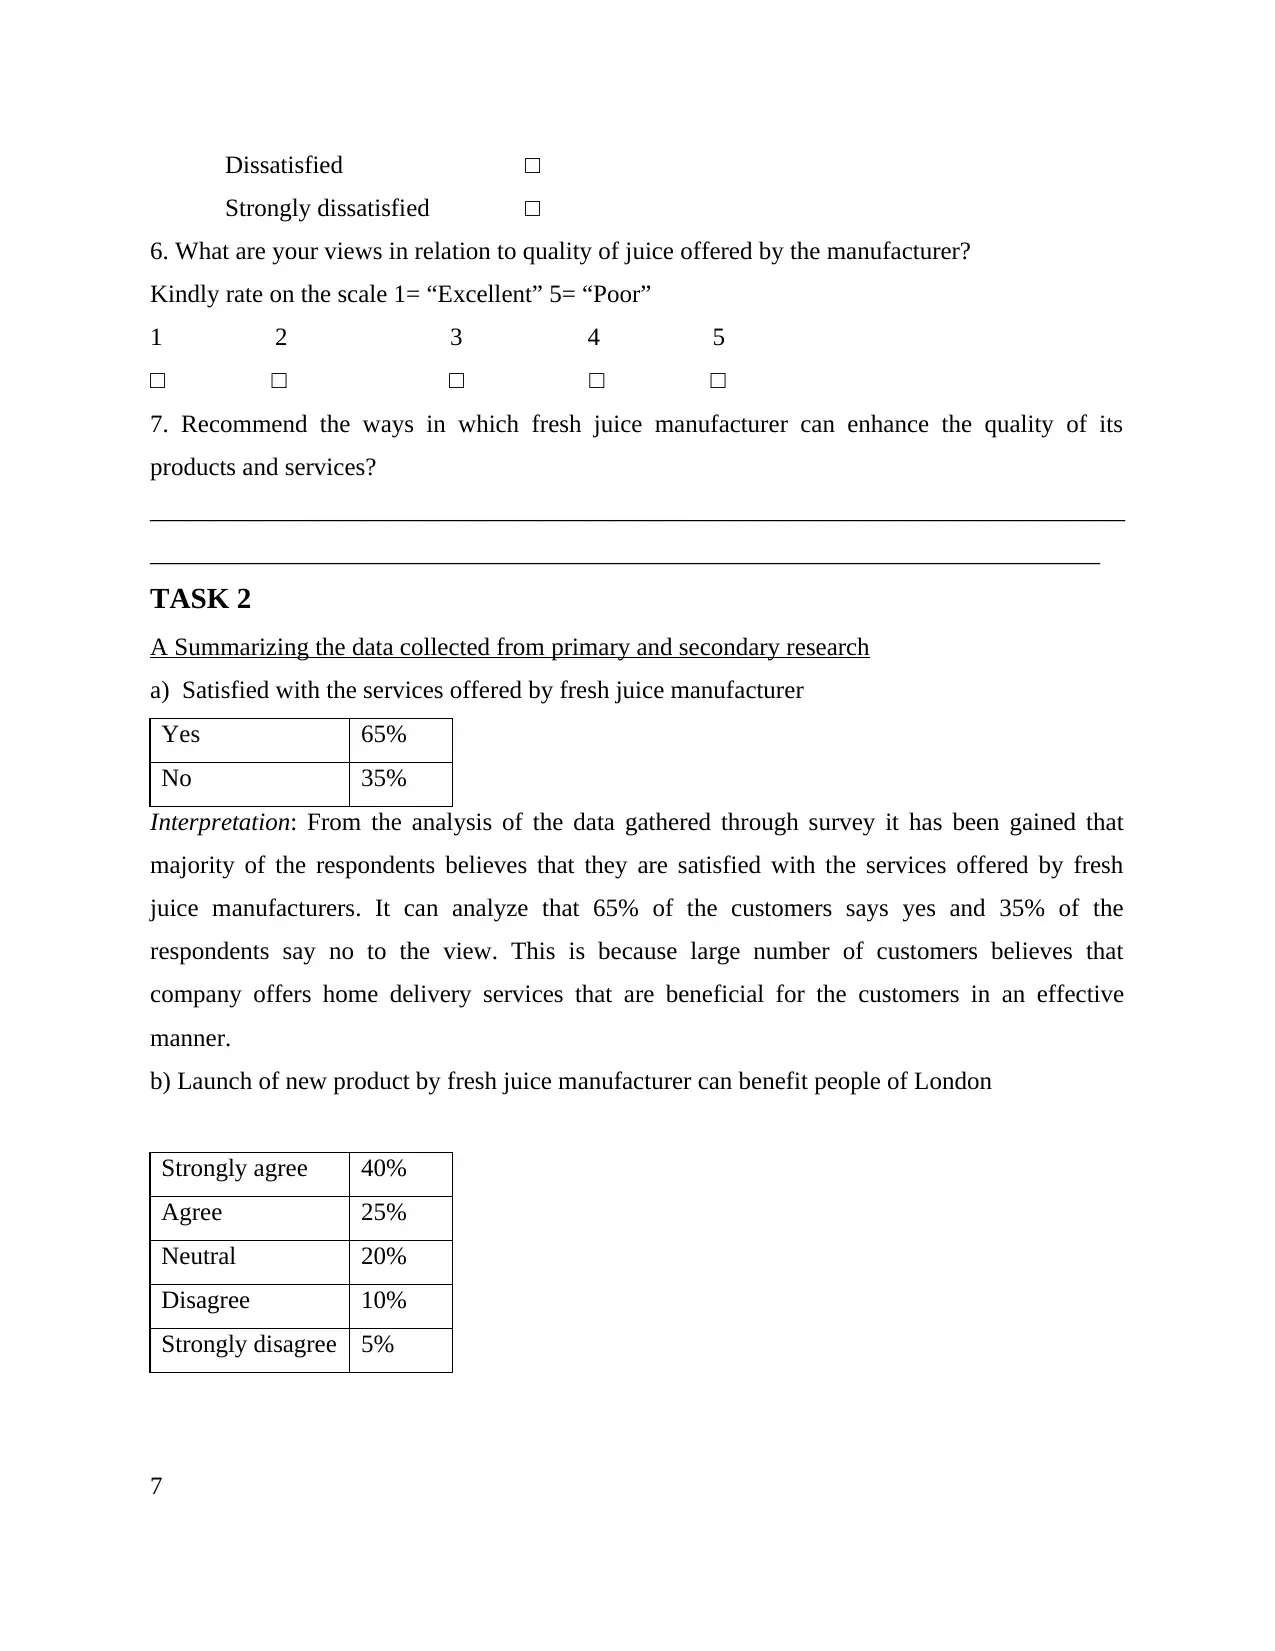
6. What are your views in relation to quality of juice offered by the manufacturer?
Kindly rate on the scale 1= “Excellent” 5= “Poor”
1 2 3 4 5
□ □ □ □ □
7. Recommend the ways in which fresh juice manufacturer can enhance the quality of its
products and services?
______________________________________________________________________________
____________________________________________________________________________
TASK 2
A Summarizing the data collected from primary and secondary research
a) Satisfied with the services offered by fresh juice manufacturer
Yes 65%
No 35%
Interpretation: From the analysis of the data gathered through survey it has been gained that
majority of the respondents believes that they are satisfied with the services offered by fresh
juice manufacturers. It can analyze that 65% of the customers says yes and 35% of the
respondents say no to the view. This is because large number of customers believes that
company offers home delivery services that are beneficial for the customers in an effective
manner.
b) Launch of new product by fresh juice manufacturer can benefit people of London
Strongly agree 40%
Agree 25%
Neutral 20%
Disagree 10%
Strongly disagree 5%
7
Strongly dissatisfied □
6. What are your views in relation to quality of juice offered by the manufacturer?
Kindly rate on the scale 1= “Excellent” 5= “Poor”
1 2 3 4 5
□ □ □ □ □
7. Recommend the ways in which fresh juice manufacturer can enhance the quality of its
products and services?
______________________________________________________________________________
____________________________________________________________________________
TASK 2
A Summarizing the data collected from primary and secondary research
a) Satisfied with the services offered by fresh juice manufacturer
Yes 65%
No 35%
Interpretation: From the analysis of the data gathered through survey it has been gained that
majority of the respondents believes that they are satisfied with the services offered by fresh
juice manufacturers. It can analyze that 65% of the customers says yes and 35% of the
respondents say no to the view. This is because large number of customers believes that
company offers home delivery services that are beneficial for the customers in an effective
manner.
b) Launch of new product by fresh juice manufacturer can benefit people of London
Strongly agree 40%
Agree 25%
Neutral 20%
Disagree 10%
Strongly disagree 5%
7
Paraphrase This Document
Need a fresh take? Get an instant paraphrase of this document with our AI Paraphraser
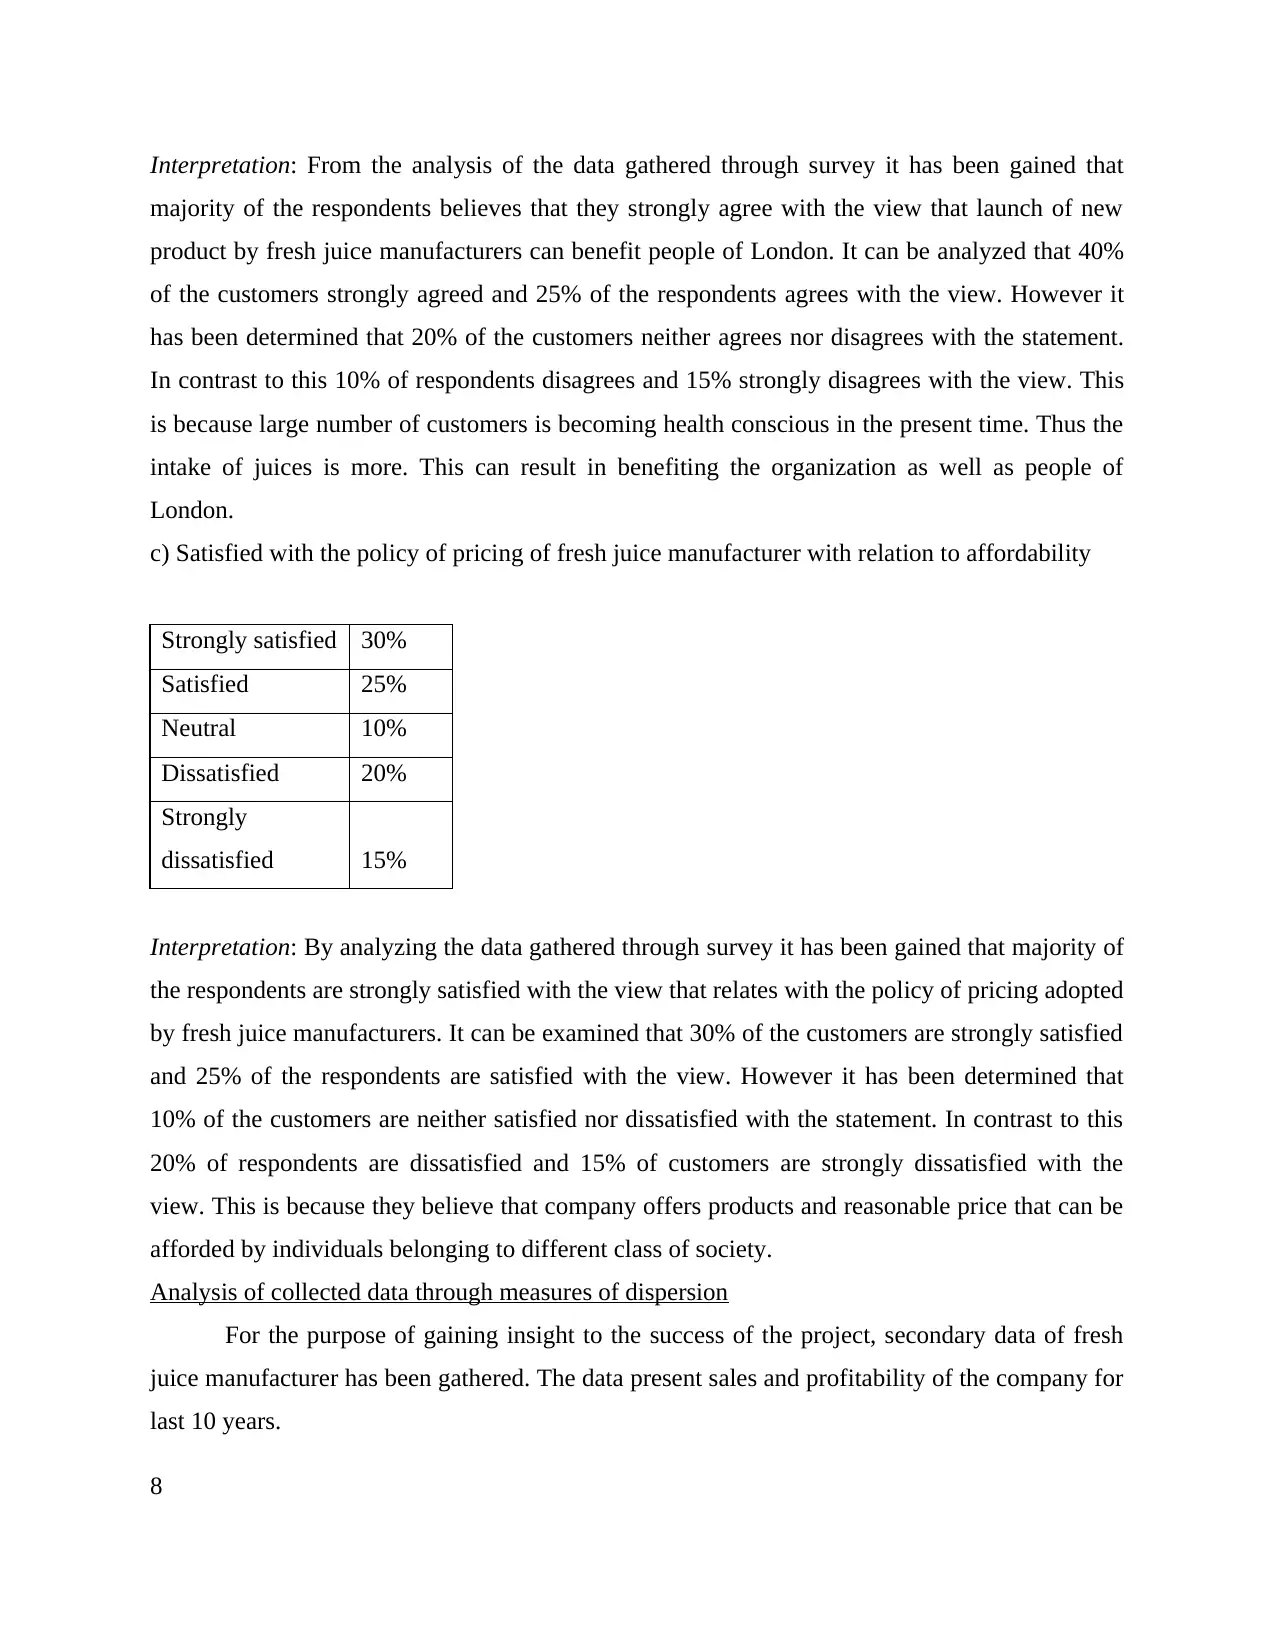
Interpretation: From the analysis of the data gathered through survey it has been gained that
majority of the respondents believes that they strongly agree with the view that launch of new
product by fresh juice manufacturers can benefit people of London. It can be analyzed that 40%
of the customers strongly agreed and 25% of the respondents agrees with the view. However it
has been determined that 20% of the customers neither agrees nor disagrees with the statement.
In contrast to this 10% of respondents disagrees and 15% strongly disagrees with the view. This
is because large number of customers is becoming health conscious in the present time. Thus the
intake of juices is more. This can result in benefiting the organization as well as people of
London.
c) Satisfied with the policy of pricing of fresh juice manufacturer with relation to affordability
Strongly satisfied 30%
Satisfied 25%
Neutral 10%
Dissatisfied 20%
Strongly
dissatisfied 15%
Interpretation: By analyzing the data gathered through survey it has been gained that majority of
the respondents are strongly satisfied with the view that relates with the policy of pricing adopted
by fresh juice manufacturers. It can be examined that 30% of the customers are strongly satisfied
and 25% of the respondents are satisfied with the view. However it has been determined that
10% of the customers are neither satisfied nor dissatisfied with the statement. In contrast to this
20% of respondents are dissatisfied and 15% of customers are strongly dissatisfied with the
view. This is because they believe that company offers products and reasonable price that can be
afforded by individuals belonging to different class of society.
Analysis of collected data through measures of dispersion
For the purpose of gaining insight to the success of the project, secondary data of fresh
juice manufacturer has been gathered. The data present sales and profitability of the company for
last 10 years.
8
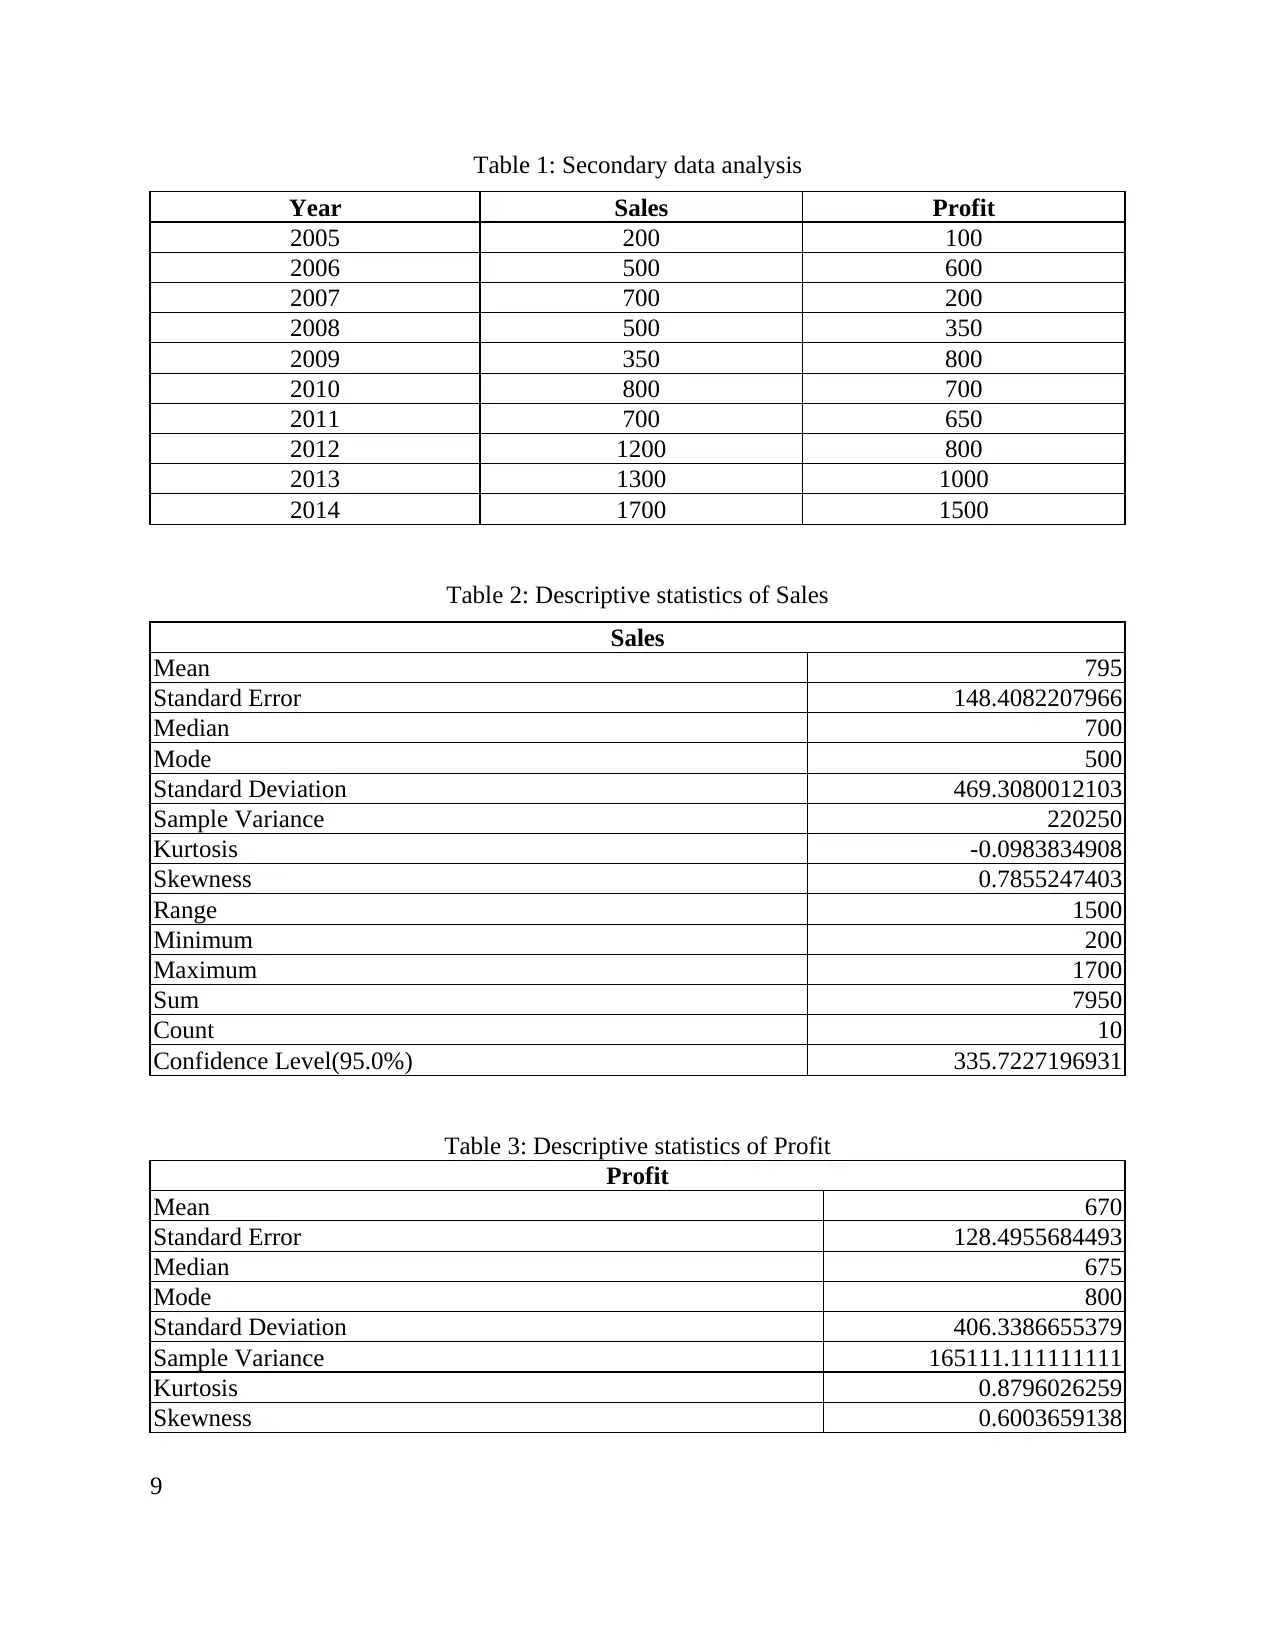
Table 1: Secondary data analysis
Year Sales Profit
2005 200 100
2006 500 600
2007 700 200
2008 500 350
2009 350 800
2010 800 700
2011 700 650
2012 1200 800
2013 1300 1000
2014 1700 1500
Table 2: Descriptive statistics of Sales
Sales
Mean 795
Standard Error 148.4082207966
Median 700
Mode 500
Standard Deviation 469.3080012103
Sample Variance 220250
Kurtosis -0.0983834908
Skewness 0.7855247403
Range 1500
Minimum 200
Maximum 1700
Sum 7950
Count 10
Confidence Level(95.0%) 335.7227196931
Table 3: Descriptive statistics of Profit
Profit
Mean 670
Standard Error 128.4955684493
Median 675
Mode 800
Standard Deviation 406.3386655379
Sample Variance 165111.111111111
Kurtosis 0.8796026259
Skewness 0.6003659138
9
⊘ This is a preview!⊘
Do you want full access?
Subscribe today to unlock all pages.
Trusted by 1+ million students worldwide
Range 1400
Minimum 100
Maximum 1500
Sum 6700
Count 10
Confidence Level(95.0%) 290.6771705554
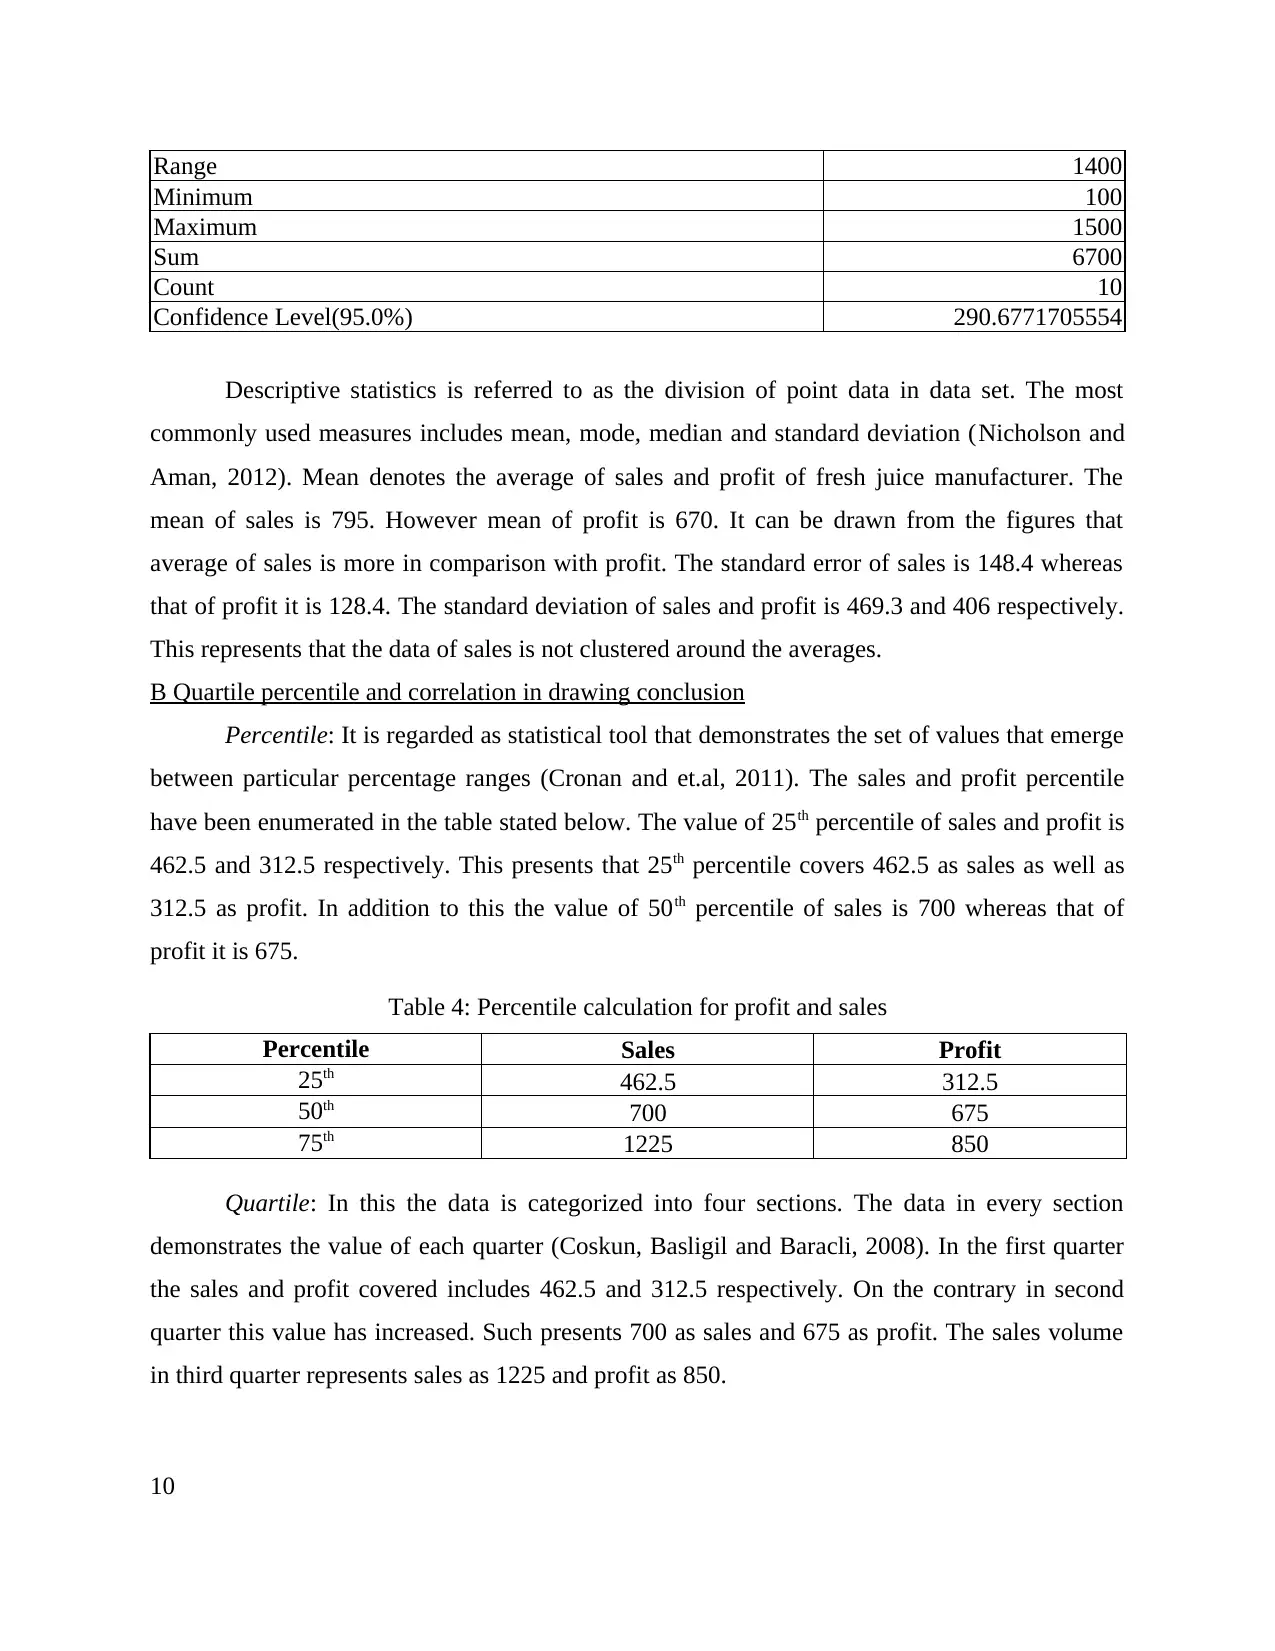
Descriptive statistics is referred to as the division of point data in data set. The most
commonly used measures includes mean, mode, median and standard deviation (Nicholson and
Aman, 2012). Mean denotes the average of sales and profit of fresh juice manufacturer. The
mean of sales is 795. However mean of profit is 670. It can be drawn from the figures that
average of sales is more in comparison with profit. The standard error of sales is 148.4 whereas
that of profit it is 128.4. The standard deviation of sales and profit is 469.3 and 406 respectively.
This represents that the data of sales is not clustered around the averages.
B Quartile percentile and correlation in drawing conclusion
Percentile: It is regarded as statistical tool that demonstrates the set of values that emerge
between particular percentage ranges (Cronan and et.al, 2011). The sales and profit percentile
have been enumerated in the table stated below. The value of 25th percentile of sales and profit is
462.5 and 312.5 respectively. This presents that 25th percentile covers 462.5 as sales as well as
312.5 as profit. In addition to this the value of 50th percentile of sales is 700 whereas that of
profit it is 675.
Table 4: Percentile calculation for profit and sales
Percentile Sales Profit
25th 462.5 312.5
50th 700 675
75th 1225 850
Quartile: In this the data is categorized into four sections. The data in every section
demonstrates the value of each quarter (Coskun, Basligil and Baracli, 2008). In the first quarter
the sales and profit covered includes 462.5 and 312.5 respectively. On the contrary in second
quarter this value has increased. Such presents 700 as sales and 675 as profit. The sales volume
in third quarter represents sales as 1225 and profit as 850.
10
Minimum 100
Maximum 1500
Sum 6700
Count 10
Confidence Level(95.0%) 290.6771705554
Descriptive statistics is referred to as the division of point data in data set. The most
commonly used measures includes mean, mode, median and standard deviation (Nicholson and
Aman, 2012). Mean denotes the average of sales and profit of fresh juice manufacturer. The
mean of sales is 795. However mean of profit is 670. It can be drawn from the figures that
average of sales is more in comparison with profit. The standard error of sales is 148.4 whereas
that of profit it is 128.4. The standard deviation of sales and profit is 469.3 and 406 respectively.
This represents that the data of sales is not clustered around the averages.
B Quartile percentile and correlation in drawing conclusion
Percentile: It is regarded as statistical tool that demonstrates the set of values that emerge
between particular percentage ranges (Cronan and et.al, 2011). The sales and profit percentile
have been enumerated in the table stated below. The value of 25th percentile of sales and profit is
462.5 and 312.5 respectively. This presents that 25th percentile covers 462.5 as sales as well as
312.5 as profit. In addition to this the value of 50th percentile of sales is 700 whereas that of
profit it is 675.
Table 4: Percentile calculation for profit and sales
Percentile Sales Profit
25th 462.5 312.5
50th 700 675
75th 1225 850
Quartile: In this the data is categorized into four sections. The data in every section
demonstrates the value of each quarter (Coskun, Basligil and Baracli, 2008). In the first quarter
the sales and profit covered includes 462.5 and 312.5 respectively. On the contrary in second
quarter this value has increased. Such presents 700 as sales and 675 as profit. The sales volume
in third quarter represents sales as 1225 and profit as 850.
10
Paraphrase This Document
Need a fresh take? Get an instant paraphrase of this document with our AI Paraphraser
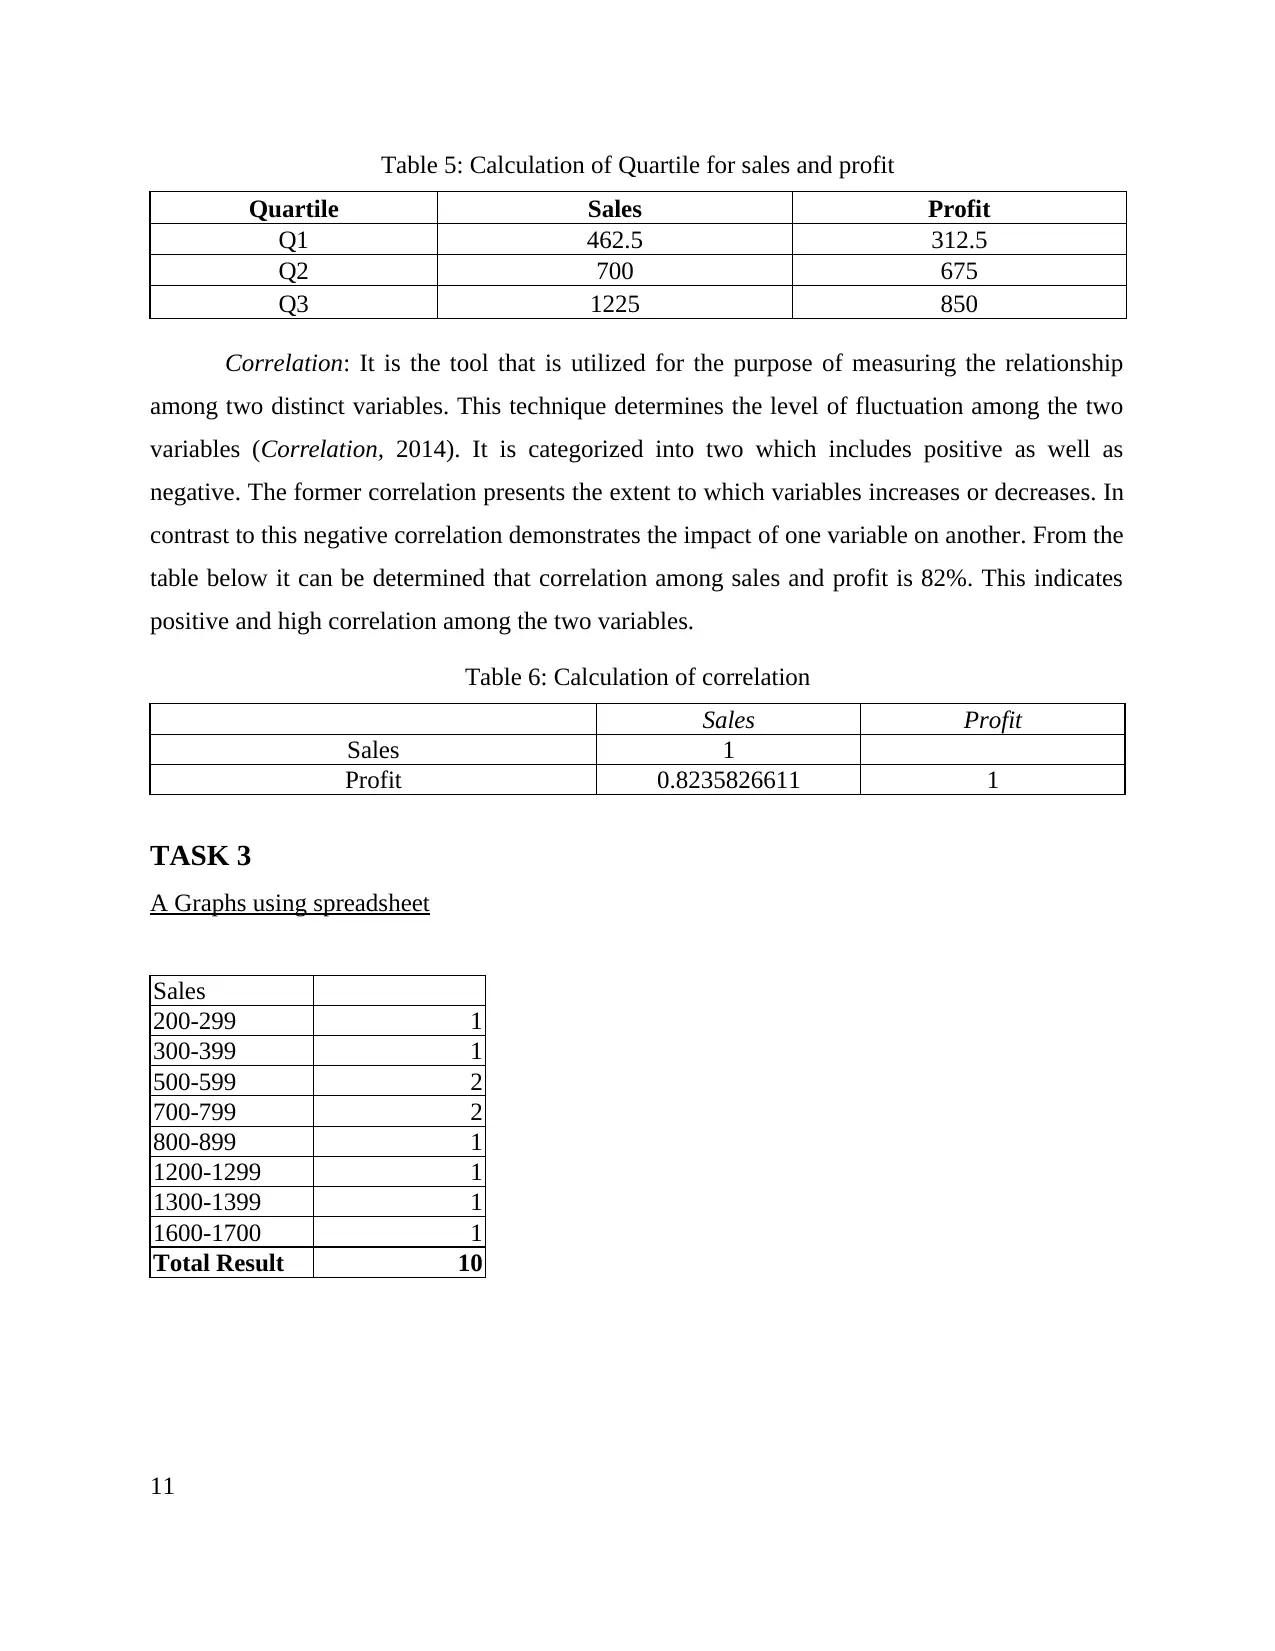
Table 5: Calculation of Quartile for sales and profit
Quartile Sales Profit
Q1 462.5 312.5
Q2 700 675
Q3 1225 850
Correlation: It is the tool that is utilized for the purpose of measuring the relationship
among two distinct variables. This technique determines the level of fluctuation among the two
variables (Correlation, 2014). It is categorized into two which includes positive as well as
negative. The former correlation presents the extent to which variables increases or decreases. In
contrast to this negative correlation demonstrates the impact of one variable on another. From the
table below it can be determined that correlation among sales and profit is 82%. This indicates
positive and high correlation among the two variables.
Table 6: Calculation of correlation
Sales Profit
Sales 1
Profit 0.8235826611 1
TASK 3
A Graphs using spreadsheet
Sales
200-299 1
300-399 1
500-599 2
700-799 2
800-899 1
1200-1299 1
1300-1399 1
1600-1700 1
Total Result 10
11
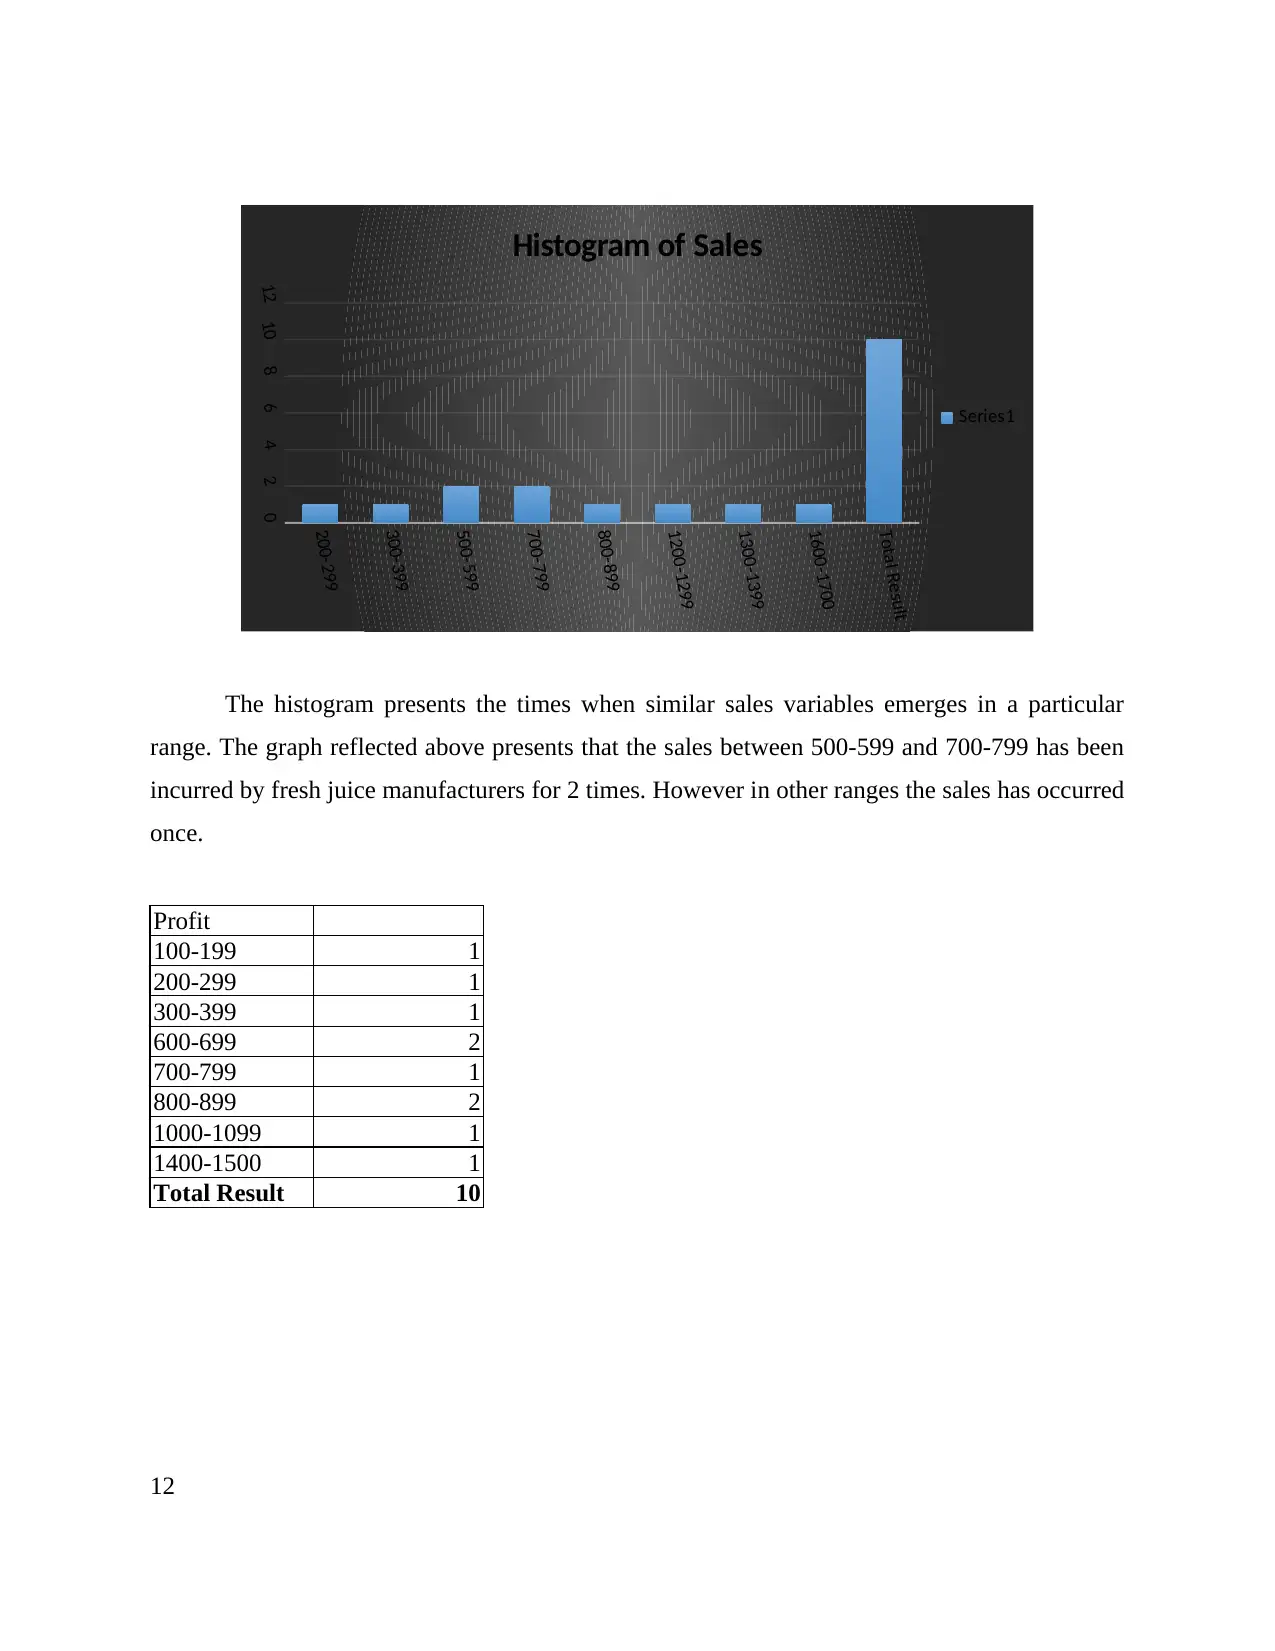
The histogram presents the times when similar sales variables emerges in a particular
range. The graph reflected above presents that the sales between 500-599 and 700-799 has been
incurred by fresh juice manufacturers for 2 times. However in other ranges the sales has occurred
once.
Profit
100-199 1
200-299 1
300-399 1
600-699 2
700-799 1
800-899 2
1000-1099 1
1400-1500 1
Total Result 10
12
200-299
300-399
500-599
700-799
800-899
1200-1299
1300-1399
1600-1700
Total Result
024681012
Histogram of Sales
Series1
⊘ This is a preview!⊘
Do you want full access?
Subscribe today to unlock all pages.
Trusted by 1+ million students worldwide
1 out of 25
Related Documents


Your All-in-One AI-Powered Toolkit for Academic Success.
+13062052269
info@desklib.com
Available 24*7 on WhatsApp / Email
![[object Object]](/_next/static/media/star-bottom.7253800d.svg)
Unlock your academic potential
Copyright © 2020–2026 A2Z Services. All Rights Reserved. Developed and managed by ZUCOL.