HND Business Decision Making Report: Statistical Analysis and Findings
VerifiedAdded on 2019/12/03
|20
|4145
|394
Report
AI Summary
This report, submitted by a student, focuses on business decision-making processes, specifically for a Fresh Juice Manufacturer Company in London. It begins with an introduction to statistical analysis and its importance in business, followed by Task 1 which details primary and secondary data collection methods, including consumer profiles, preferences, attitudes, and buying behavior. The report outlines survey methodologies, sampling frames, and the preparation of questionnaires. Task 2 summarizes the collected data using frequency tables, and statistical measures like mean, median, and standard deviation. Task 3 involves data analysis and interpretation through various charts and graphical presentations. The report also includes a formal business report and a project plan for launching a new fresh juice drink in Task 4, concluding with a financial viability assessment. The report provides a detailed overview of the research methods used and analysis performed to make data-driven business decisions. This assignment is designed to demonstrate the student's understanding of data analysis and its application in a real-world business scenario.

BUSINESS
DECISION
MAKING
1 | P a g e
DECISION
MAKING
1 | P a g e
Paraphrase This Document
Need a fresh take? Get an instant paraphrase of this document with our AI Paraphraser
Table of Contents
INTRODUCTION......................................................................................................................1
TASK 1......................................................................................................................................1
(A) Primary and secondary research.....................................................................................1
(B) Survey methodology and sampling frame:......................................................................2
(C) Preparation of questionnaire............................................................................................3
TASK 2......................................................................................................................................5
(A) Summarization of primary and secondary collected data:..............................................5
(B) Quartile, percentile deviation and correlation ..............................................................11
TASK 3....................................................................................................................................12
(A) Analysis and interpretation through different types of charts.......................................12
(B) Trend Line and chart for analytical purpose.................................................................13
(C)Analysis through Graphical presentation.......................................................................14
(D) Formal Business Report................................................................................................14
TASK 4....................................................................................................................................14
Project Plan of launching a new fresh juice drink ..............................................................14
CONCLUSION........................................................................................................................16
REFERENCES.........................................................................................................................17
2 | P a g e
INTRODUCTION
Statistical analysis is a component of data analysis. It is the study of collection,
analysis, interpretation and organization of data. It is very important for every organization to
continue analyse the data by various statistical and financial methods. In this report, we
identify the methods of data collection for Fresh juice Manufacturer Company in London.
Moreover, Survey will be conducted for such purpose (Black, 2011). In addition to it,
different statistical methods will be used to analyse the data such as Frequency table,
Average, dispersion and correlation. The report also helps in identifying the financial
viability of the project by with reference to cost and revenues.
TASK 1
(A) Primary and secondary research
Data collection is a term used to describe a process of preparing and collecting data.
Data research can be done for different purposes according to the requirement. Data can be
collected by two sources primary as well as secondary sources.
Primary data: The data which are collected for the first time, called primary data.
This is the original data collected by the investigator itself (Zsambok and Klein, 2014). It
may be of two kinds Quantitative and qualitative research. Quantitative research can be
collected from sampling method.
Secondary data: This type of data are prior collected by someone for their purpose,
also called published source of data. It may be of two kinds Internal as well as External
sources. Internal source include organizations previous records or statements whereas
external source of data include journals, books, magazine and newspaper. Primary and
secondary research for fresh juice drinks with subject to consumer profile, preference;
attitude and buying behaviour are explained below:
Consumer Profile: It is a way of describing consumer categorically so that they can be
grouped for marketing and advertising purpose (Bazerman and Moore, 2012). It helps to
classify the customer on the basis of various factors such as demographic, education, and
psychological. Primary data for consumer profile can be collected through field research by
investigator itself. However, Secondary data can be collected from trade and business
association.
Consumer preference: It refers to the choice of customer for variety of goods
available in the market for fresh Juice Drinks such as Tropicana, Real, Fresh gold and Leh
3 | P a g e
⊘ This is a preview!⊘
Do you want full access?
Subscribe today to unlock all pages.
Trusted by 1+ million students worldwide
berry. Primary data for such purpose can be collected by experiments. However, secondary
data may be collected by newspapers and previous year industrial sales.
Attitude and Buying Behaviour: Consumers have a positive general attitude towards
the consumption of fruit juice. Consumer behaviour is driven by optimisation of nutrition.
However, attitude is defined as a kind of psychological tendency with some degree of likes
and dislikes. It is also affected by various factors such as cultural, social and personal factors.
Primary data can be collected by questionnaire method and secondary data can be collected
by published economic reports and commercial service reports (Kimmel, Weygandt and
Kieso, 2010).
(B) Survey methodology and sampling frame:
Surveys are important for getting specific information for various purposes. It is the
primary source of data and includes field research. In field research firstly, researcher should
set the target market in which survey will be conducted. Thereafter investigator should
identify the type of field research it can be done through Questionnaire method. Furthermore,
it helps to identify the type of information according to the objective of investigator.
Questionnaire can be filled by investigator itself through personal interview and also can be
filled by customers themselves. It is a set of questions to gather different type of information
such as customer preferences, their attitude and purchasing behaviour (Pettigrew, 2014). T. It
is the best method when resources are limited and data are required from various type of
customers. In such method, all the information can be collected by drafting an appropriate
questionnaire. It should include all type of questions which fulfil the investigator
requirement. It is very confidential source of data and the information collected truly
represent the situation. However, if it is filled by researcher himself then bias may arise.
Moreover, Web based questionnaire may be used in it will be send through email. Therefore,
information can be collected from widespread area (Jerry, Paul. and Donald, 2009). Hence, it
is considered as best method for Fruit Juice Company to identify the customer preferences,
their choice, and attitude also the behaviour.
Sampling: It refers to the selection of sample from a target population to conduct a
survey. It is very convenient way to identify the behaviour of the entire universe based on the
representative sample. It can be classified into two types such as probability sampling and
non probability sampling (Black, 2011). In probability sampling each member of the
population has a known probability whereas in non probability sampling probability is
unknown.
4 | P a g e
Paraphrase This Document
Need a fresh take? Get an instant paraphrase of this document with our AI Paraphraser
Random Sampling: It is the purest form of probability sampling. In such sample, each
member of the sample has an equal chance of inclusion in sample. Sampling error also can be
calculated in it. Therefore, in case of very large population it is the very difficult to identify
each member so it will be considered as best method.
Non Random Sampling: it is another kind of sample and often used for speed and
convenience. In such type of sampling technique, sample is determined on the basis of some
factor (Robert, 2010). It includes quota sampling techniques and sampling error cannot be
computed in it.
Therefore, it is clear that to know about customer choice, behaviour, attitude and their
profile of fruit juice company random sampling will be best method because in it bias is
eliminated (Albright and Winston, 2014). In this report, sample of 25 Customers will be
taken for such purpose.
(C) Preparation of questionnaire
Name: ____________
Age: ______________
Gender: ___________
Email id: _______________________
Telephone-----------------------------------
What kind of fruit juice you often use to drink?
o Tropicana Juice
o Apple and Rhubarb Juice
o Pear Juice
o Other (please specify)_______
In last week, how many times did you consume such fruit juice?
o Twice in a week
o Thrice in a week
o Daily
How much do you spend on preferred juice product per day?
5 | P a g e
o Less than £10
o £10 to £20
o More than £20
With whom do you often drink such fruit juice?
o Alone
o With family members
o With friends
o With a group
From where do you like to purchase this?
o Specialized shops
o Super markets
o Other (please specify) _________________
Which of the following is important factor to you, when deciding about such juice?
o Price
o Quality
o Quantity
o Other(specify)
Does this fruit juice satisfy your nutrition requirement completely?
o Yes
o No
Do you think prices of preferred fruit juice are under your purchasing power?
o Yes
o No
Will you prefer to consume this fruit juice in future also?
o Yes
6 | P a g e
⊘ This is a preview!⊘
Do you want full access?
Subscribe today to unlock all pages.
Trusted by 1+ million students worldwide
o No
Are you satisfied with the quality of fruit juice being offered by the fruit juice?
o Yes
o No
TASK 2
(A) Summarization of primary and secondary collected data:
After collecting data, it can be summarized by preparing frequency table. The
frequency of a particular data value is the number of times the data occurs. Frequency table is
constructed by arranging all collected data in a series with their corresponding frequencies
(Bajpai, 2009).
Primary data analysis
Frequency table to know consumer behaviour and preference for variety of fresh
juice by questionnaire method for 25 consumers is explained below:
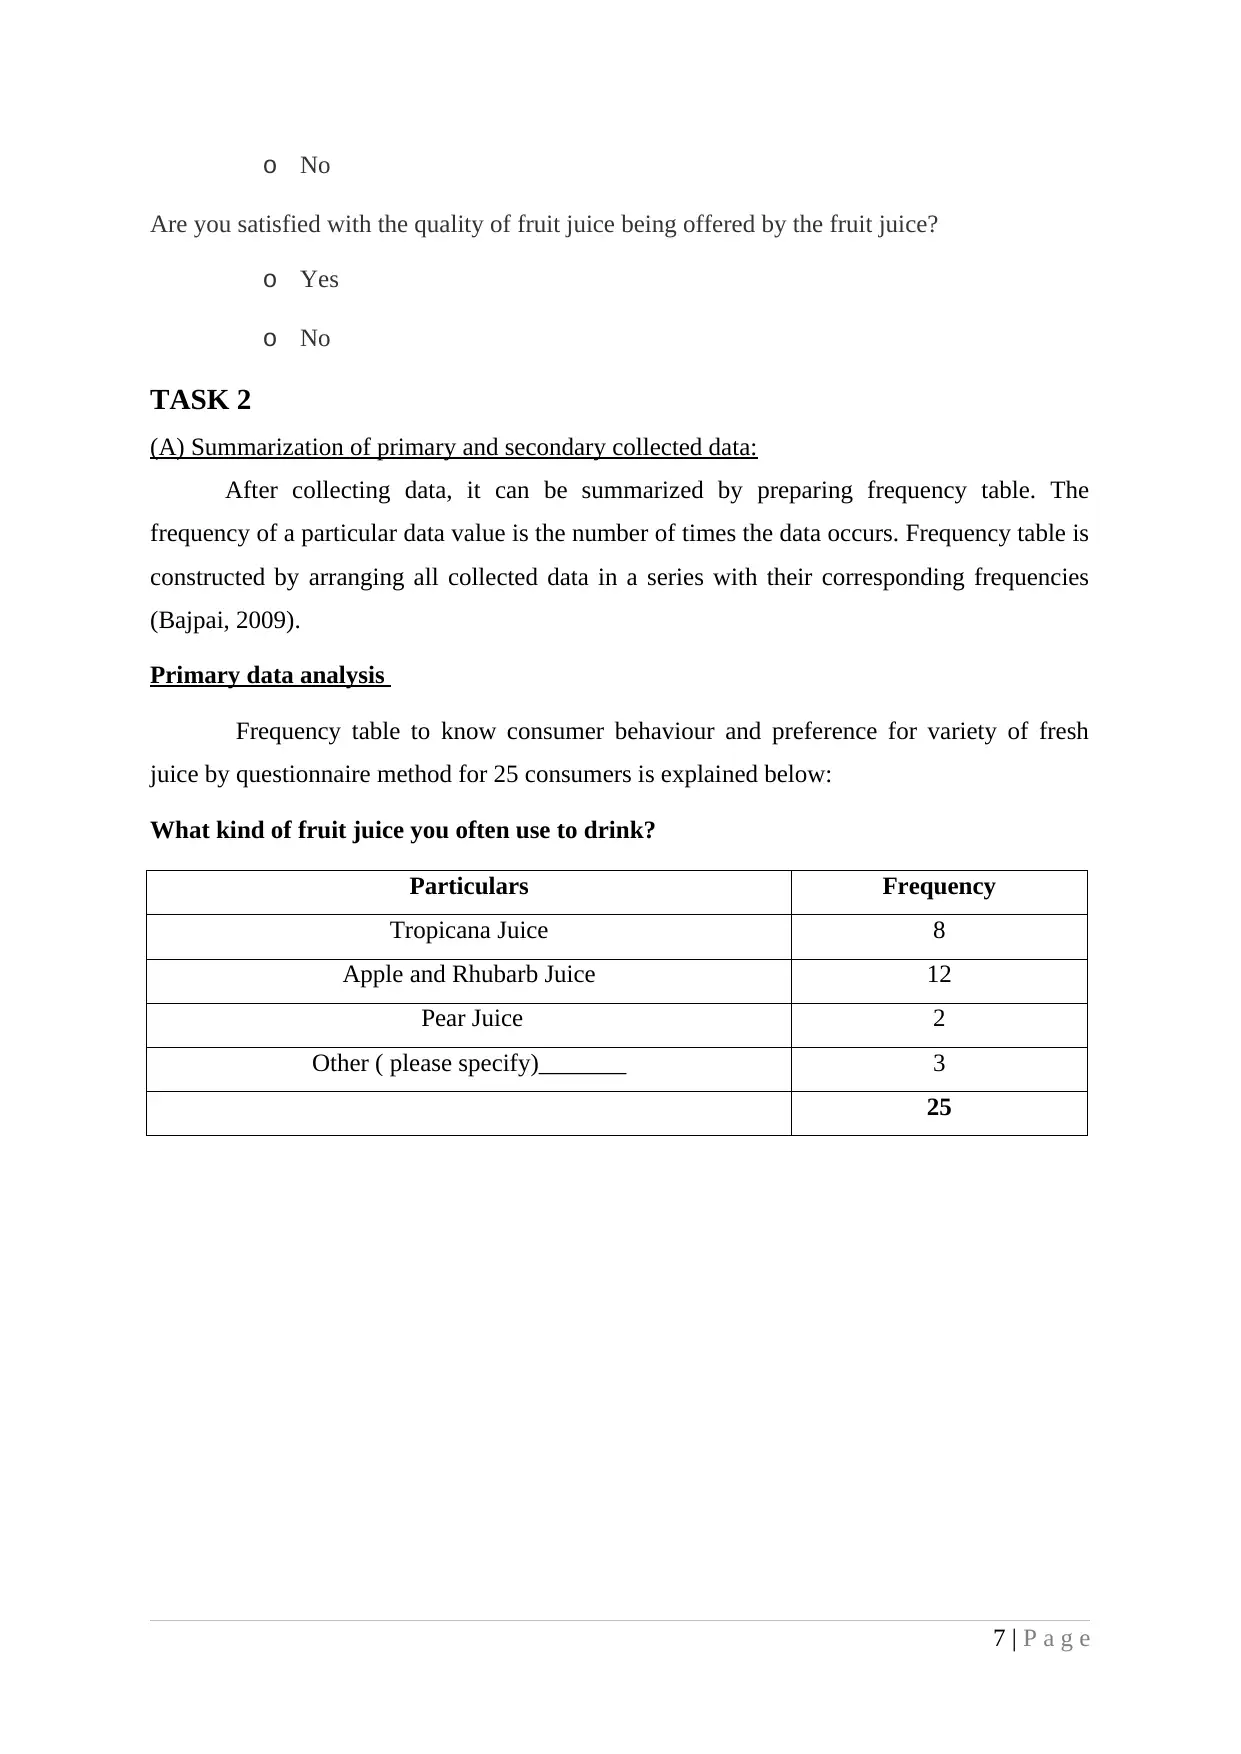
What kind of fruit juice you often use to drink?
Particulars Frequency
Tropicana Juice 8
Apple and Rhubarb Juice 12
Pear Juice 2
Other ( please specify)_______ 3
25
7 | P a g e
Are you satisfied with the quality of fruit juice being offered by the fruit juice?
o Yes
o No
TASK 2
(A) Summarization of primary and secondary collected data:
After collecting data, it can be summarized by preparing frequency table. The
frequency of a particular data value is the number of times the data occurs. Frequency table is
constructed by arranging all collected data in a series with their corresponding frequencies
(Bajpai, 2009).
Primary data analysis
Frequency table to know consumer behaviour and preference for variety of fresh
juice by questionnaire method for 25 consumers is explained below:
What kind of fruit juice you often use to drink?
Particulars Frequency
Tropicana Juice 8
Apple and Rhubarb Juice 12
Pear Juice 2
Other ( please specify)_______ 3
25
7 | P a g e
Paraphrase This Document
Need a fresh take? Get an instant paraphrase of this document with our AI Paraphraser
This chart represents an analysis of 25 customers about their choices for different
types of juice. 8 customers like Tropicana juice and 12 Customers like apple and rhubarb
juice. However, only 2 customers prefer pear juice and 3 customers will prefer other juice.
Therefore, it is clear that large number of customers prefer apple and rhubarb juice. Thus,
there is a great chance of higher sales of such type of juice.
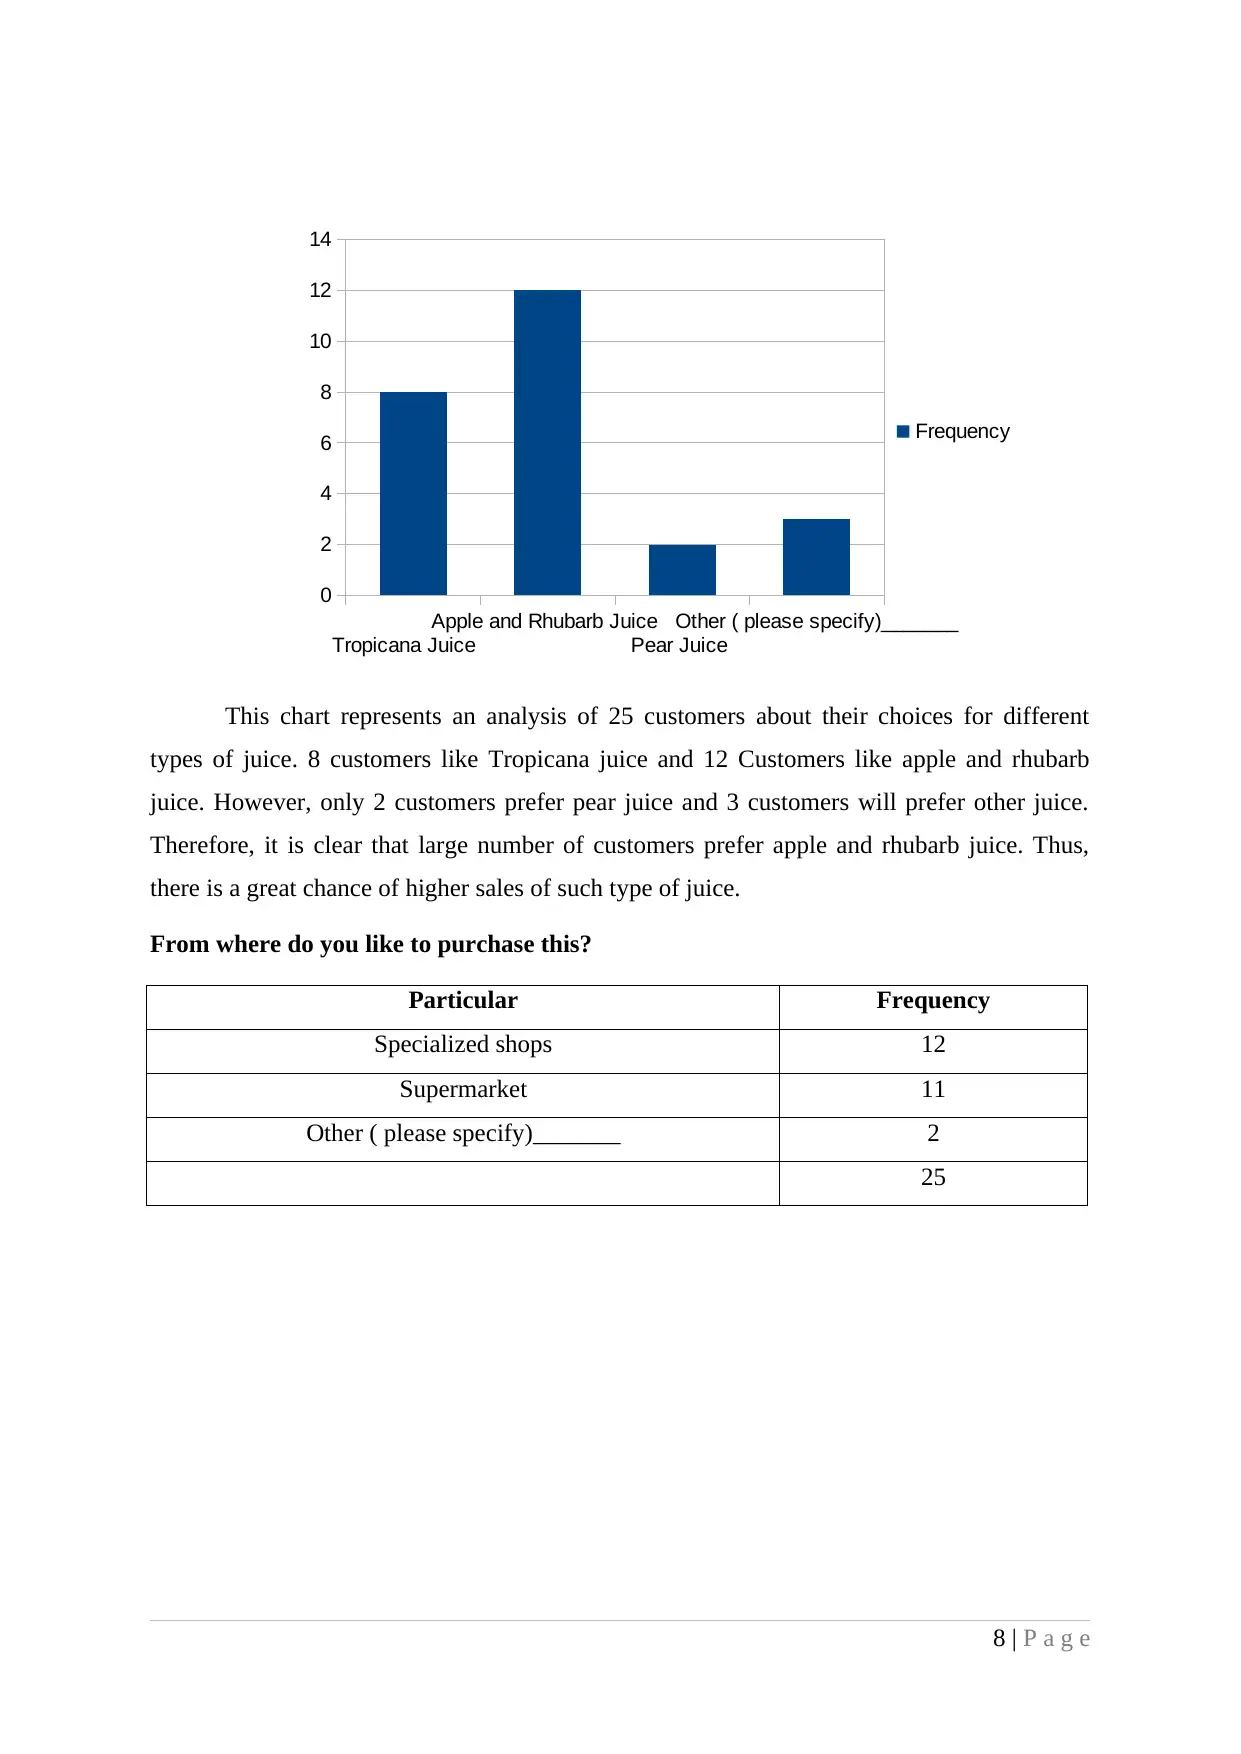
From where do you like to purchase this?
Particular Frequency
Specialized shops 12
Supermarket 11
Other ( please specify)_______ 2
25
8 | P a g e
Tropicana Juice
Apple and Rhubarb Juice
Pear Juice
Other ( please specify)_______
0
2
4
6
8
10
12
14
Frequency
types of juice. 8 customers like Tropicana juice and 12 Customers like apple and rhubarb
juice. However, only 2 customers prefer pear juice and 3 customers will prefer other juice.
Therefore, it is clear that large number of customers prefer apple and rhubarb juice. Thus,
there is a great chance of higher sales of such type of juice.
From where do you like to purchase this?
Particular Frequency
Specialized shops 12
Supermarket 11
Other ( please specify)_______ 2
25
8 | P a g e
Tropicana Juice
Apple and Rhubarb Juice
Pear Juice
Other ( please specify)_______
0
2
4
6
8
10
12
14
Frequency
his chart represent that 12 customer purchase juice from specialized shops, 11
customers bought it from supermarket and only 2 customers will prefer other places.
Therefore, it shows customer buying behavior to purchase from specialized shops.
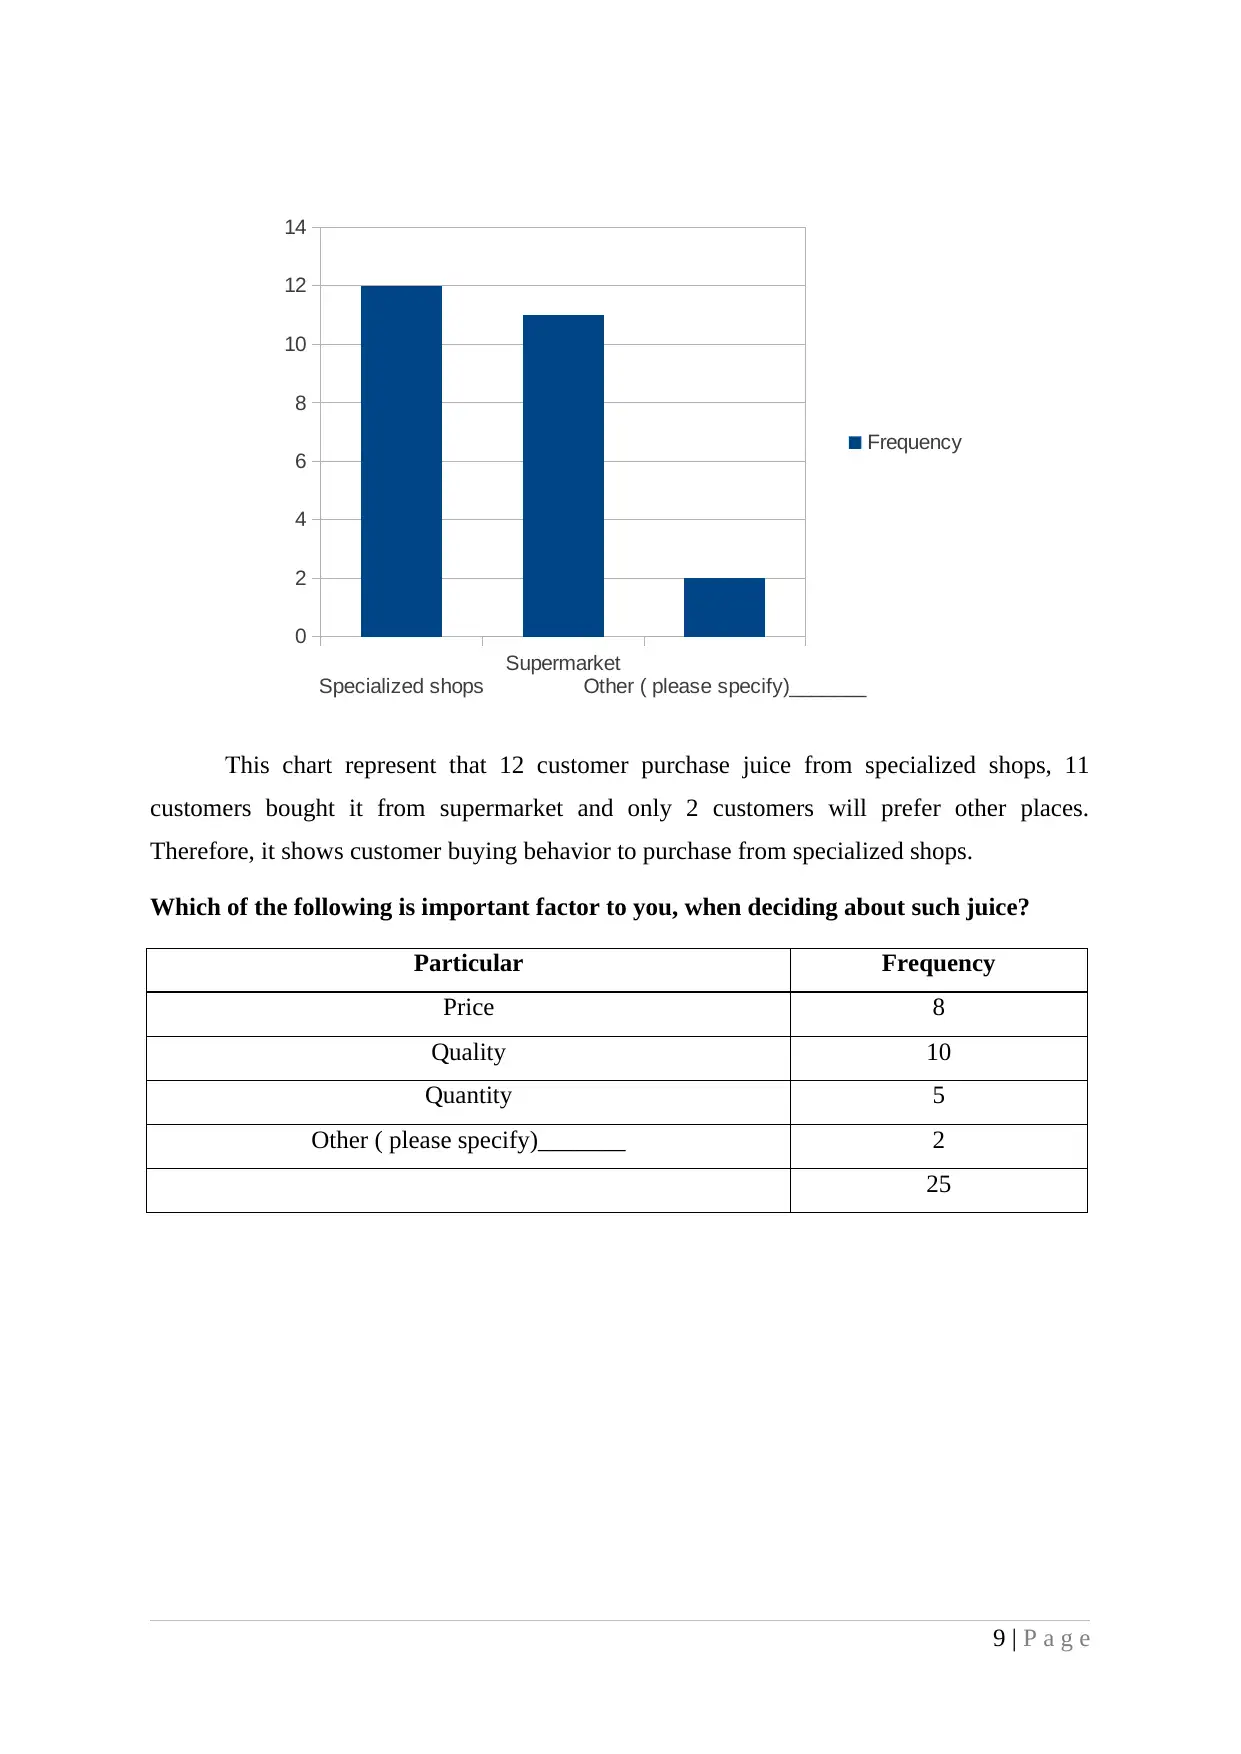
Which of the following is important factor to you, when deciding about such juice?
Particular Frequency
Price 8
Quality 10
Quantity 5
Other ( please specify)_______ 2
25
9 | P a g e
Specialized shops
Supermarket
Other ( please specify)_______
0
2
4
6
8
10
12
14
Frequency
customers bought it from supermarket and only 2 customers will prefer other places.
Therefore, it shows customer buying behavior to purchase from specialized shops.
Which of the following is important factor to you, when deciding about such juice?
Particular Frequency
Price 8
Quality 10
Quantity 5
Other ( please specify)_______ 2
25
9 | P a g e
Specialized shops
Supermarket
Other ( please specify)_______
0
2
4
6
8
10
12
14
Frequency
⊘ This is a preview!⊘
Do you want full access?
Subscribe today to unlock all pages.
Trusted by 1+ million students worldwide
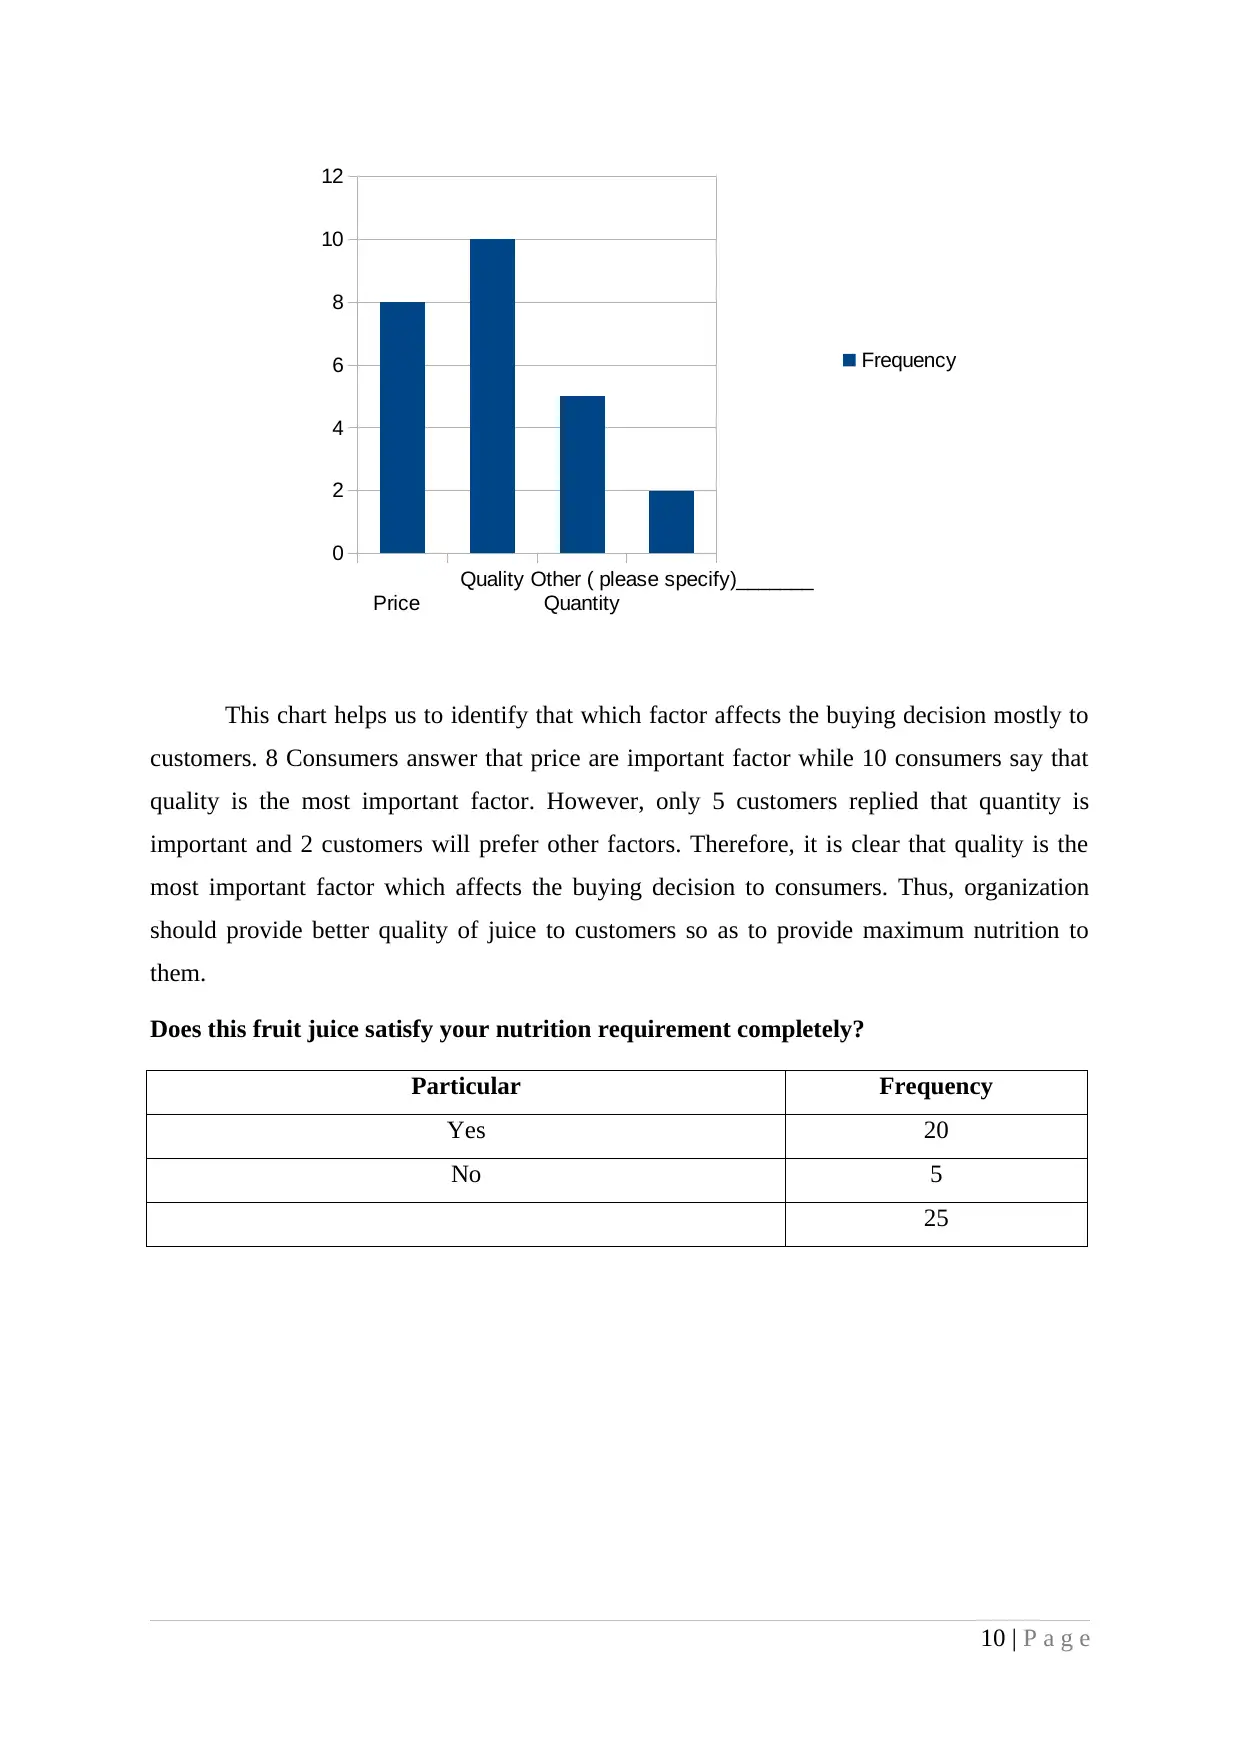
This chart helps us to identify that which factor affects the buying decision mostly to
customers. 8 Consumers answer that price are important factor while 10 consumers say that
quality is the most important factor. However, only 5 customers replied that quantity is
important and 2 customers will prefer other factors. Therefore, it is clear that quality is the
most important factor which affects the buying decision to consumers. Thus, organization
should provide better quality of juice to customers so as to provide maximum nutrition to
them.
Does this fruit juice satisfy your nutrition requirement completely?
Particular Frequency
Yes 20
No 5
25
10 | P a g e
Price
Quality
Quantity
Other ( please specify)_______
0
2
4
6
8
10
12
Frequency
Paraphrase This Document
Need a fresh take? Get an instant paraphrase of this document with our AI Paraphraser
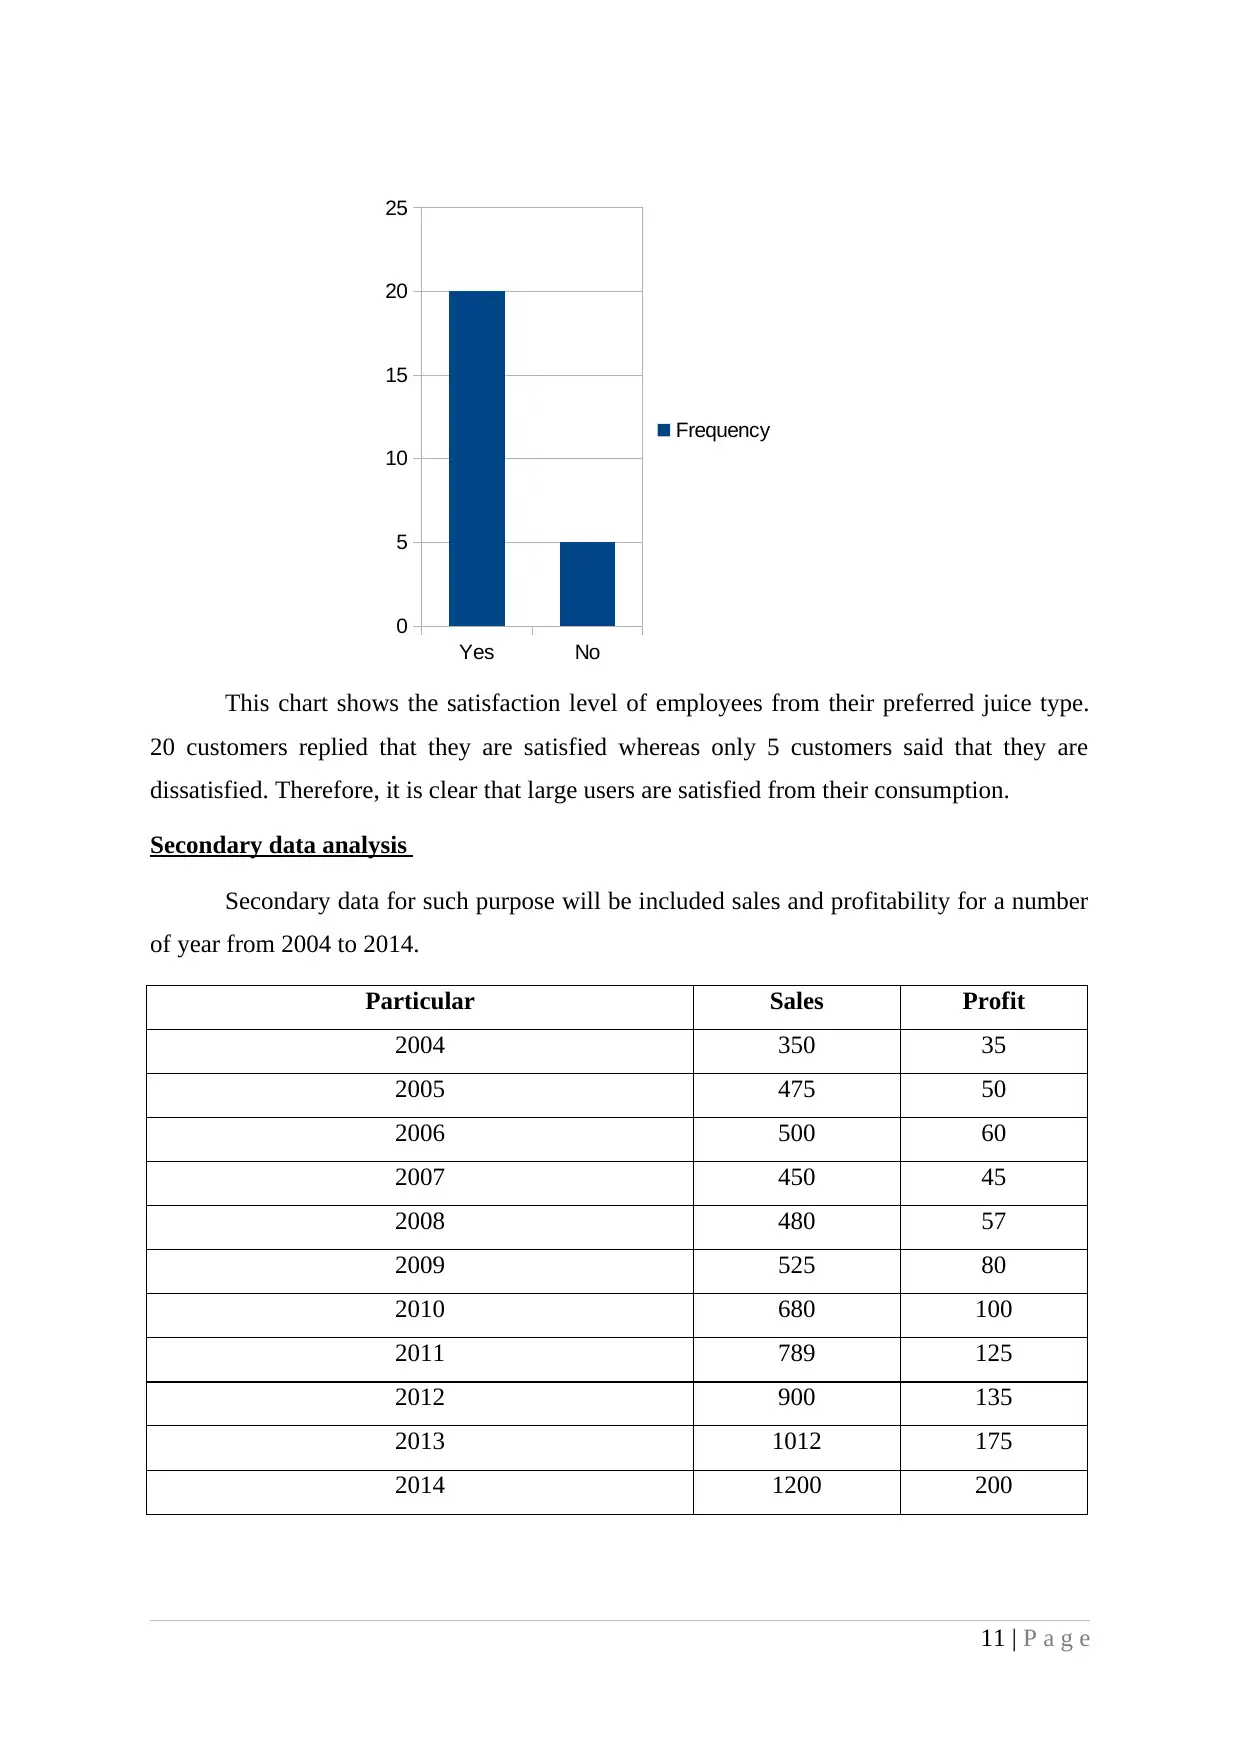
This chart shows the satisfaction level of employees from their preferred juice type.
20 customers replied that they are satisfied whereas only 5 customers said that they are
dissatisfied. Therefore, it is clear that large users are satisfied from their consumption.
Secondary data analysis
Secondary data for such purpose will be included sales and profitability for a number
of year from 2004 to 2014.
Particular Sales Profit
2004 350 35
2005 475 50
2006 500 60
2007 450 45
2008 480 57
2009 525 80
2010 680 100
2011 789 125
2012 900 135
2013 1012 175
2014 1200 200
11 | P a g e
Yes No
0
5
10
15
20
25
Frequency
The table shows the sales for the year 2004 was 350£ and it is continuously rising to
1200£ in 2014. Therefore, the profits are also increasing from 35£ in 2004 to 200£ in 2014.
Thus, it indicates that in UK consumption of juice are increasing so as to increase the
nutrition level of them. Hence, it is very beneficial for all the organization providing fresh
juice to customers.
Averages, measure of dispersion and other statistical measures: Measure of central
tendency, dispersion and other statistical measures for sales and profits are described below:
Mean 669.1818181818 Mean 96.5454545455
Standard Error 82.012617453 Standard Error 16.7719265638
Median 525 Median 80
Mode #N/A Mode #N/A
Standard Deviation 272.0050801665 Standard Deviation 55.6261874235
Sample Variance
73986.76363636
37 Sample Variance
3094.272727272
7
Kurtosis -0.3858007743 Kurtosis -0.6111887851
Skewness 0.8435485702 Skewness 0.7697360707
Range 850 Range 165
Minimum 350 Minimum 35
Maximum 1200 Maximum 200
Sum 7361 Sum 1062
Count 11 Count 11
Confidence Level(95.0%) 182.735498516 Confidence Level(95.0%) 37.3701810391
Representative values: Average of any series is identified as representative value of
the series. It is the measure of central tendency and also known as Mean value (Bertrand and
Fransoo, 2002). It is calculated by adding all the sales and profit values and then divided it to
number of years. The Mean value of sales and profit values are 669.18£ and 96.54£
respectively. It represent that in each year approximate 669.18£ sales will be made by the
companies also they earn profit of 96.54£ every year.
Measurement of Dispersion: Dispersion indicates the scatter of given series that how
data is spread out from the mean value. It can be identified by calculating range, variance and
standard deviation tools.
12 | P a g e
⊘ This is a preview!⊘
Do you want full access?
Subscribe today to unlock all pages.
Trusted by 1+ million students worldwide
1 out of 20
Related Documents


Your All-in-One AI-Powered Toolkit for Academic Success.
+13062052269
info@desklib.com
Available 24*7 on WhatsApp / Email
![[object Object]](/_next/static/media/star-bottom.7253800d.svg)
Unlock your academic potential
Copyright © 2020–2026 A2Z Services. All Rights Reserved. Developed and managed by ZUCOL.