HND Business L5: Data Analysis and Business Decision Making Report

Verified

Added on  2023/03/29

|12
|323
|218
Report
AI Summary
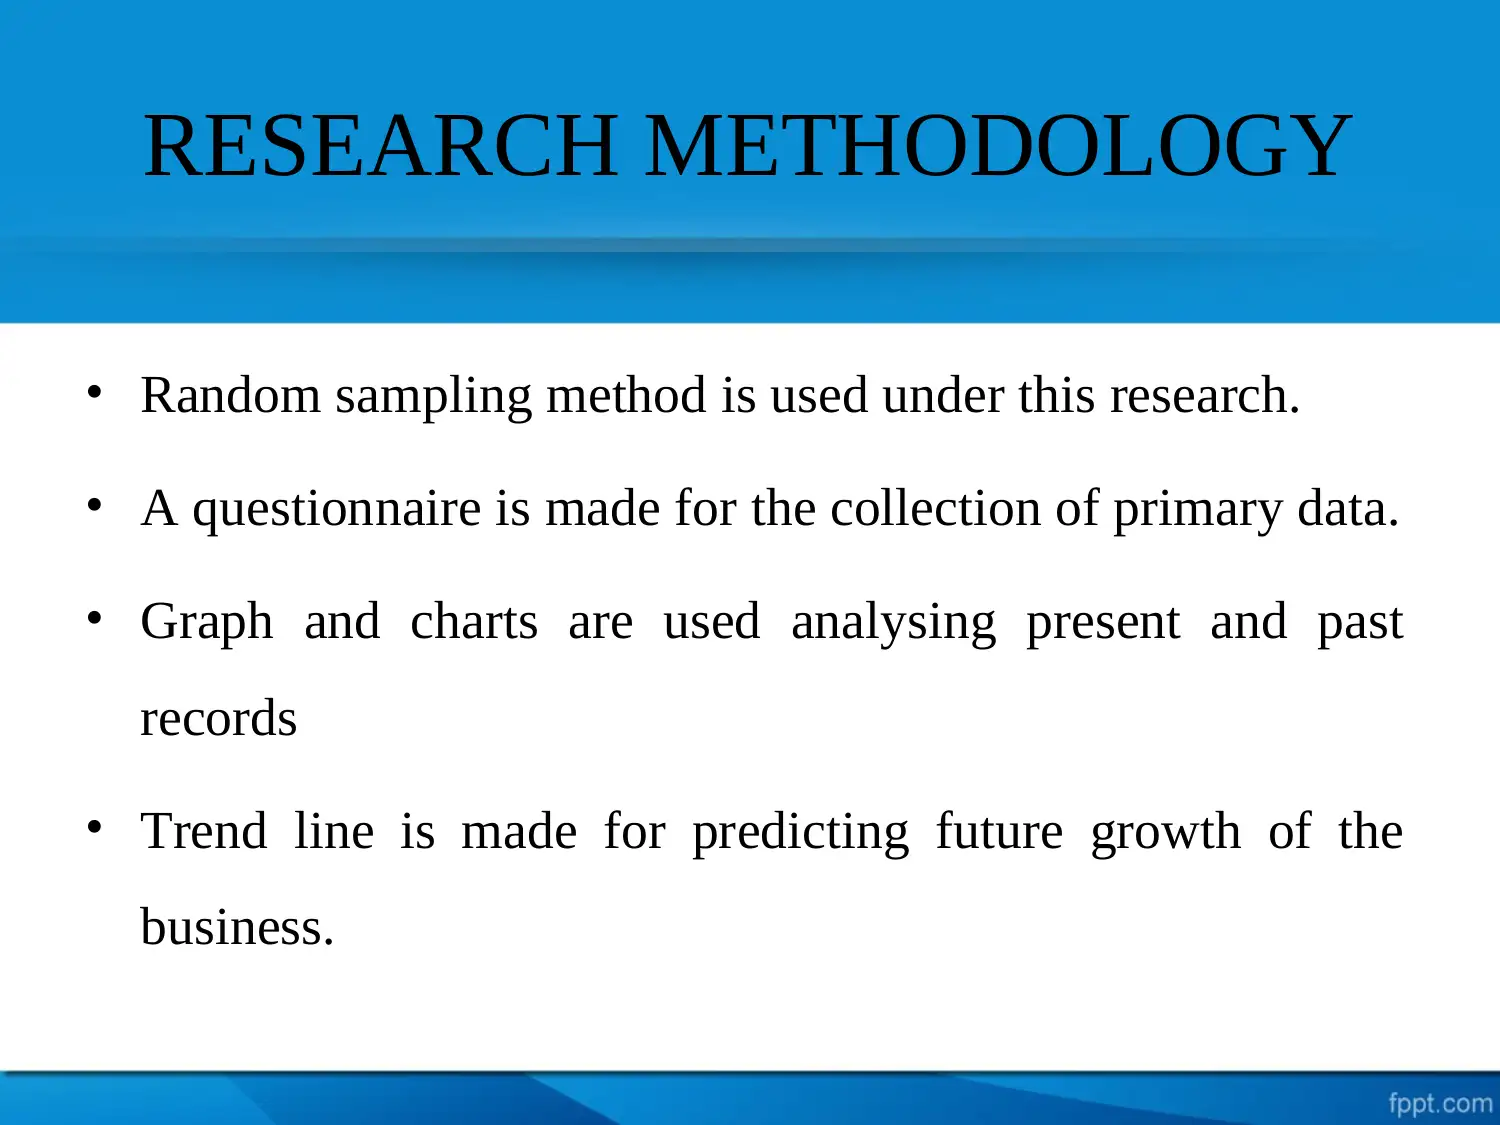
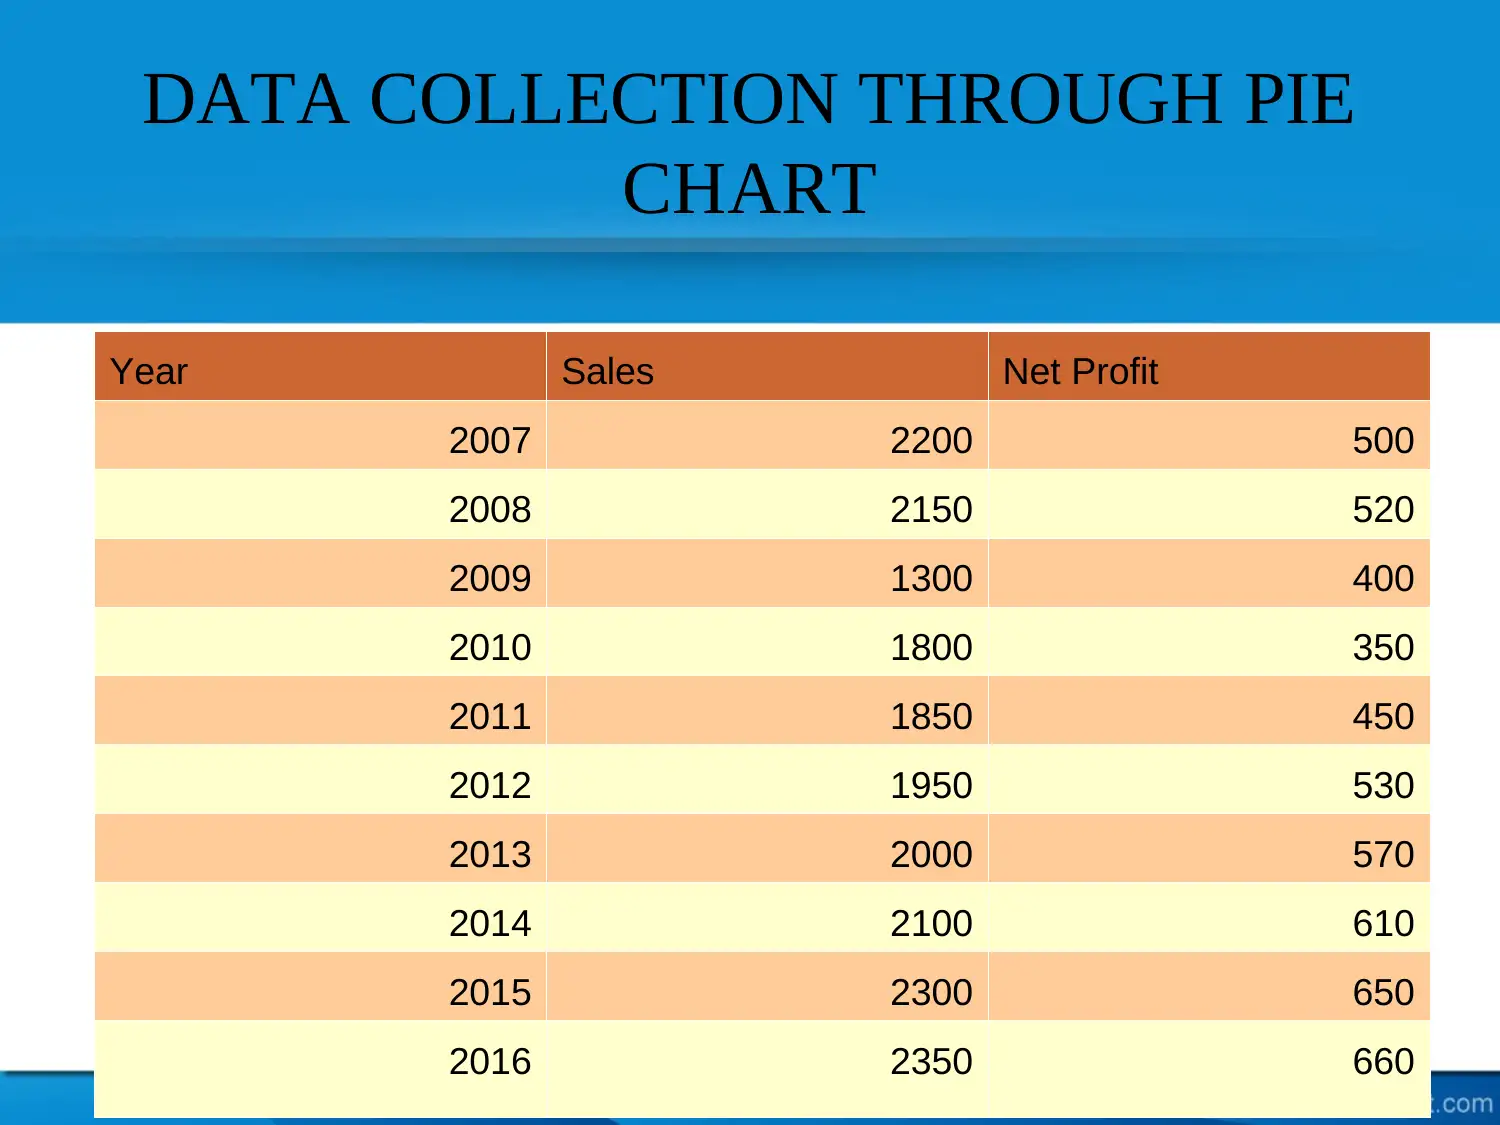
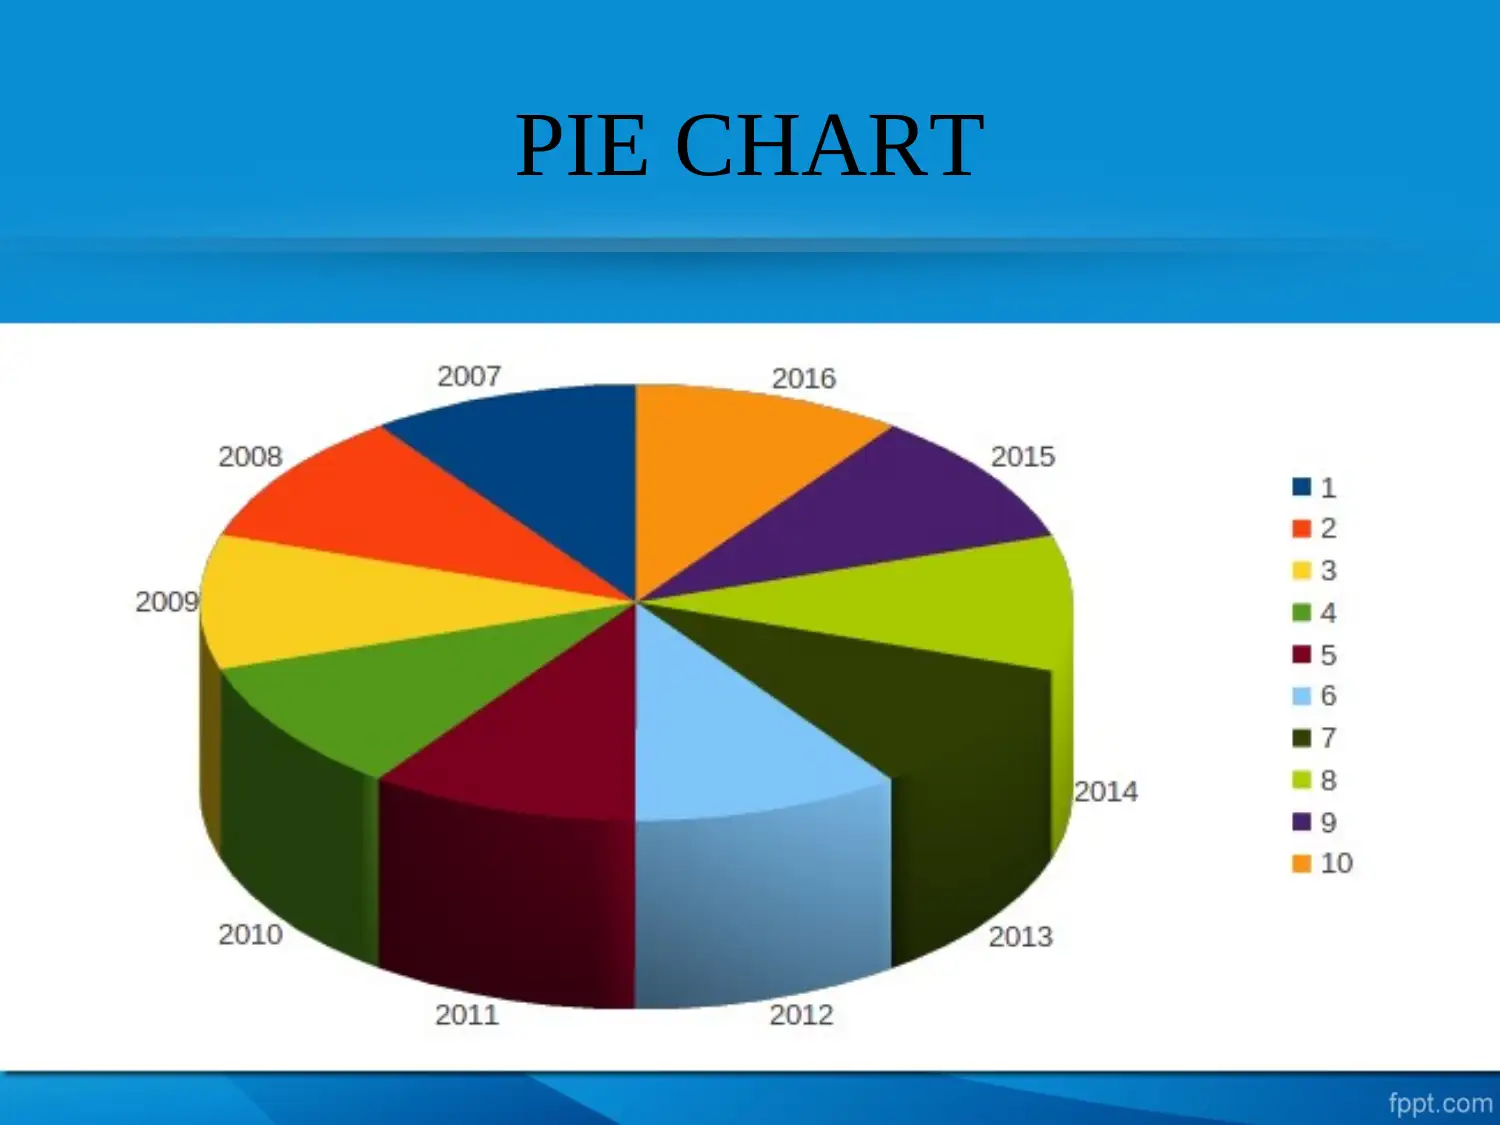
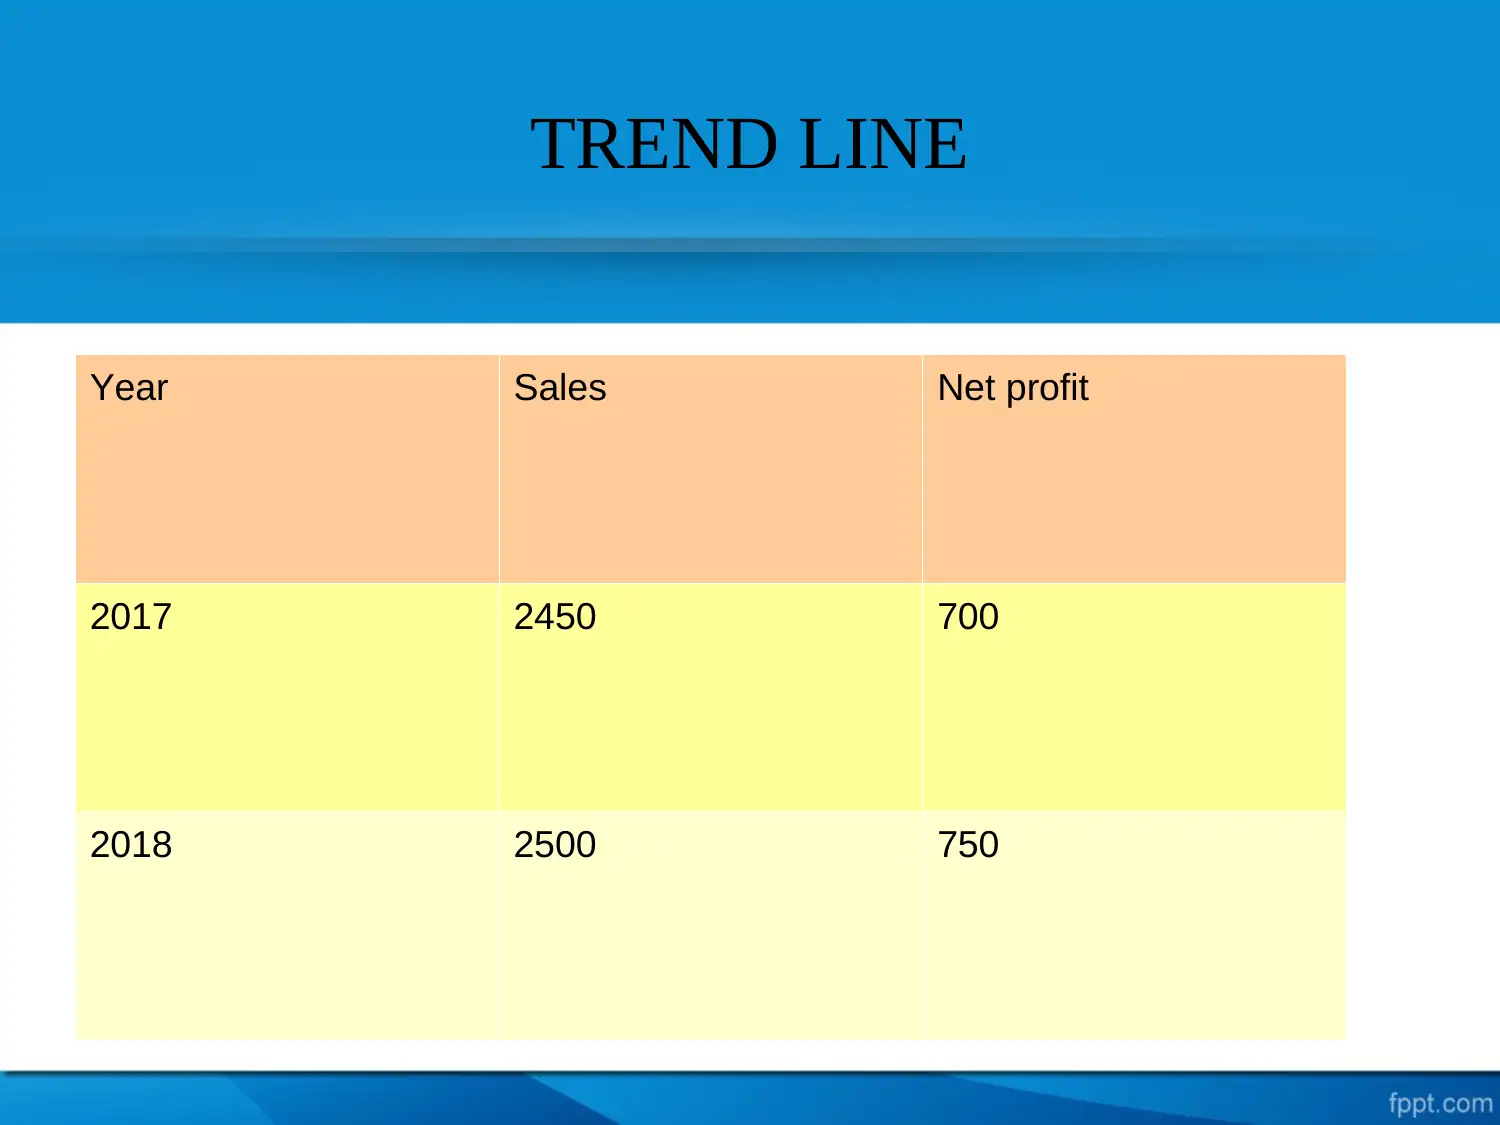
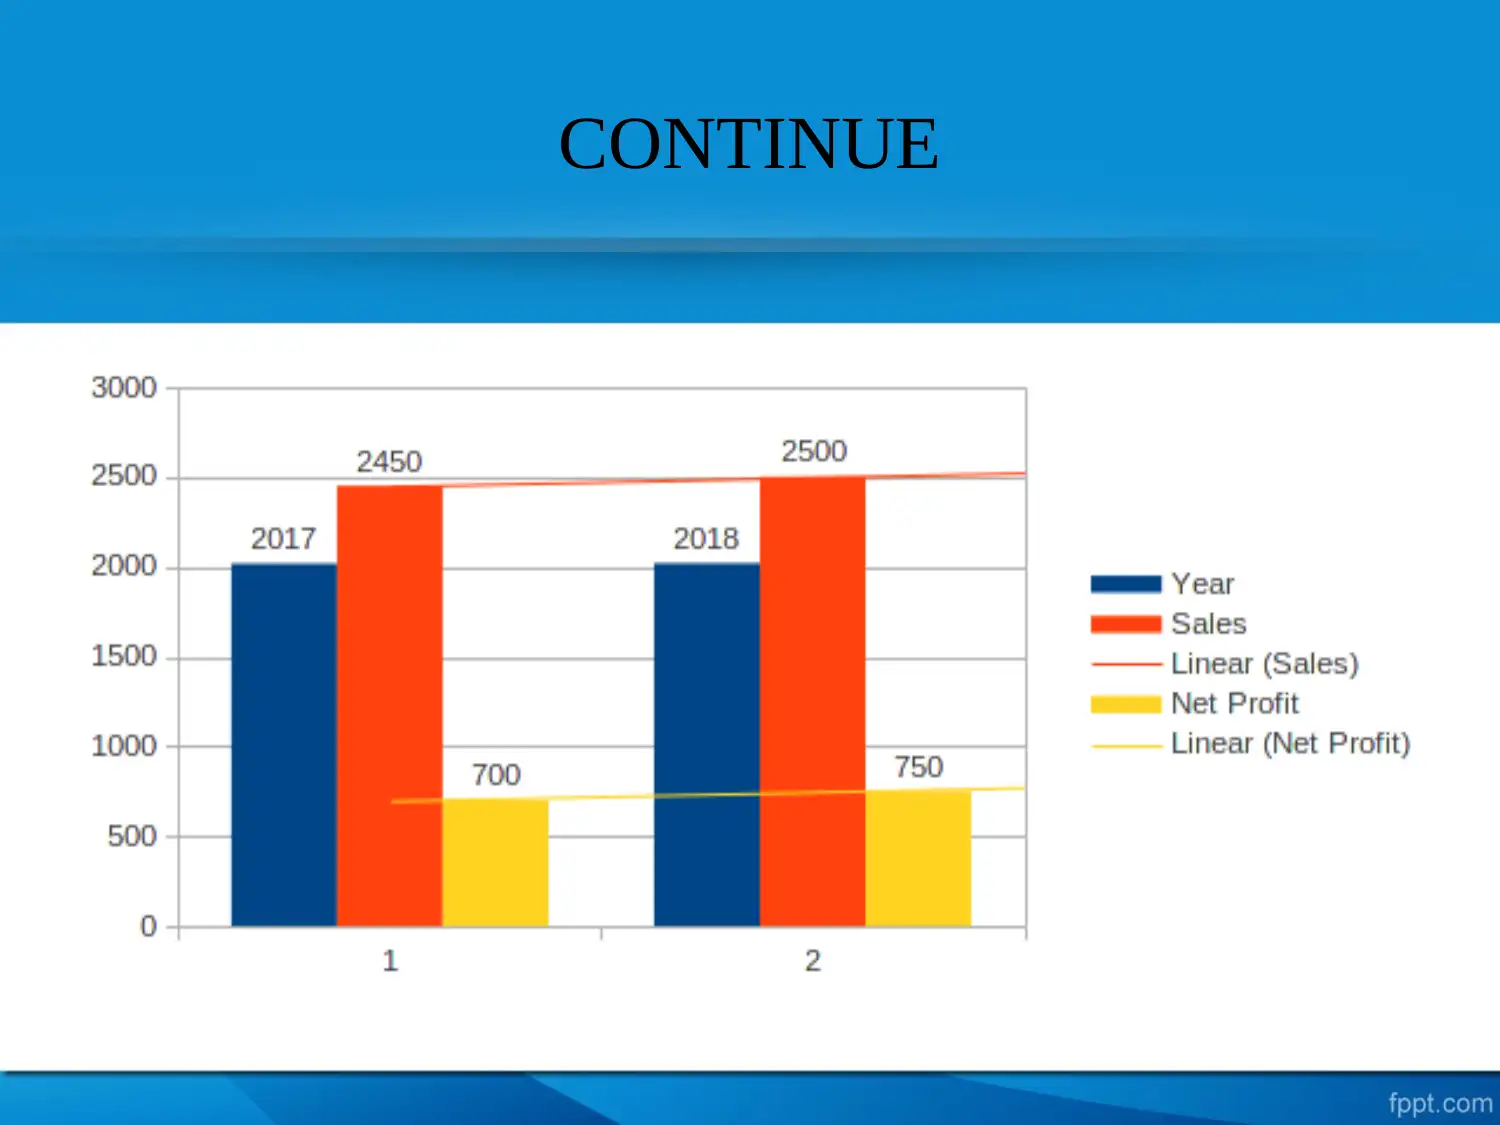
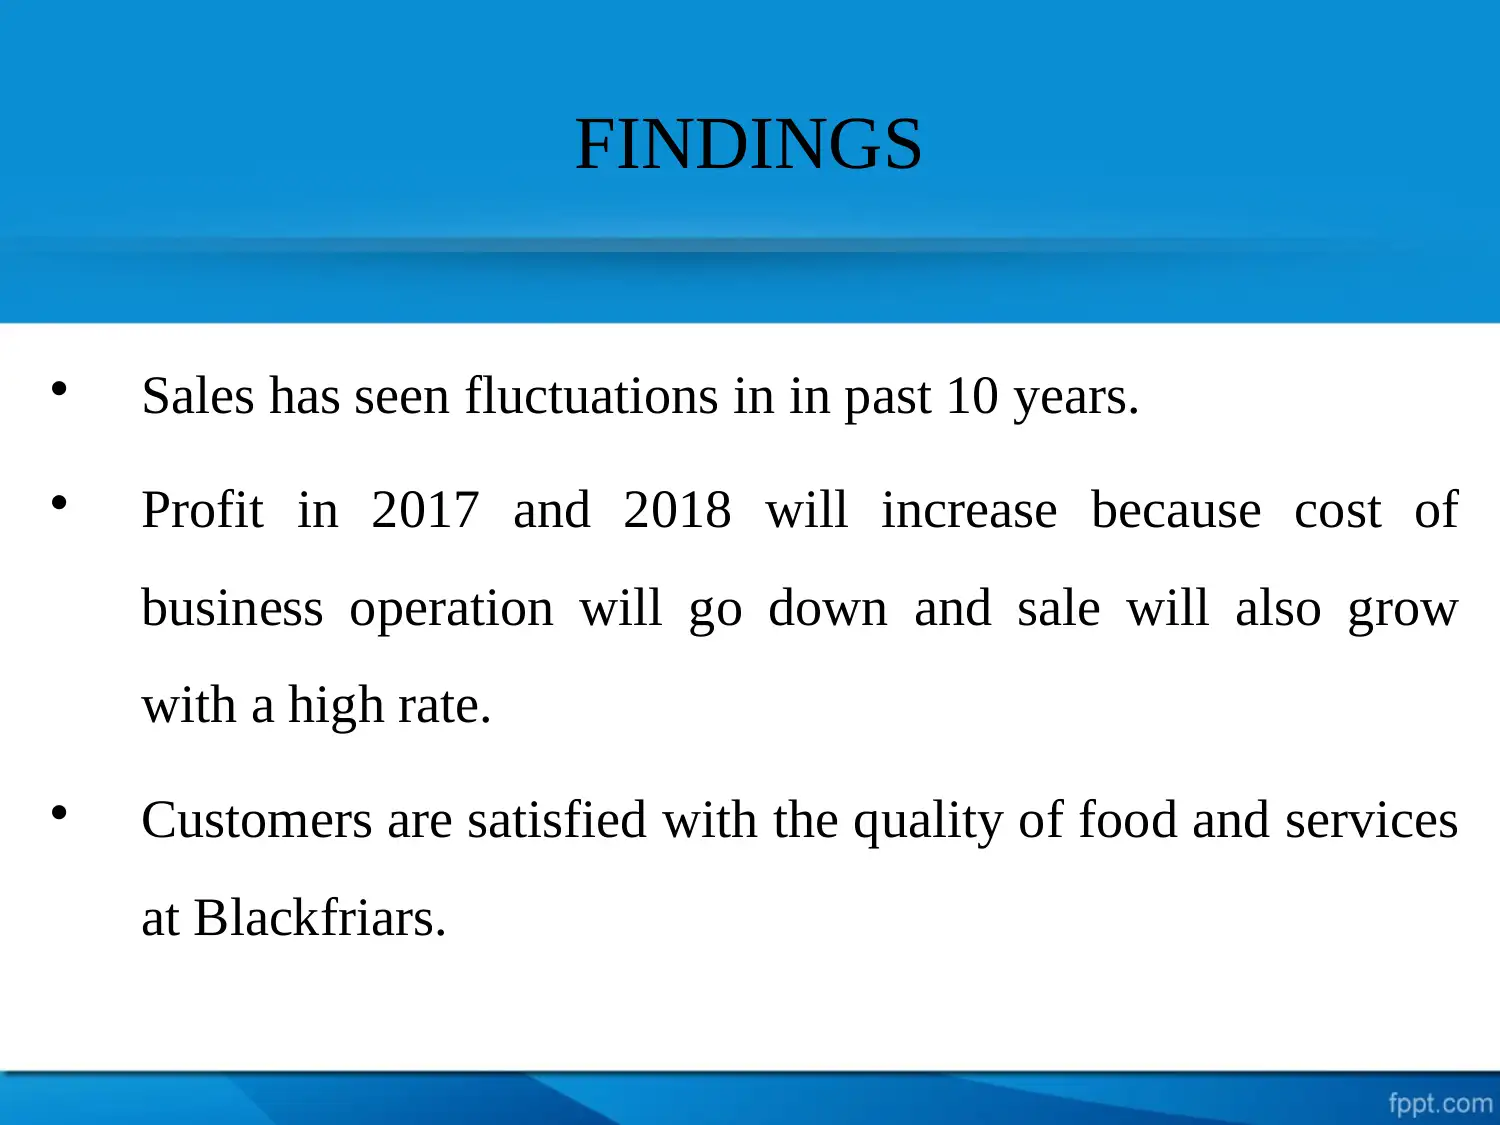
This report provides an analysis of business decision-making, focusing on data collection and trend analysis to support the opening of a new restaurant in London. It uses a random sampling method and a questionnaire to gather primary data, complemented by graphs and charts analyzing past records. The trend line predicts future business growth, highlighting fluctuations in sales over the past decade and anticipating increased profits due to reduced operational costs and sales growth. The research indicates customer satisfaction with food quality and services. The report references various sources on decision-making and financial accounting, concluding with a thank you note.
Document Page
Business Decision
making
(task 3.3)
tabler-icon-diamond-filled.svg

Paraphrase This Document

Need a fresh take? Get an instant paraphrase of this document with our AI Paraphraser
Document Page
COVER CONTENT
Introduction
Objectives
Research Methodology
Data Collection
Trend Line
Findings
References
Document Page
INTRODUCTION
All the decisions taken by a manager, either at lower level or
at higher level, comes under business decision making.
They assist an organisation in attaining their short and
long term goals.
Document Page
OBJECTIVES
This research is focusing on reviews given by customers, it is
essential before opening another restaurant in London. Both
permanent and new service users are considered under this
research.
tabler-icon-diamond-filled.svg

Paraphrase This Document

Need a fresh take? Get an instant paraphrase of this document with our AI Paraphraser
Document Page
RESEARCH METHODOLOGY
Random sampling method is used under this research.
A questionnaire is made for the collection of primary data.
Graph and charts are used analysing present and past
records
Trend line is made for predicting future growth of the
business.
Document Page
DATA COLLECTION THROUGH PIE
CHART
Year Sales Net Profit
2007 2200 500
2008 2150 520
2009 1300 400
2010 1800 350
2011 1850 450
2012 1950 530
2013 2000 570
2014 2100 610
2015 2300 650
2016 2350 660
Document Page
PIE CHART
tabler-icon-diamond-filled.svg

Paraphrase This Document

Need a fresh take? Get an instant paraphrase of this document with our AI Paraphraser
Document Page
TREND LINE
Year Sales Net profit
2017 2450 700
2018 2500 750
Document Page
CONTINUE
Document Page
FINDINGS
Sales has seen fluctuations in in past 10 years.
Profit in 2017 and 2018 will increase because cost of
business operation will go down and sale will also grow
with a high rate.
Customers are satisfied with the quality of food and services
at Blackfriars.
tabler-icon-diamond-filled.svg

Paraphrase This Document

Need a fresh take? Get an instant paraphrase of this document with our AI Paraphraser
Document Page
REFERENCES
Plous, S., 1993. The psychology of judgment and decision
making. Mcgraw-Hill Book Company.
Kimmel, P.D., Weygandt, J.J. and Kieso, D.E., 2010.
Financial accounting: tools for business decision
making. John Wiley & Sons.
Simon, H.A., 2011. Rational decision making in business
organizations. The American economic review, 69(4).
pp.493-513.
Document Page
THANK-YOU
chevron_up_icon
1 out of 12
circle_padding
hide_on_mobile
zoom_out_icon
[object Object]