Business Decision Making Report: A Case Study of WM Morrison's Retail
VerifiedAdded on 2019/12/03
|22
|4617
|204
Report
AI Summary
This report analyzes business decision-making within WM Morrison's, a major UK retailer, focusing on customer behavior and food discounting strategies. It begins with an introduction to the business context, followed by a plan for collecting both primary data through online surveys and secondary data from various sources. The report details the survey methodology, sampling frame, and questionnaire used to gather customer insights. Data summarization, analysis of results, and conclusions are presented, including measures of dispersion and explanations of key business metrics like quartile, percentile, and correlation coefficients. The report further explores sales forecasting using trend lines, business presentations, and a formal business report format. It also examines information processing tools, the critical path for Morrison's, and the use of financial tools in decision-making. The analysis provides a comprehensive overview of Morrison's retail strategies and decision-making processes, drawing conclusions based on the collected data and analysis.
Business Decision
Making
1
Making
1
Paraphrase This Document
Need a fresh take? Get an instant paraphrase of this document with our AI Paraphraser
TABLE OF CONTENTS
INTRODUCTION...........................................................................................................................3
LO1..................................................................................................................................................3
1.1 Plan for the collection of primary and secondary data..........................................................3
1.2 Survey methodology and sampling frame ............................................................................4
1.3 Questionnaire for the survey..................................................................................................4
LO2..................................................................................................................................................6
2.1 Summarization of data obtained from the survey..................................................................6
2.2 Analysis of result and conclusion..........................................................................................7
2.3 Measures of dispersion..........................................................................................................8
2.4 Explaining quartile, percentile and correlation coefficient which is useful in the business
context..........................................................................................................................................9
LO3................................................................................................................................................10
3.1 Graphs and conclusion based on business scenario.............................................................10
3.2 Forecasting sales revenue through trend lines:....................................................................12
3.3 Business presentation...........................................................................................................13
3.4 Formal business report for WM Morrison's.........................................................................13
LO4................................................................................................................................................14
4.1 Information processing tool.................................................................................................14
4.2 Critical path for the WM Morrison .....................................................................................15
4.3 Use of financial tools...........................................................................................................16
CONCLUSION .............................................................................................................................18
REFERENCES..............................................................................................................................19
2
INTRODUCTION
Business decision making is the process through which manager makes decisions after
analyzing several alternatives. Every action of manager produces an output which is the result of
decision. Manager plays the most important role in business decision making. This project report
is based on the case study of Morrison’s retail supermarket which is the fourth largest retailer in
UK in terms of turnover. Besides this, it includes 12 convenience stores and 500 stores in United
Kingdom (Black, K., 2011).This document shows research work which is based on the customer
behavior and attitude towards food discount retailing carried out by WM Morrison’s that is based
on primary and secondary data. This project report depicts decision making by the manager of
Morrison’s with the use of several techniques.
LO1
1.1 Plan for the collection of primary and secondary data
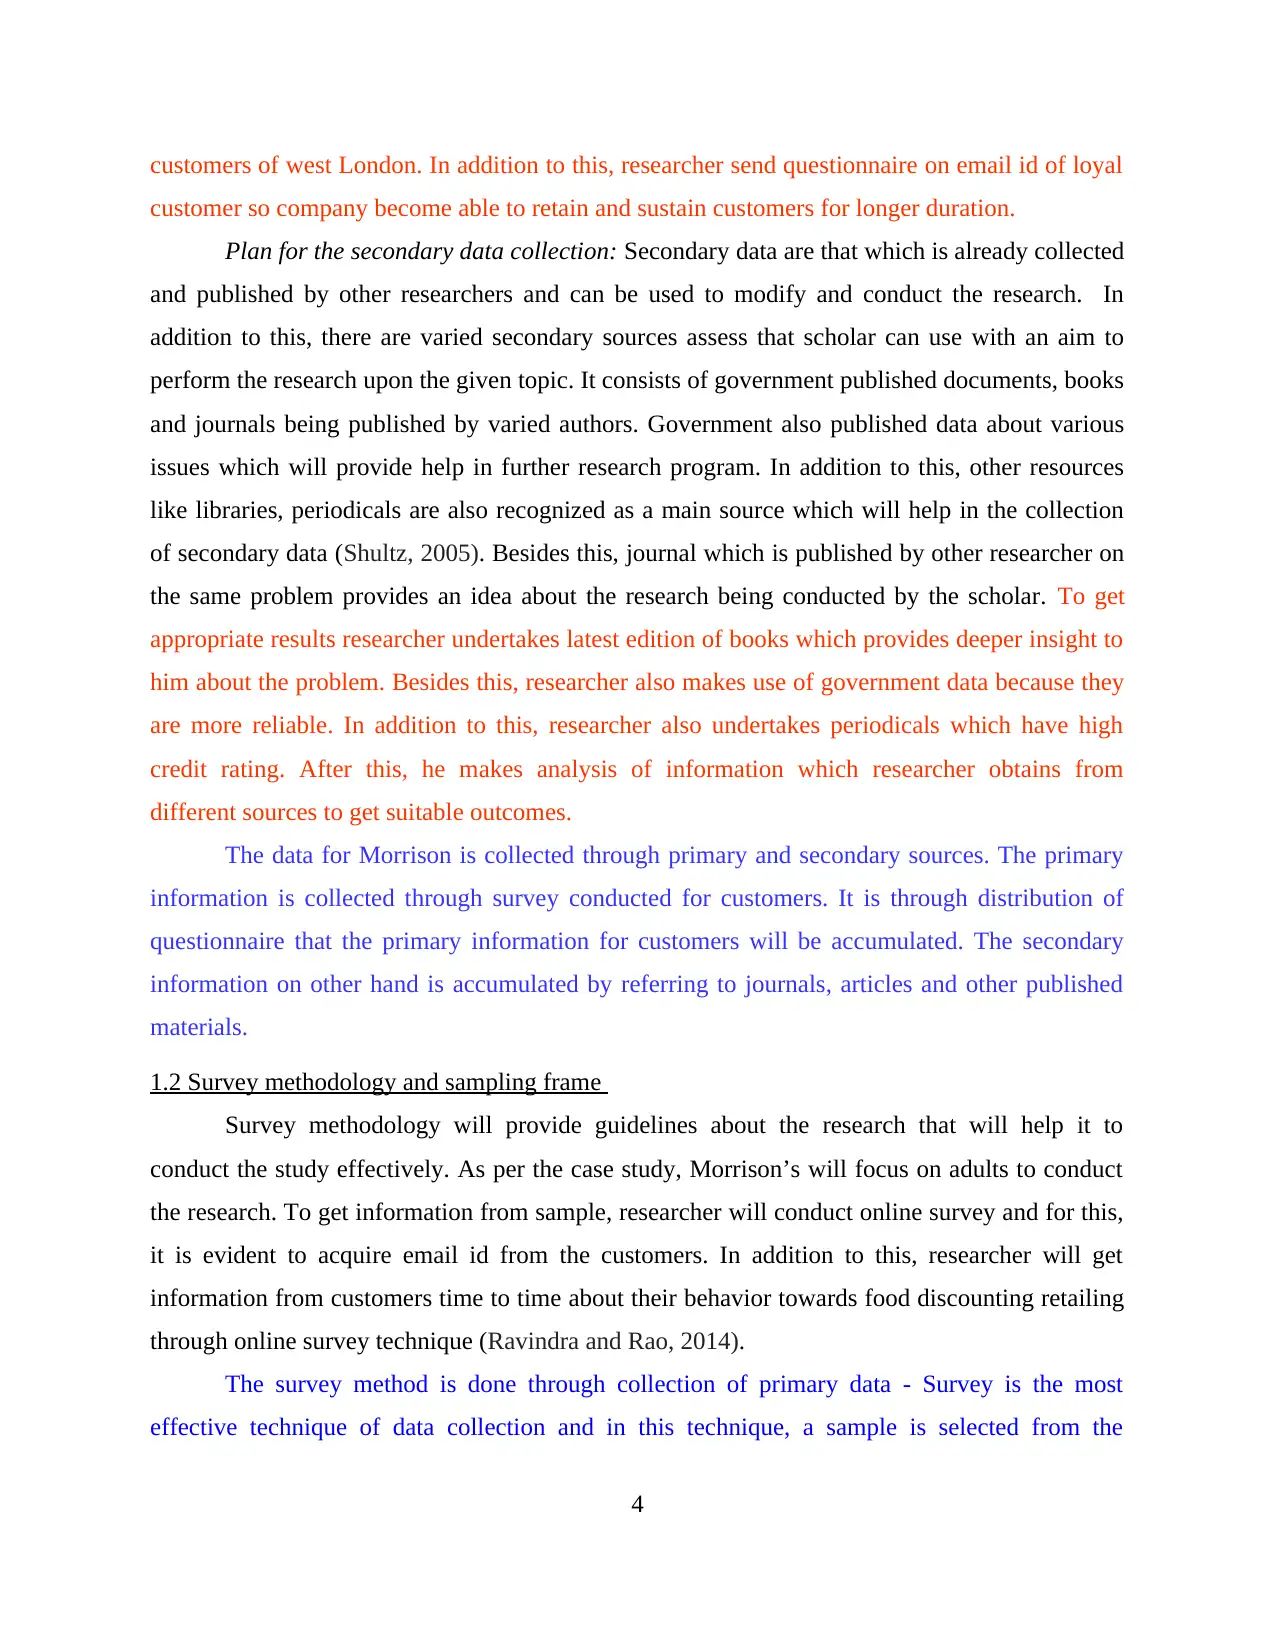
The research is conducted by the Morrison for the purpose to identify the consumer
behavior and attitude towards food discounting retailing. The main objective behind collection of
data and research studies are driving the top line, increasing efficiency, and capturing growth. To
achieve these objectives, Morrison’s needs to make an effective plan for the data collection
which will provide more help to company in the near future (English, 2012). The other aim and
objective of the study is to know the cultural behavior of the customers, Taste and preference of
the costumers, and to know the purchasing power, standard of living.
Plan for the primary data collection: Primary data is that which is collected for the first
time to achieve the objective of research. Here, primary data has been collected through online
survey which has been accomplished with the help of questionnaire. Survey is the most effective
technique of data collection and in this technique, a sample is selected from the population and
then survey is conducted on consumers to identify their attitude and behavior towards food
discounting retailing (Sapsford and Jupp, 2006). In survey, researcher will use questionnaire as a
tool to assess the consumer behavior towards food discounting retailing with the use of either
open or close ended questions which will helps in the collection of primary data. To conduct
research more effectively researcher send questionnaire to 50 people on their e-mail id and
encourage them to fill this questionnaire. For this, researcher only makes research upon the
3
Business decision making is the process through which manager makes decisions after
analyzing several alternatives. Every action of manager produces an output which is the result of
decision. Manager plays the most important role in business decision making. This project report
is based on the case study of Morrison’s retail supermarket which is the fourth largest retailer in
UK in terms of turnover. Besides this, it includes 12 convenience stores and 500 stores in United
Kingdom (Black, K., 2011).This document shows research work which is based on the customer
behavior and attitude towards food discount retailing carried out by WM Morrison’s that is based
on primary and secondary data. This project report depicts decision making by the manager of
Morrison’s with the use of several techniques.
LO1
1.1 Plan for the collection of primary and secondary data
The research is conducted by the Morrison for the purpose to identify the consumer
behavior and attitude towards food discounting retailing. The main objective behind collection of
data and research studies are driving the top line, increasing efficiency, and capturing growth. To
achieve these objectives, Morrison’s needs to make an effective plan for the data collection
which will provide more help to company in the near future (English, 2012). The other aim and
objective of the study is to know the cultural behavior of the customers, Taste and preference of
the costumers, and to know the purchasing power, standard of living.
Plan for the primary data collection: Primary data is that which is collected for the first
time to achieve the objective of research. Here, primary data has been collected through online
survey which has been accomplished with the help of questionnaire. Survey is the most effective
technique of data collection and in this technique, a sample is selected from the population and
then survey is conducted on consumers to identify their attitude and behavior towards food
discounting retailing (Sapsford and Jupp, 2006). In survey, researcher will use questionnaire as a
tool to assess the consumer behavior towards food discounting retailing with the use of either
open or close ended questions which will helps in the collection of primary data. To conduct
research more effectively researcher send questionnaire to 50 people on their e-mail id and
encourage them to fill this questionnaire. For this, researcher only makes research upon the
3
⊘ This is a preview!⊘
Do you want full access?
Subscribe today to unlock all pages.
Trusted by 1+ million students worldwide
customers of west London. In addition to this, researcher send questionnaire on email id of loyal
customer so company become able to retain and sustain customers for longer duration.
Plan for the secondary data collection: Secondary data are that which is already collected
and published by other researchers and can be used to modify and conduct the research. In
addition to this, there are varied secondary sources assess that scholar can use with an aim to
perform the research upon the given topic. It consists of government published documents, books
and journals being published by varied authors. Government also published data about various
issues which will provide help in further research program. In addition to this, other resources
like libraries, periodicals are also recognized as a main source which will help in the collection
of secondary data (Shultz, 2005). Besides this, journal which is published by other researcher on
the same problem provides an idea about the research being conducted by the scholar. To get
appropriate results researcher undertakes latest edition of books which provides deeper insight to
him about the problem. Besides this, researcher also makes use of government data because they
are more reliable. In addition to this, researcher also undertakes periodicals which have high
credit rating. After this, he makes analysis of information which researcher obtains from
different sources to get suitable outcomes.
The data for Morrison is collected through primary and secondary sources. The primary
information is collected through survey conducted for customers. It is through distribution of
questionnaire that the primary information for customers will be accumulated. The secondary
information on other hand is accumulated by referring to journals, articles and other published
materials.
1.2 Survey methodology and sampling frame
Survey methodology will provide guidelines about the research that will help it to
conduct the study effectively. As per the case study, Morrison’s will focus on adults to conduct
the research. To get information from sample, researcher will conduct online survey and for this,
it is evident to acquire email id from the customers. In addition to this, researcher will get
information from customers time to time about their behavior towards food discounting retailing
through online survey technique (Ravindra and Rao, 2014).
The survey method is done through collection of primary data - Survey is the most
effective technique of data collection and in this technique, a sample is selected from the
4
Paraphrase This Document
Need a fresh take? Get an instant paraphrase of this document with our AI Paraphraser
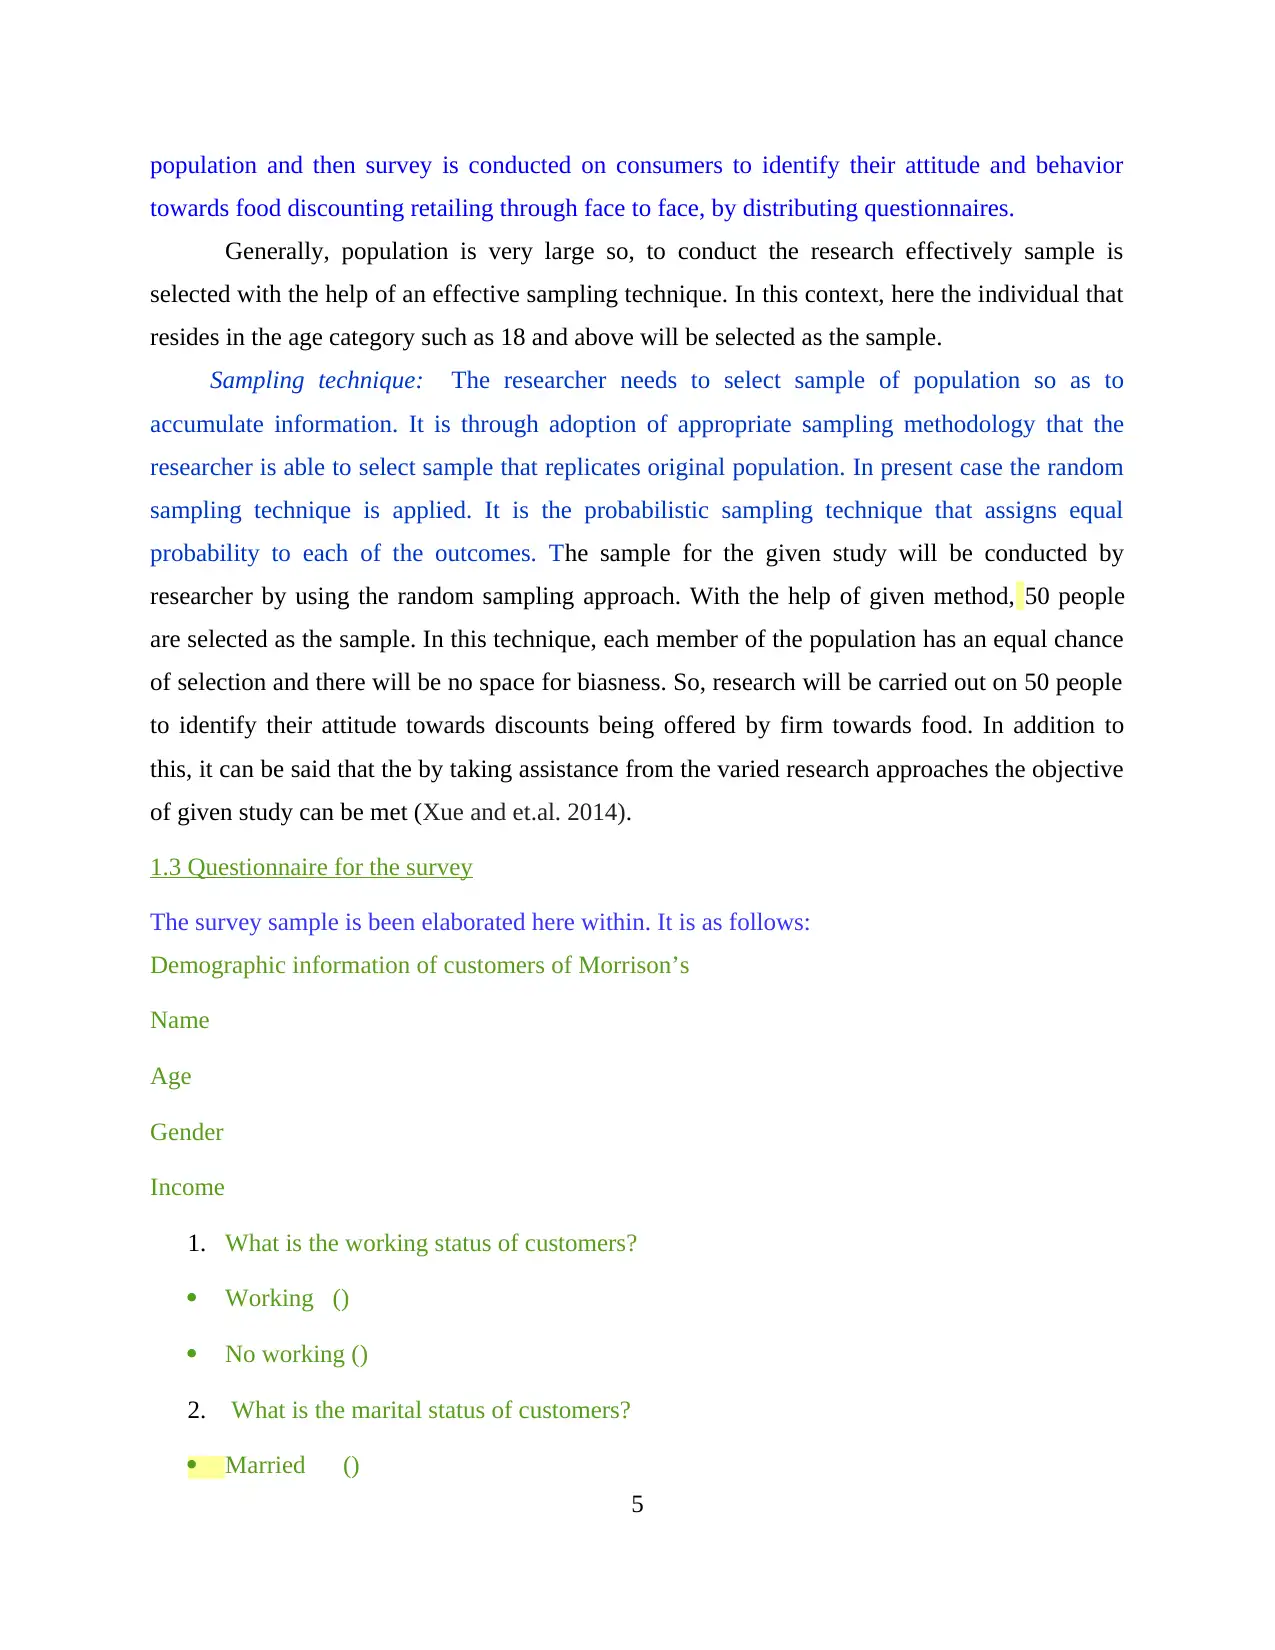
population and then survey is conducted on consumers to identify their attitude and behavior
towards food discounting retailing through face to face, by distributing questionnaires.
Generally, population is very large so, to conduct the research effectively sample is
selected with the help of an effective sampling technique. In this context, here the individual that
resides in the age category such as 18 and above will be selected as the sample.
Sampling technique: The researcher needs to select sample of population so as to
accumulate information. It is through adoption of appropriate sampling methodology that the
researcher is able to select sample that replicates original population. In present case the random
sampling technique is applied. It is the probabilistic sampling technique that assigns equal
probability to each of the outcomes. The sample for the given study will be conducted by
researcher by using the random sampling approach. With the help of given method, 50 people
are selected as the sample. In this technique, each member of the population has an equal chance
of selection and there will be no space for biasness. So, research will be carried out on 50 people
to identify their attitude towards discounts being offered by firm towards food. In addition to
this, it can be said that the by taking assistance from the varied research approaches the objective
of given study can be met (Xue and et.al. 2014).
1.3 Questionnaire for the survey
The survey sample is been elaborated here within. It is as follows:
Demographic information of customers of Morrison’s
Name
Age
Gender
Income
1. What is the working status of customers?
Working ()
No working ()
2. What is the marital status of customers?
Married ()
5
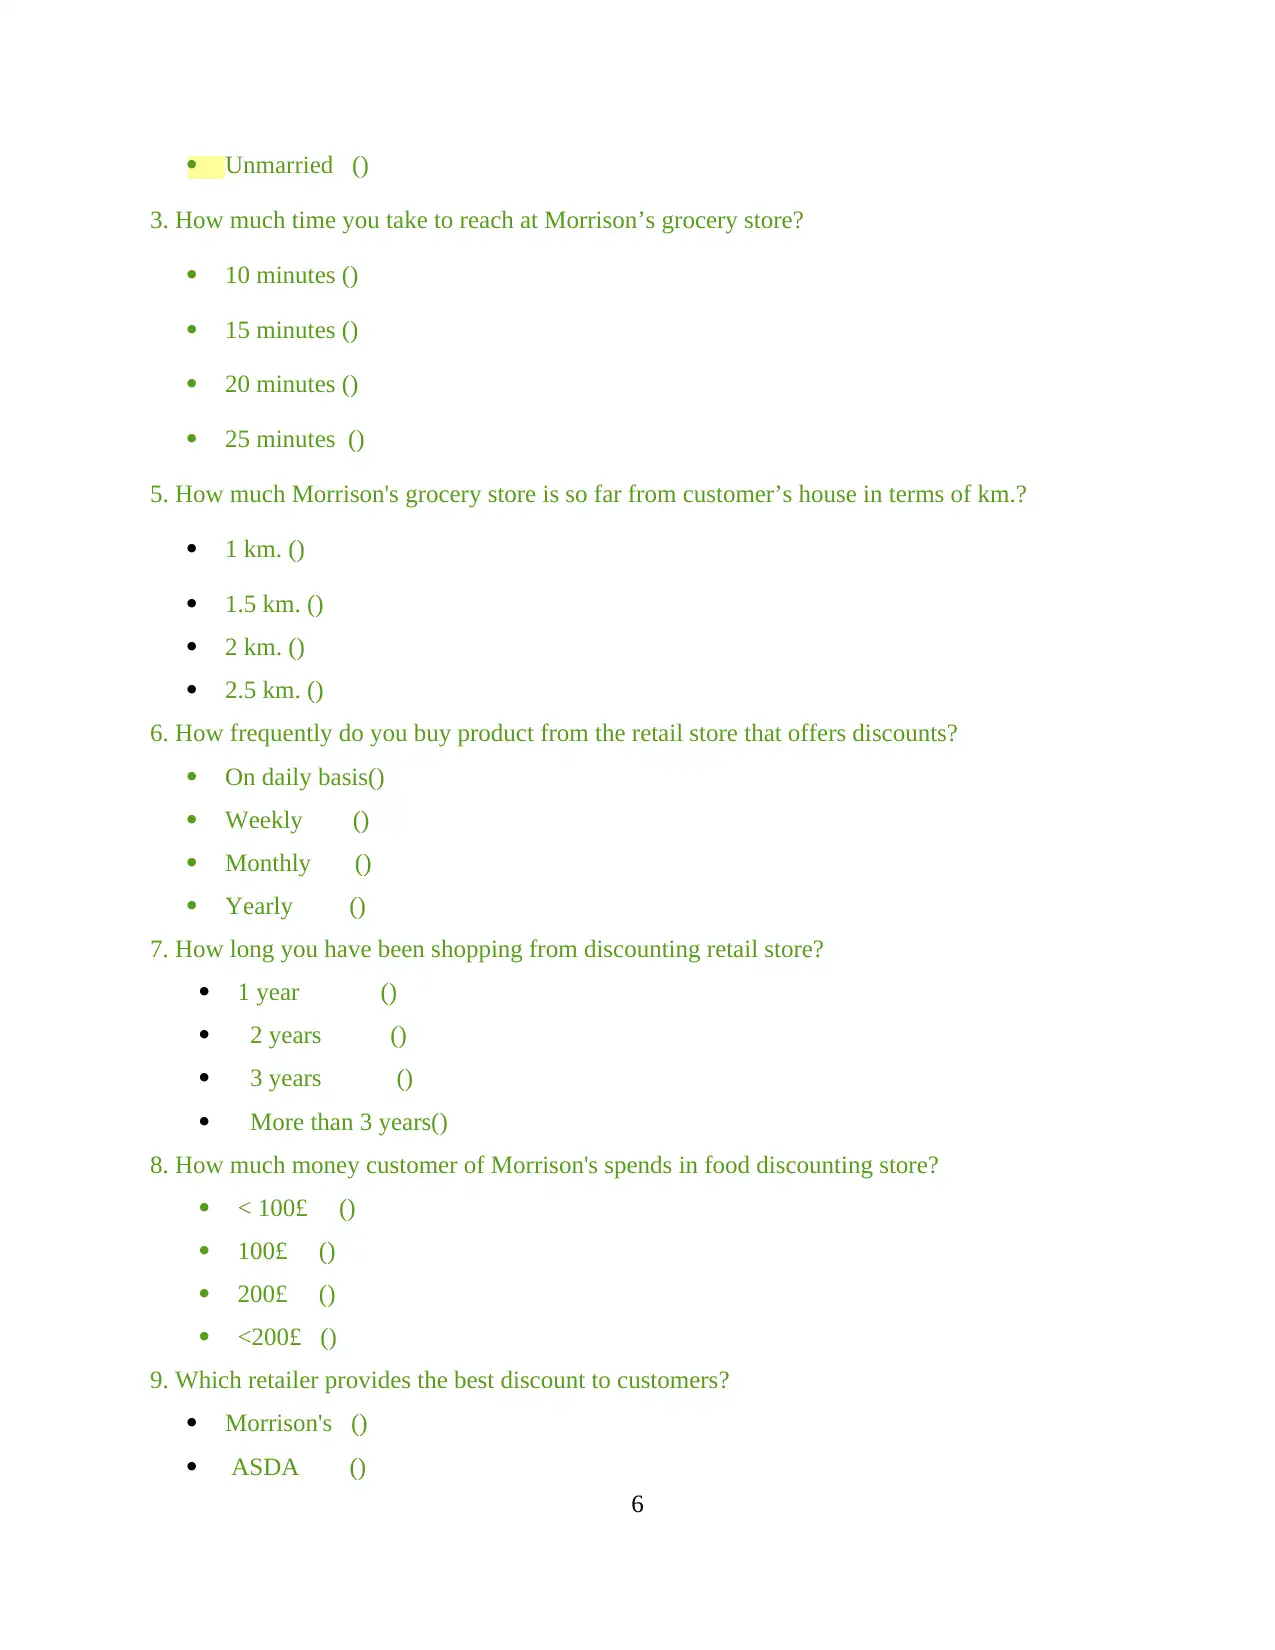
Unmarried ()
3. How much time you take to reach at Morrison’s grocery store?
10 minutes ()
15 minutes ()
20 minutes ()
25 minutes ()
5. How much Morrison's grocery store is so far from customer’s house in terms of km.?
1 km. ()
1.5 km. ()
2 km. ()
2.5 km. ()
6. How frequently do you buy product from the retail store that offers discounts?
On daily basis()
Weekly ()
Monthly ()
Yearly ()
7. How long you have been shopping from discounting retail store?
1 year ()
2 years ()
3 years ()
More than 3 years()
8. How much money customer of Morrison's spends in food discounting store?
< 100£ ()
100£ ()
200£ ()
<200£ ()
9. Which retailer provides the best discount to customers?
Morrison's ()
ASDA ()
6
⊘ This is a preview!⊘
Do you want full access?
Subscribe today to unlock all pages.
Trusted by 1+ million students worldwide
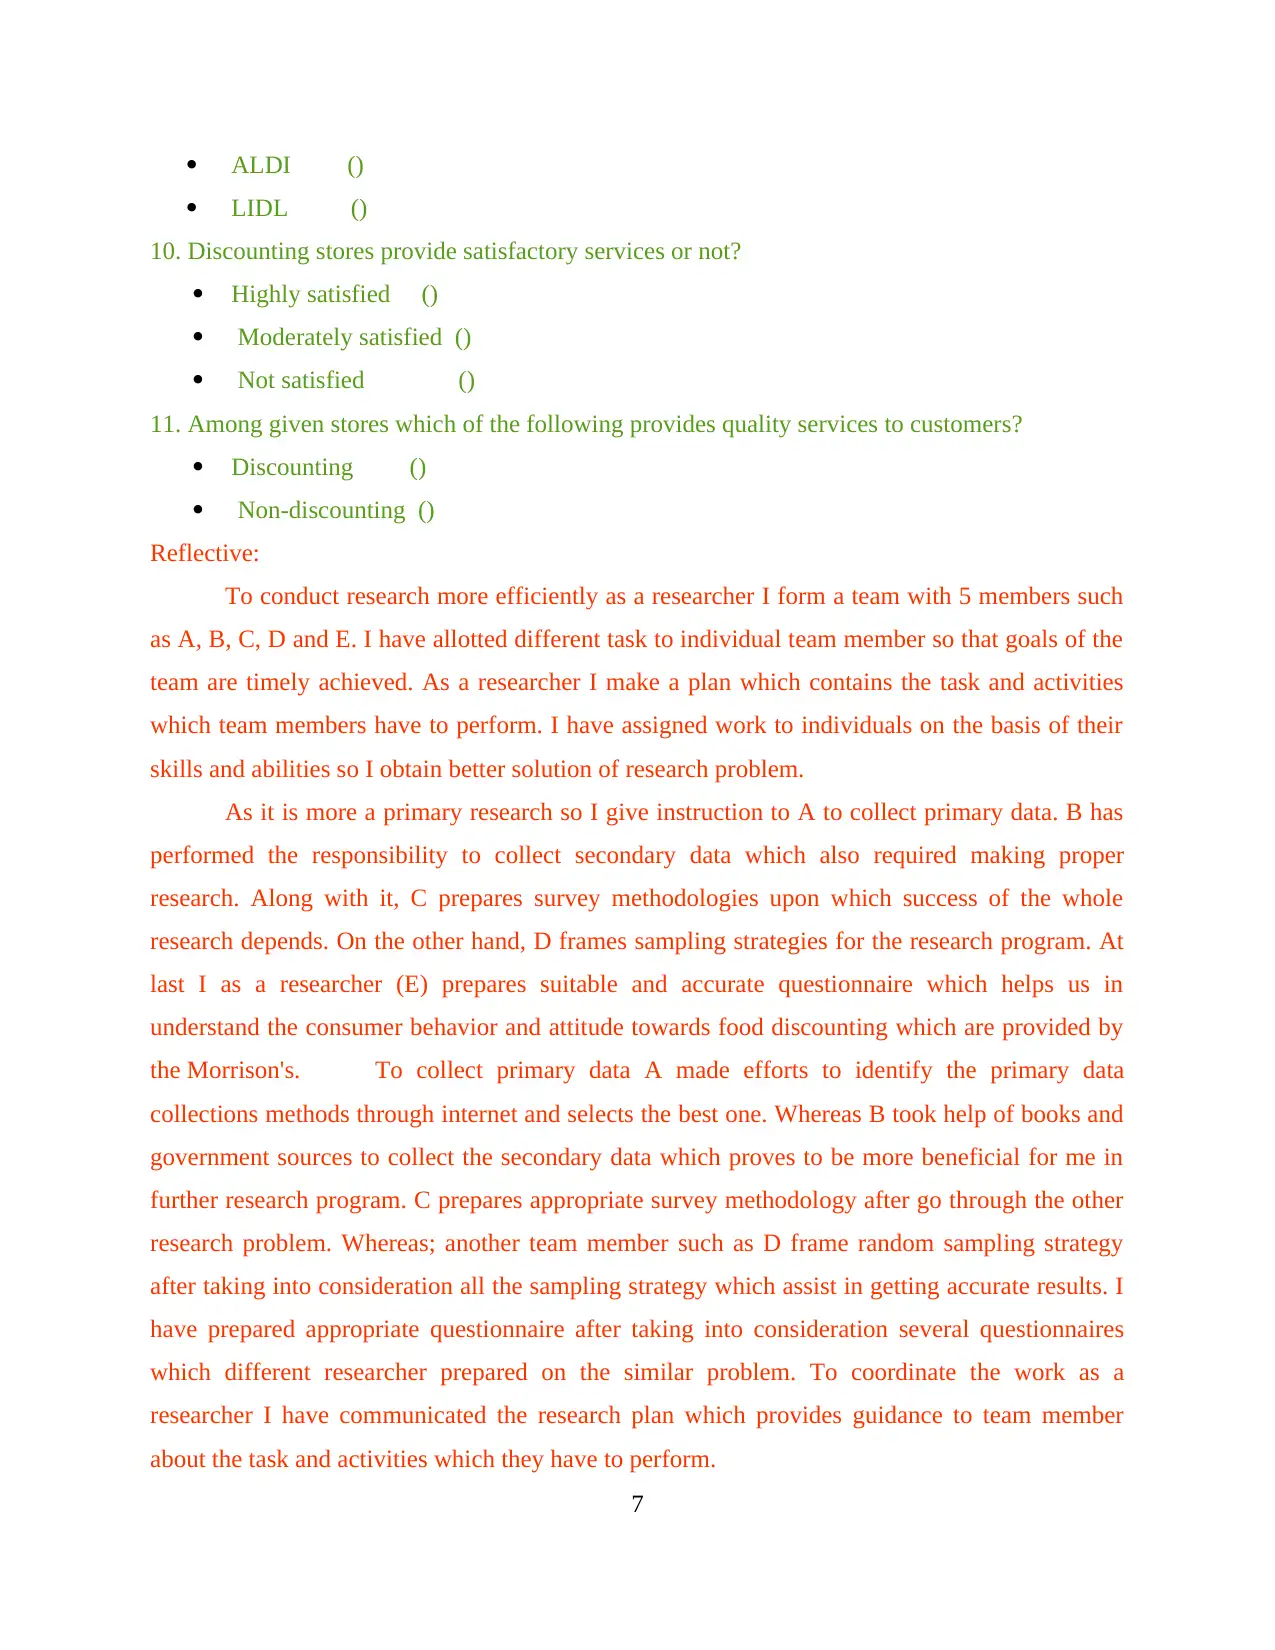
ALDI ()
LIDL ()
10. Discounting stores provide satisfactory services or not?
Highly satisfied ()
Moderately satisfied ()
Not satisfied ()
11. Among given stores which of the following provides quality services to customers?
Discounting ()
Non-discounting ()
Reflective:
To conduct research more efficiently as a researcher I form a team with 5 members such
as A, B, C, D and E. I have allotted different task to individual team member so that goals of the
team are timely achieved. As a researcher I make a plan which contains the task and activities
which team members have to perform. I have assigned work to individuals on the basis of their
skills and abilities so I obtain better solution of research problem.
As it is more a primary research so I give instruction to A to collect primary data. B has
performed the responsibility to collect secondary data which also required making proper
research. Along with it, C prepares survey methodologies upon which success of the whole
research depends. On the other hand, D frames sampling strategies for the research program. At
last I as a researcher (E) prepares suitable and accurate questionnaire which helps us in
understand the consumer behavior and attitude towards food discounting which are provided by
the Morrison's. To collect primary data A made efforts to identify the primary data
collections methods through internet and selects the best one. Whereas B took help of books and
government sources to collect the secondary data which proves to be more beneficial for me in
further research program. C prepares appropriate survey methodology after go through the other
research problem. Whereas; another team member such as D frame random sampling strategy
after taking into consideration all the sampling strategy which assist in getting accurate results. I
have prepared appropriate questionnaire after taking into consideration several questionnaires
which different researcher prepared on the similar problem. To coordinate the work as a
researcher I have communicated the research plan which provides guidance to team member
about the task and activities which they have to perform.
7
Paraphrase This Document
Need a fresh take? Get an instant paraphrase of this document with our AI Paraphraser
LO2
2.1 Summarization of data obtained from the survey
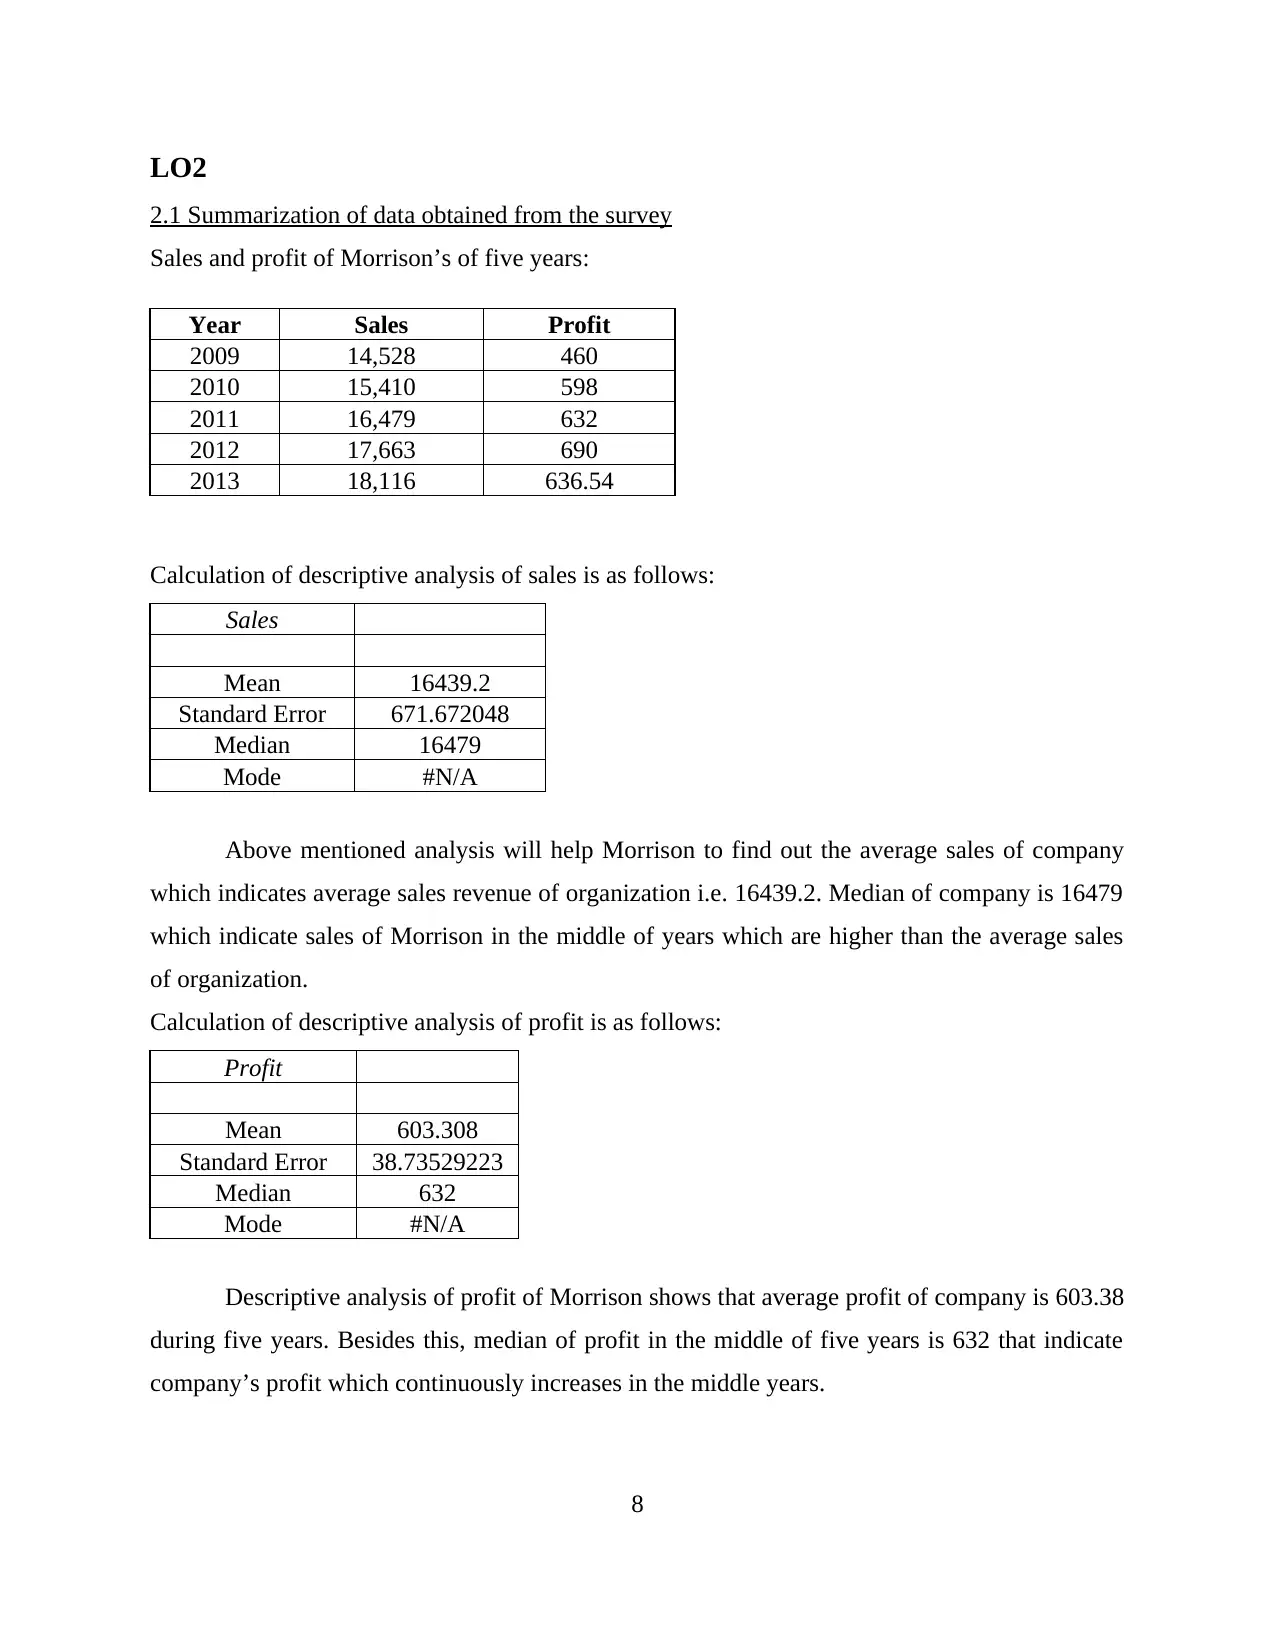
Sales and profit of Morrison’s of five years:
Year Sales Profit
2009 14,528 460
2010 15,410 598
2011 16,479 632
2012 17,663 690
2013 18,116 636.54
Calculation of descriptive analysis of sales is as follows:
Sales
Mean 16439.2
Standard Error 671.672048
Median 16479
Mode #N/A
Above mentioned analysis will help Morrison to find out the average sales of company
which indicates average sales revenue of organization i.e. 16439.2. Median of company is 16479
which indicate sales of Morrison in the middle of years which are higher than the average sales
of organization.
Calculation of descriptive analysis of profit is as follows:
Profit
Mean 603.308
Standard Error 38.73529223
Median 632
Mode #N/A
Descriptive analysis of profit of Morrison shows that average profit of company is 603.38
during five years. Besides this, median of profit in the middle of five years is 632 that indicate
company’s profit which continuously increases in the middle years.
8
2.1 Summarization of data obtained from the survey
Sales and profit of Morrison’s of five years:
Year Sales Profit
2009 14,528 460
2010 15,410 598
2011 16,479 632
2012 17,663 690
2013 18,116 636.54
Calculation of descriptive analysis of sales is as follows:
Sales
Mean 16439.2
Standard Error 671.672048
Median 16479
Mode #N/A
Above mentioned analysis will help Morrison to find out the average sales of company
which indicates average sales revenue of organization i.e. 16439.2. Median of company is 16479
which indicate sales of Morrison in the middle of years which are higher than the average sales
of organization.
Calculation of descriptive analysis of profit is as follows:
Profit
Mean 603.308
Standard Error 38.73529223
Median 632
Mode #N/A
Descriptive analysis of profit of Morrison shows that average profit of company is 603.38
during five years. Besides this, median of profit in the middle of five years is 632 that indicate
company’s profit which continuously increases in the middle years.
8
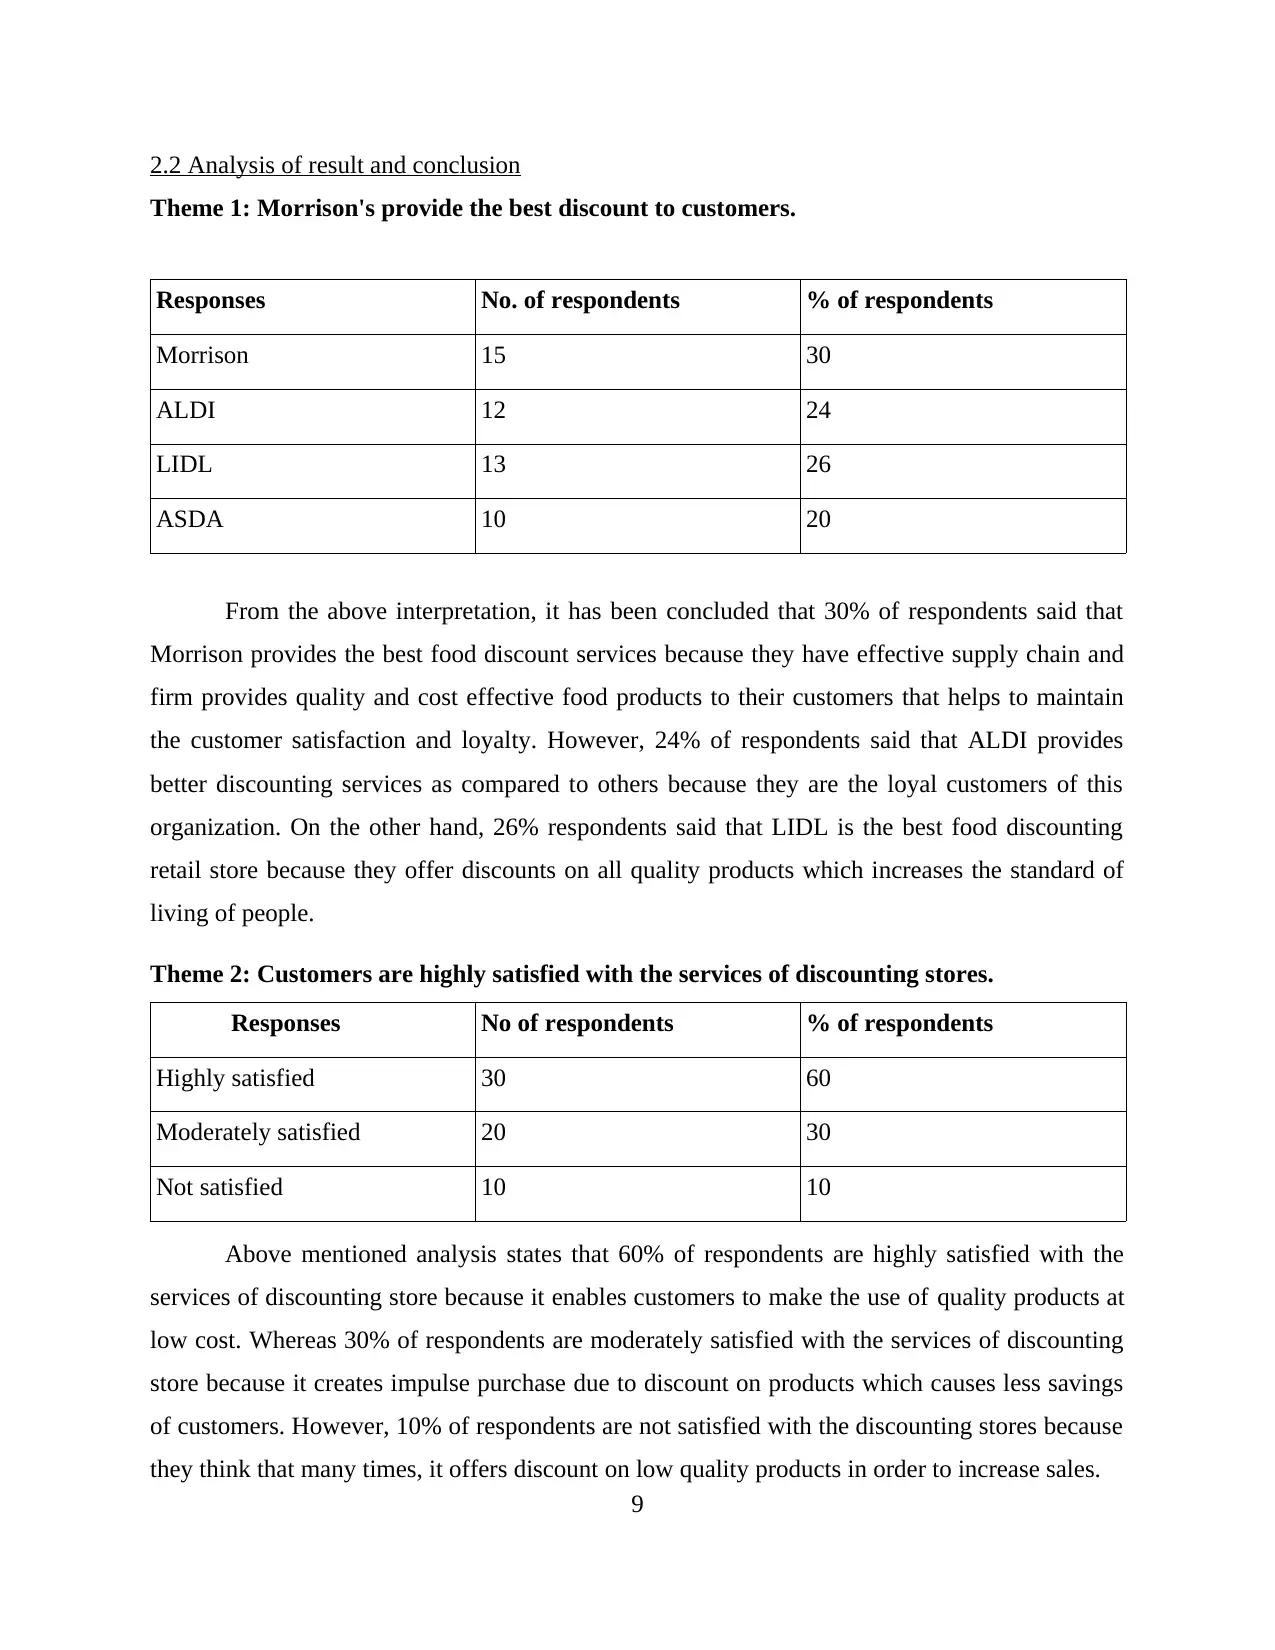
2.2 Analysis of result and conclusion
Theme 1: Morrison's provide the best discount to customers.
Responses No. of respondents % of respondents
Morrison 15 30
ALDI 12 24
LIDL 13 26
ASDA 10 20
From the above interpretation, it has been concluded that 30% of respondents said that
Morrison provides the best food discount services because they have effective supply chain and
firm provides quality and cost effective food products to their customers that helps to maintain
the customer satisfaction and loyalty. However, 24% of respondents said that ALDI provides
better discounting services as compared to others because they are the loyal customers of this
organization. On the other hand, 26% respondents said that LIDL is the best food discounting
retail store because they offer discounts on all quality products which increases the standard of
living of people.
Theme 2: Customers are highly satisfied with the services of discounting stores.
Responses No of respondents % of respondents
Highly satisfied 30 60
Moderately satisfied 20 30
Not satisfied 10 10
Above mentioned analysis states that 60% of respondents are highly satisfied with the
services of discounting store because it enables customers to make the use of quality products at
low cost. Whereas 30% of respondents are moderately satisfied with the services of discounting
store because it creates impulse purchase due to discount on products which causes less savings
of customers. However, 10% of respondents are not satisfied with the discounting stores because
they think that many times, it offers discount on low quality products in order to increase sales.
9
⊘ This is a preview!⊘
Do you want full access?
Subscribe today to unlock all pages.
Trusted by 1+ million students worldwide
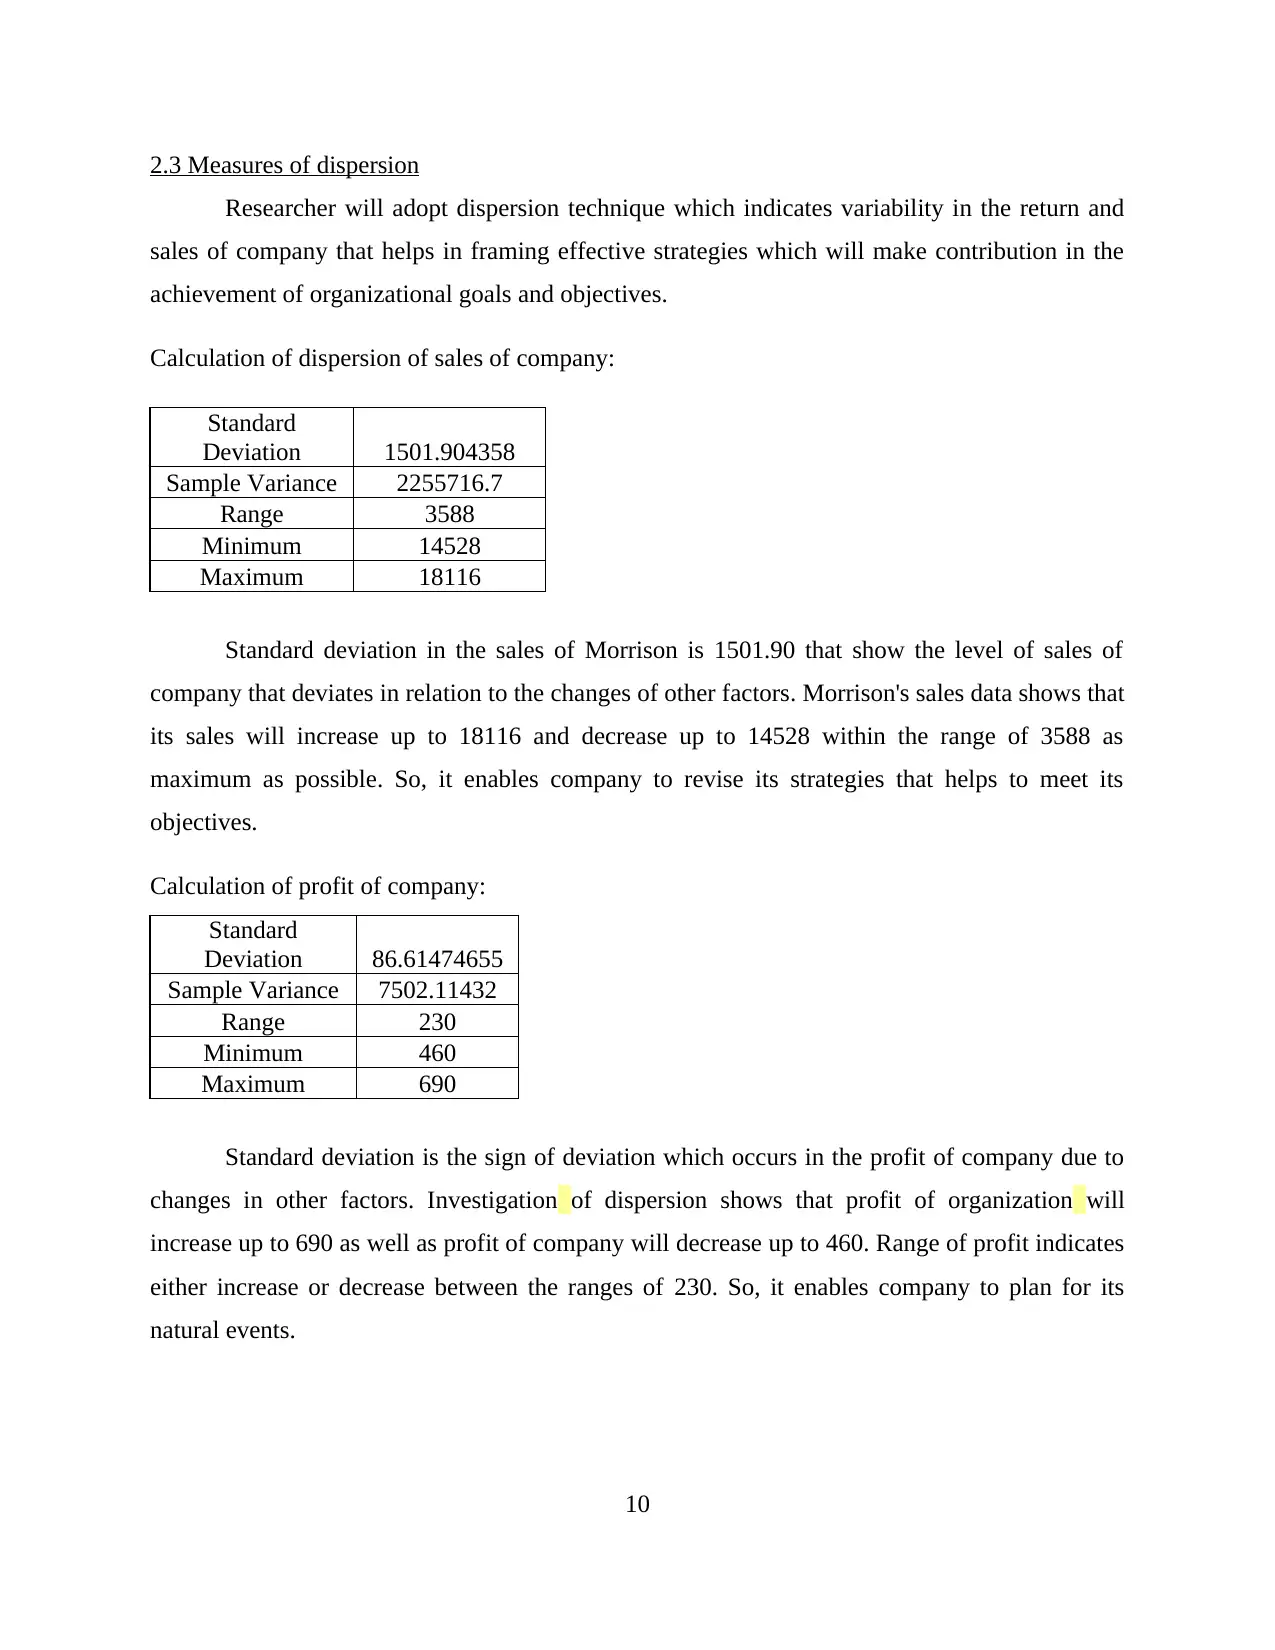
2.3 Measures of dispersion
Researcher will adopt dispersion technique which indicates variability in the return and
sales of company that helps in framing effective strategies which will make contribution in the
achievement of organizational goals and objectives.
Calculation of dispersion of sales of company:
Standard
Deviation 1501.904358
Sample Variance 2255716.7
Range 3588
Minimum 14528
Maximum 18116
Standard deviation in the sales of Morrison is 1501.90 that show the level of sales of
company that deviates in relation to the changes of other factors. Morrison's sales data shows that
its sales will increase up to 18116 and decrease up to 14528 within the range of 3588 as
maximum as possible. So, it enables company to revise its strategies that helps to meet its
objectives.
Calculation of profit of company:
Standard
Deviation 86.61474655
Sample Variance 7502.11432
Range 230
Minimum 460
Maximum 690
Standard deviation is the sign of deviation which occurs in the profit of company due to
changes in other factors. Investigation of dispersion shows that profit of organization will
increase up to 690 as well as profit of company will decrease up to 460. Range of profit indicates
either increase or decrease between the ranges of 230. So, it enables company to plan for its
natural events.
10
Paraphrase This Document
Need a fresh take? Get an instant paraphrase of this document with our AI Paraphraser

2.4 Explaining quartile, percentile and correlation coefficient which is useful in the business
context
Quartile can be defined as the range in which overall period of business is divided into four
parts on the basis of numerical value of data for analysis. The quartile range of WM Morrison's
is presented as under:
Quartile 1 15410
Quartile 2 16479
Quartile 3 17663
Quartile range of business provides more help to the organization in determining
variability in its sales pattern which enables it to take appropriate action on time that is more
beneficial for the company's success (Agarwal and Mazumder, 2013). Quartile range of WM
Morrison's indicates that firm’s sales are continuously increasing at the end of each quarter. So,
company needs to remain with existing strategies and with the help of above figures, company
could predict their future sales as well.
Calculation of percentile
25th Percentile 15410
50th Percentile 16479
75th Percentile 17663
Percentile are same as quartile but only one difference is there in between them that is
percentile represents results in the form of percentage or in the form of 100. Mainly three types
of percentiles which posses similar attribute of the quartile includes 25th percentile is equal to the
quartile 1 and 50th and 100th percentile is equal to the quartile 2 and quartile 3. .
Correlation coefficient between sales and profit is calculated as follows:
Correlation coefficient determines the relationship between two variables which indicates
dependency of one variable over another (Nahmias and Olsen, 2015). Coefficient of correlation
11
is a statistical measure which helps Morrison's to predict the effect of changes in sales pattern of
company on the profit.
Correlation Coefficient
Sales Profit
Sales 1
Profit 0.85003 1
.......Above figures of correlation coefficient of Morrison's states that sales and profit of company
have positive relationship such as .85 which indicates that sales and profit of organization
increases in the same direction. An increase in sales will result in enhancing the profit as well.
LO3
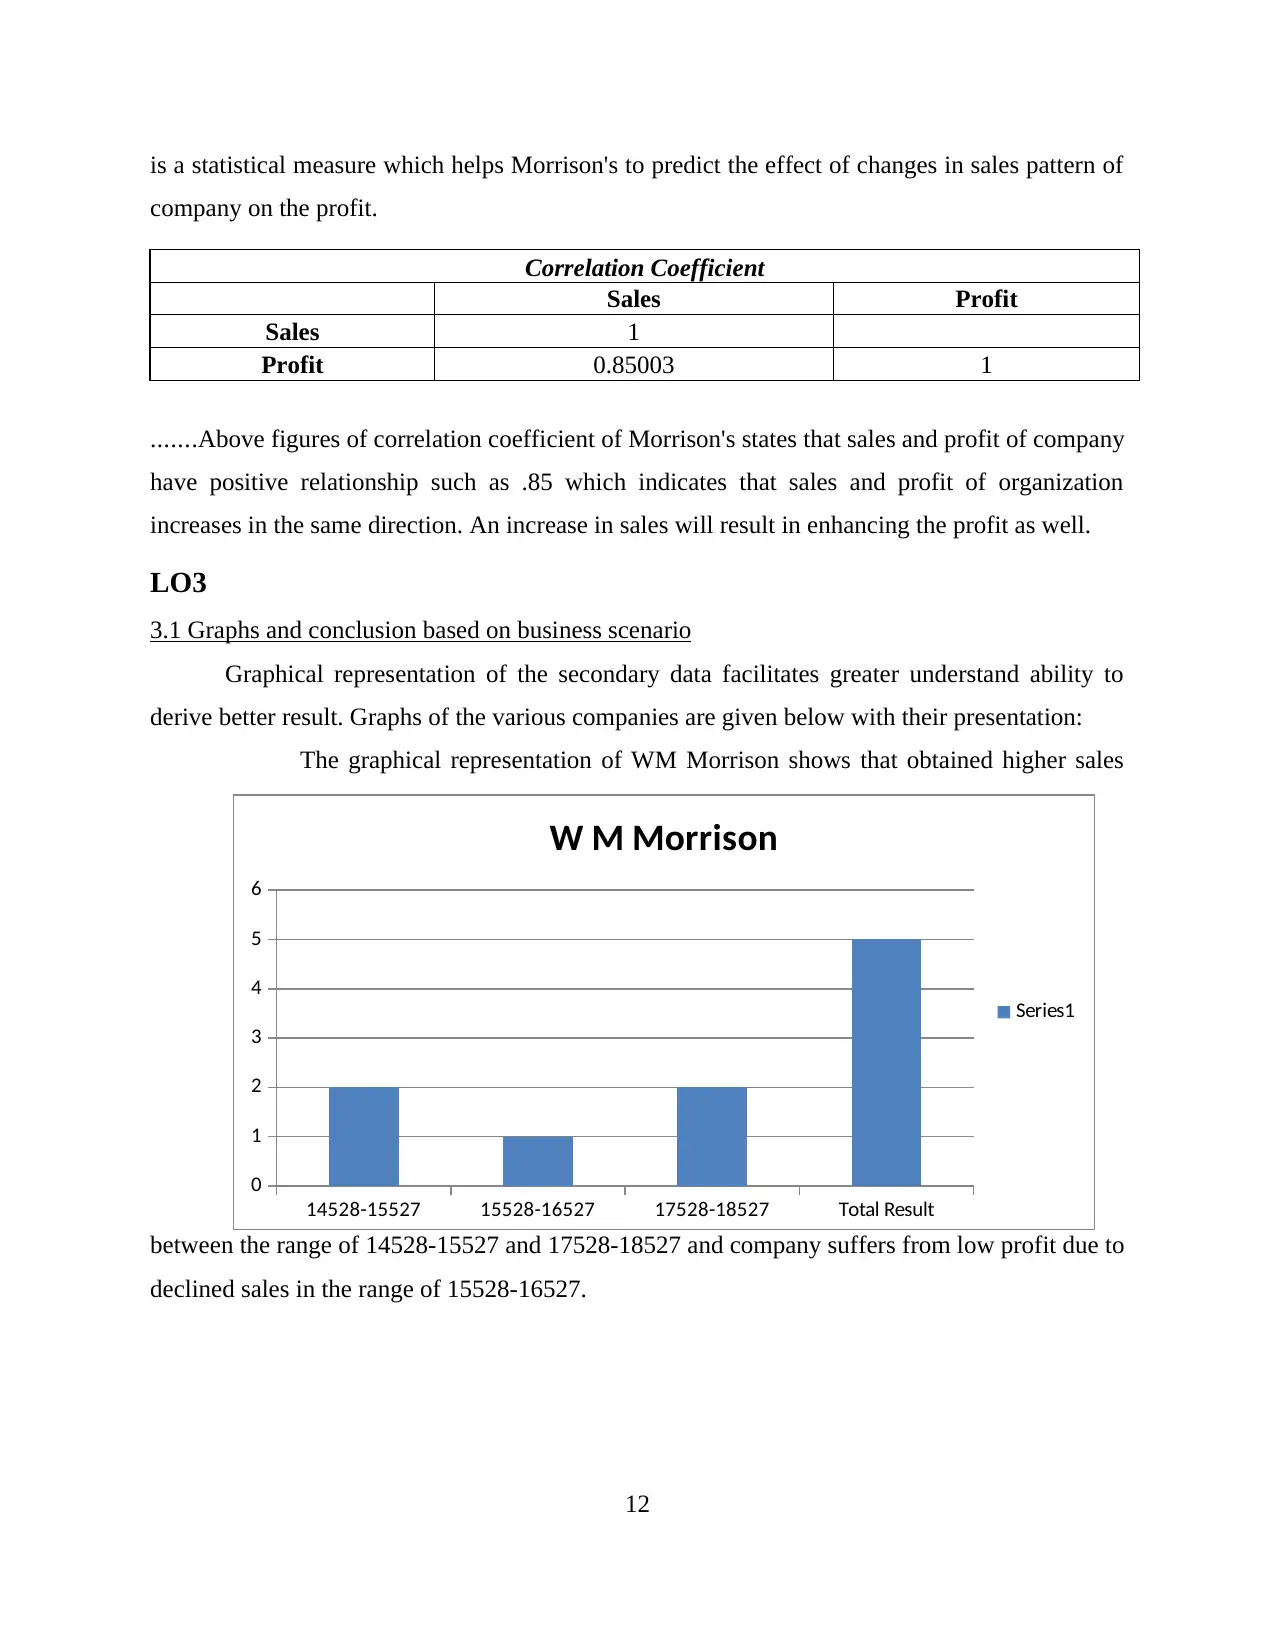
3.1 Graphs and conclusion based on business scenario
Graphical representation of the secondary data facilitates greater understand ability to
derive better result. Graphs of the various companies are given below with their presentation:
The graphical representation of WM Morrison shows that obtained higher sales
between the range of 14528-15527 and 17528-18527 and company suffers from low profit due to
declined sales in the range of 15528-16527.
12
14528-15527 15528-16527 17528-18527 Total Result
0
1
2
3
4
5
6
W M Morrison
Series1
company on the profit.
Correlation Coefficient
Sales Profit
Sales 1
Profit 0.85003 1
.......Above figures of correlation coefficient of Morrison's states that sales and profit of company
have positive relationship such as .85 which indicates that sales and profit of organization
increases in the same direction. An increase in sales will result in enhancing the profit as well.
LO3
3.1 Graphs and conclusion based on business scenario
Graphical representation of the secondary data facilitates greater understand ability to
derive better result. Graphs of the various companies are given below with their presentation:
The graphical representation of WM Morrison shows that obtained higher sales
between the range of 14528-15527 and 17528-18527 and company suffers from low profit due to
declined sales in the range of 15528-16527.
12
14528-15527 15528-16527 17528-18527 Total Result
0
1
2
3
4
5
6
W M Morrison
Series1
⊘ This is a preview!⊘
Do you want full access?
Subscribe today to unlock all pages.
Trusted by 1+ million students worldwide
1 out of 22
Related Documents


Your All-in-One AI-Powered Toolkit for Academic Success.
+13062052269
info@desklib.com
Available 24*7 on WhatsApp / Email
![[object Object]](/_next/static/media/star-bottom.7253800d.svg)
Unlock your academic potential
Copyright © 2020–2026 A2Z Services. All Rights Reserved. Developed and managed by ZUCOL.