Business Decision Making Report: Ann's College Performance Analysis
VerifiedAdded on  2020/07/22
|15
|2279
|39
Report
AI Summary
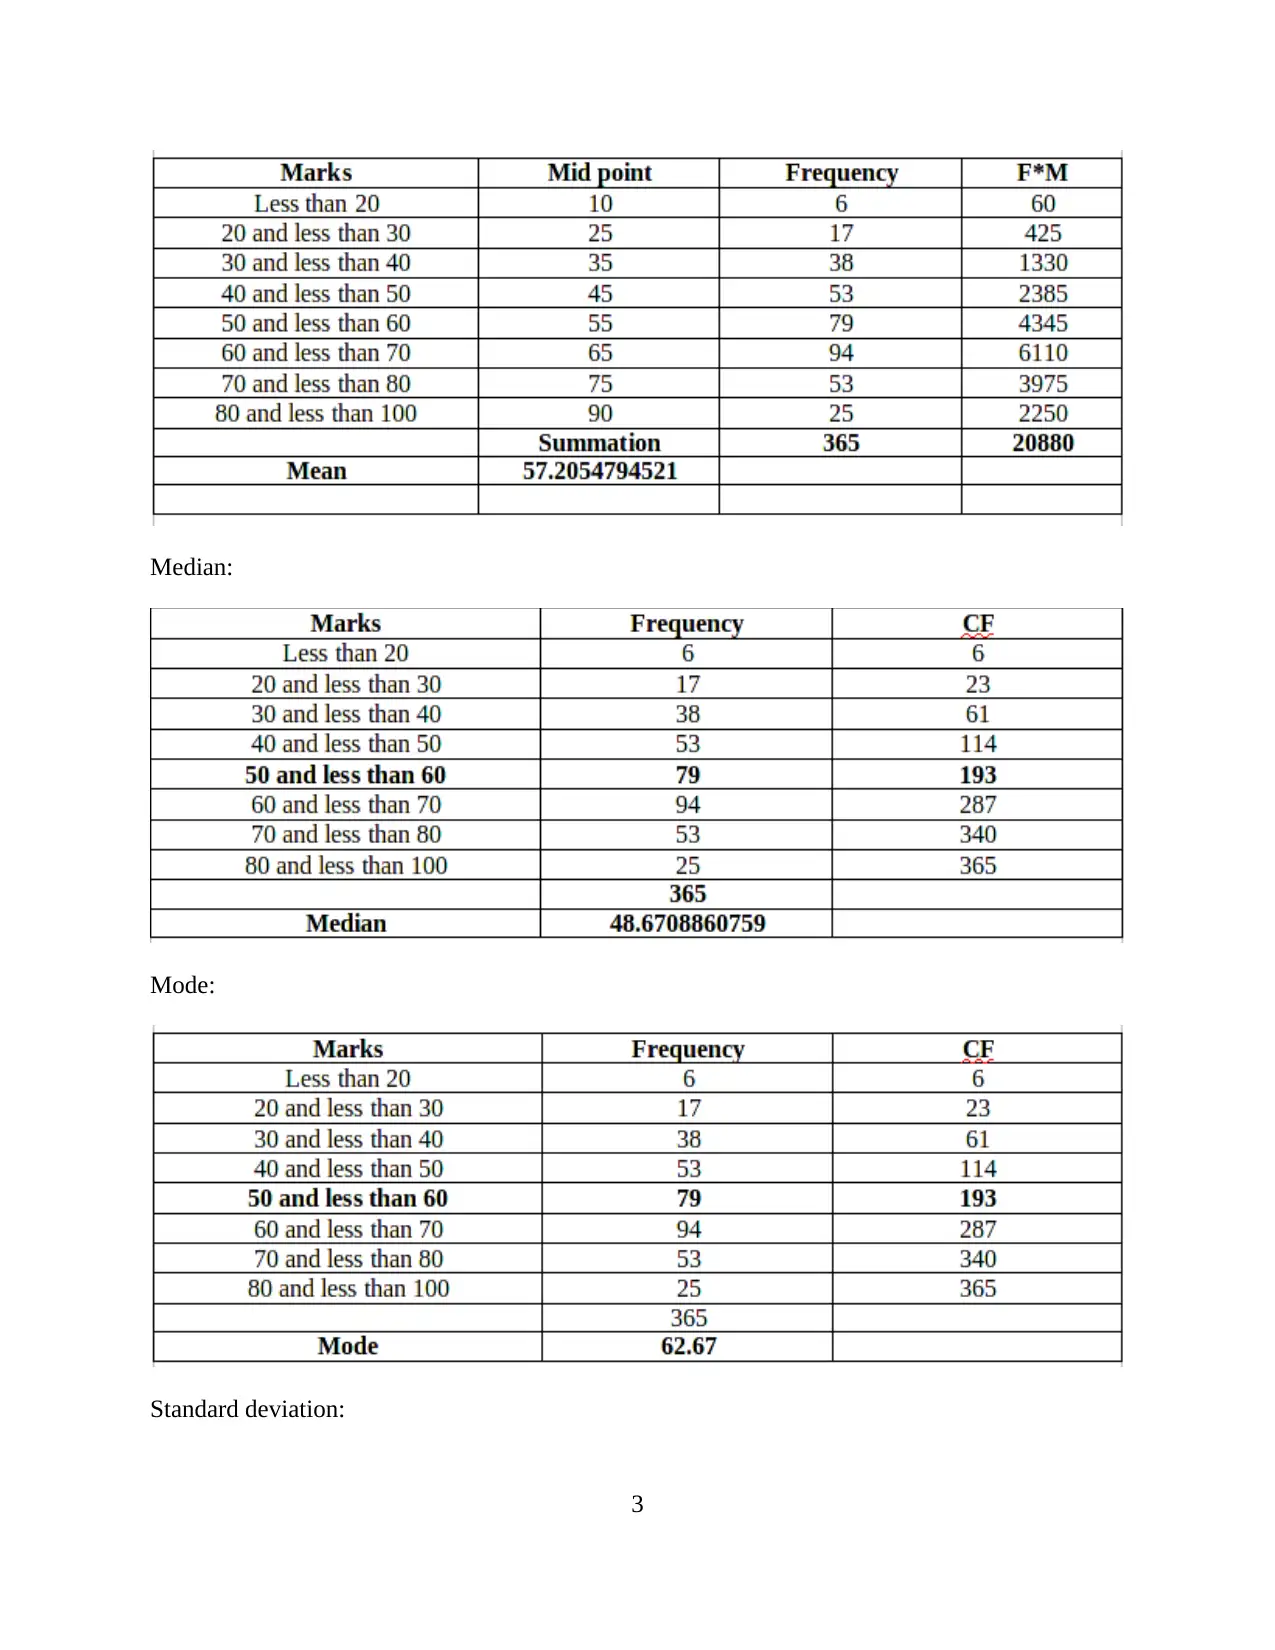
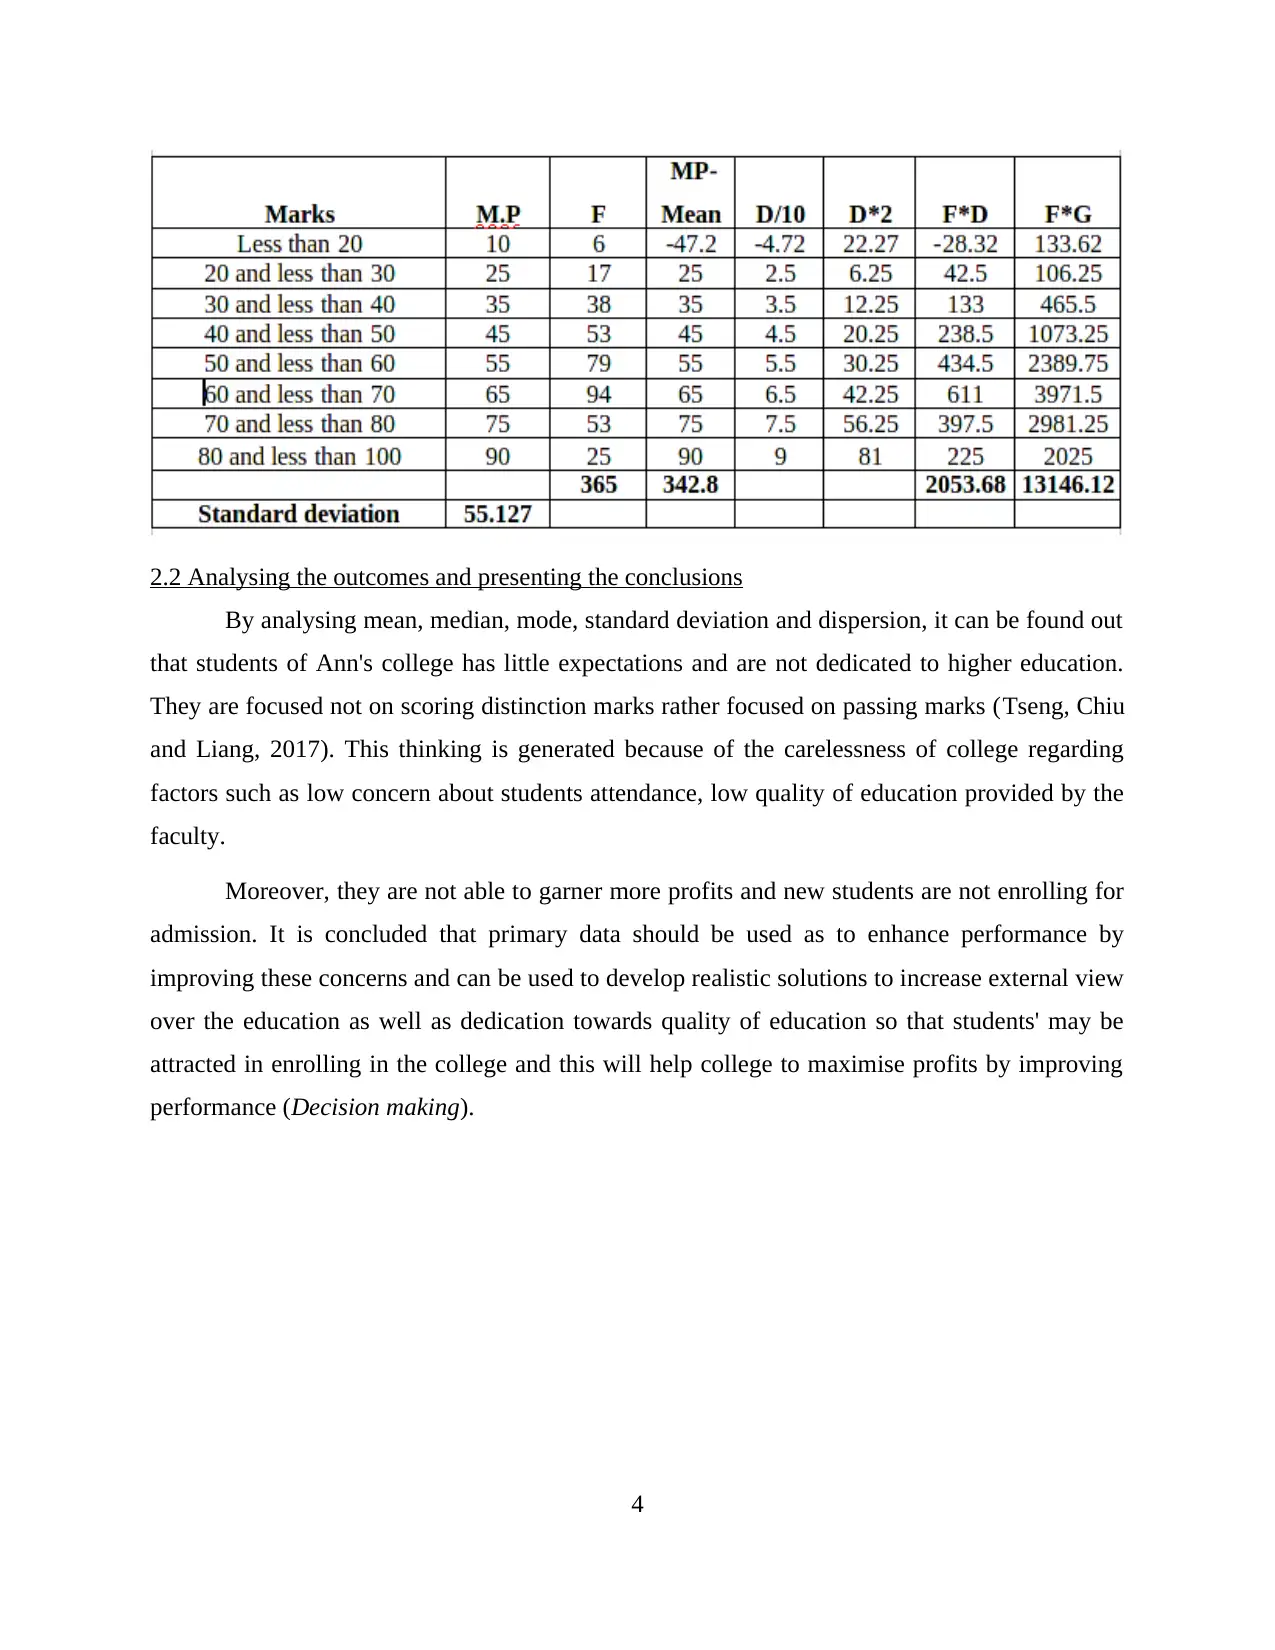
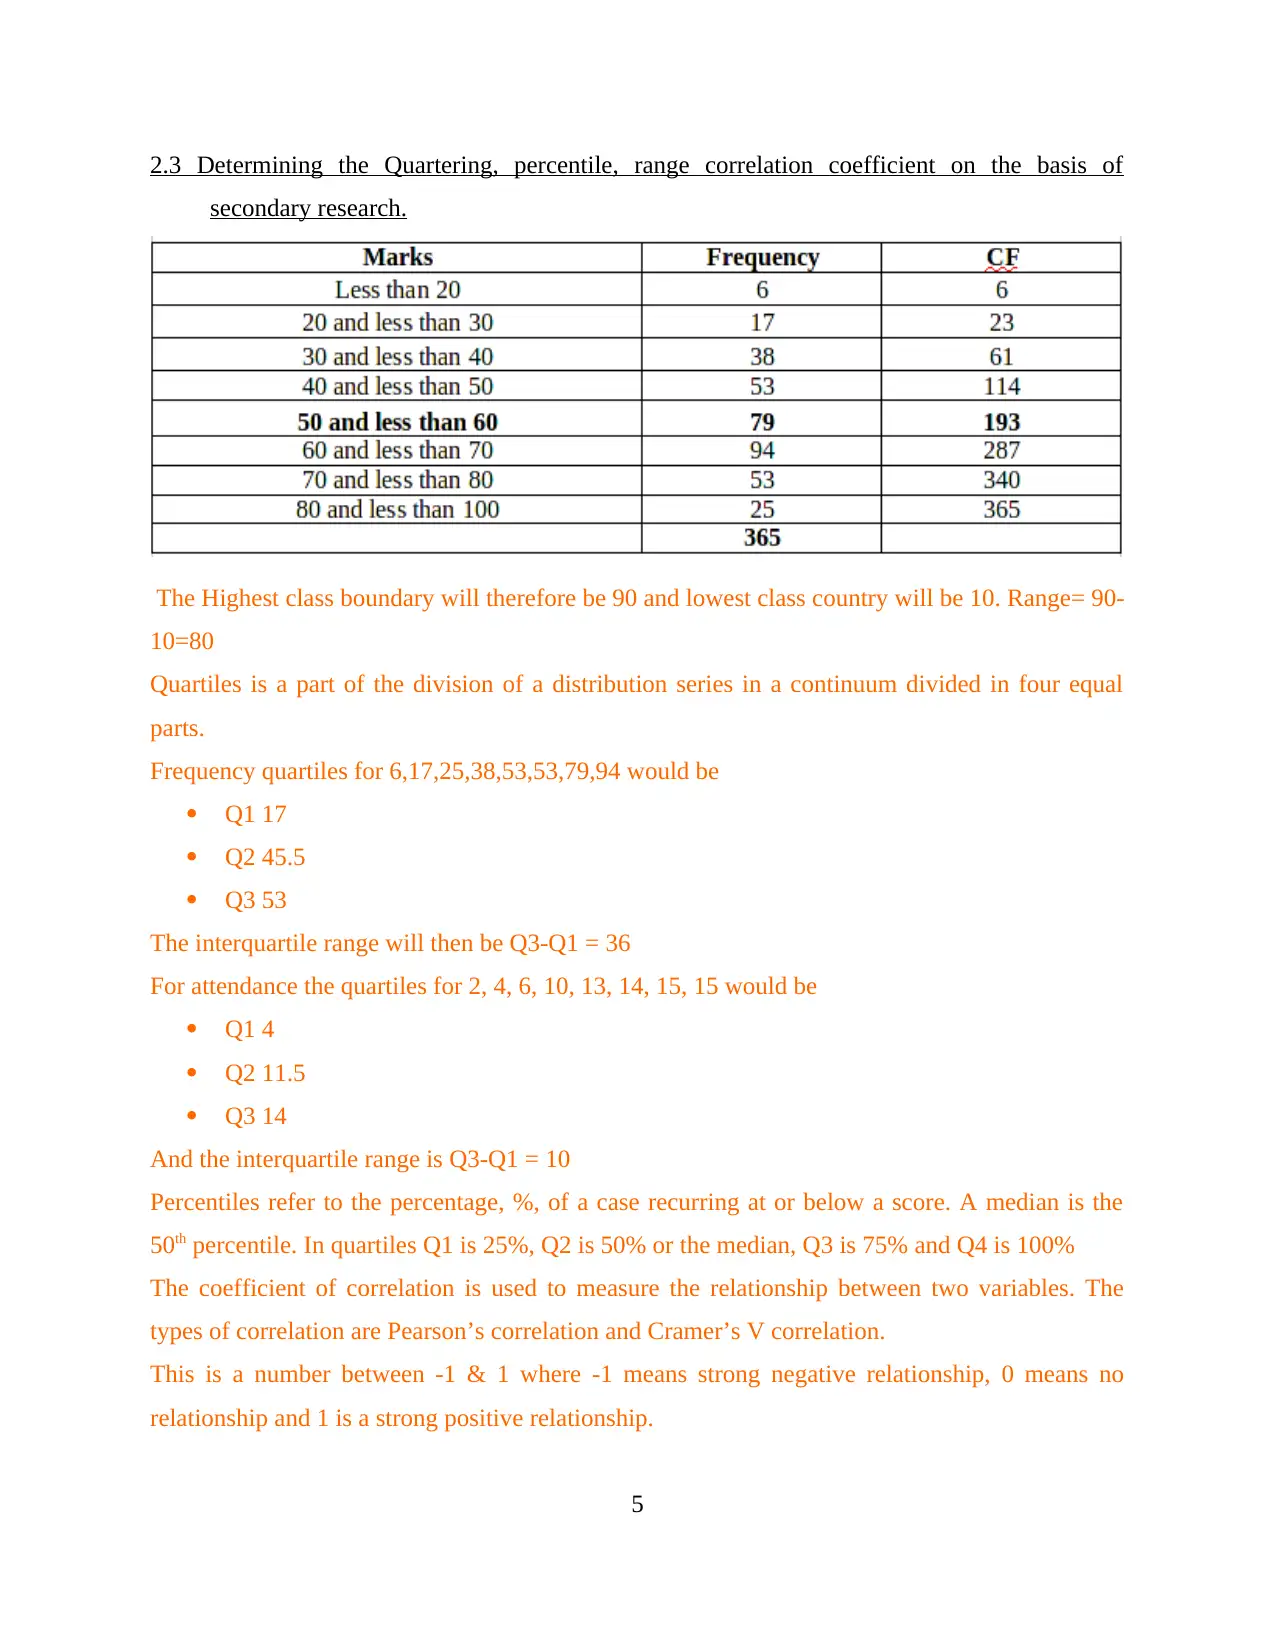
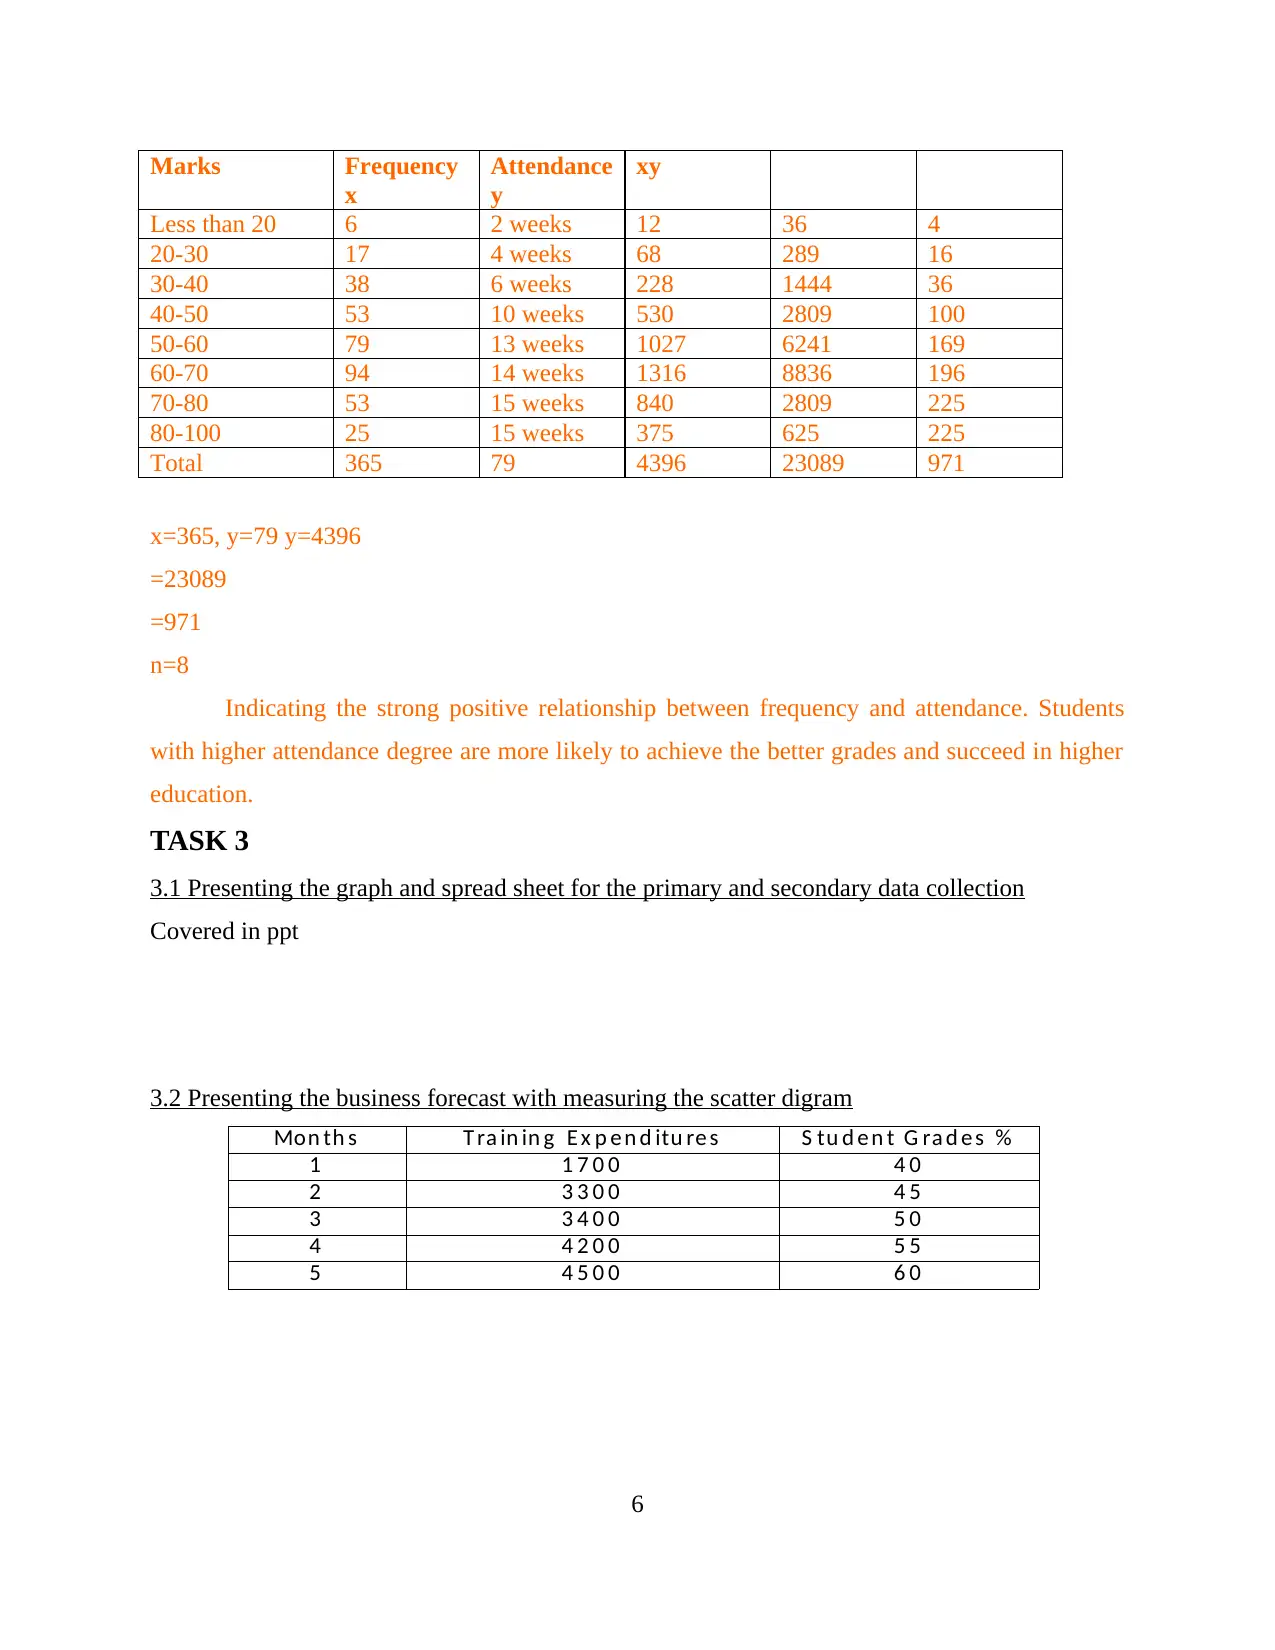
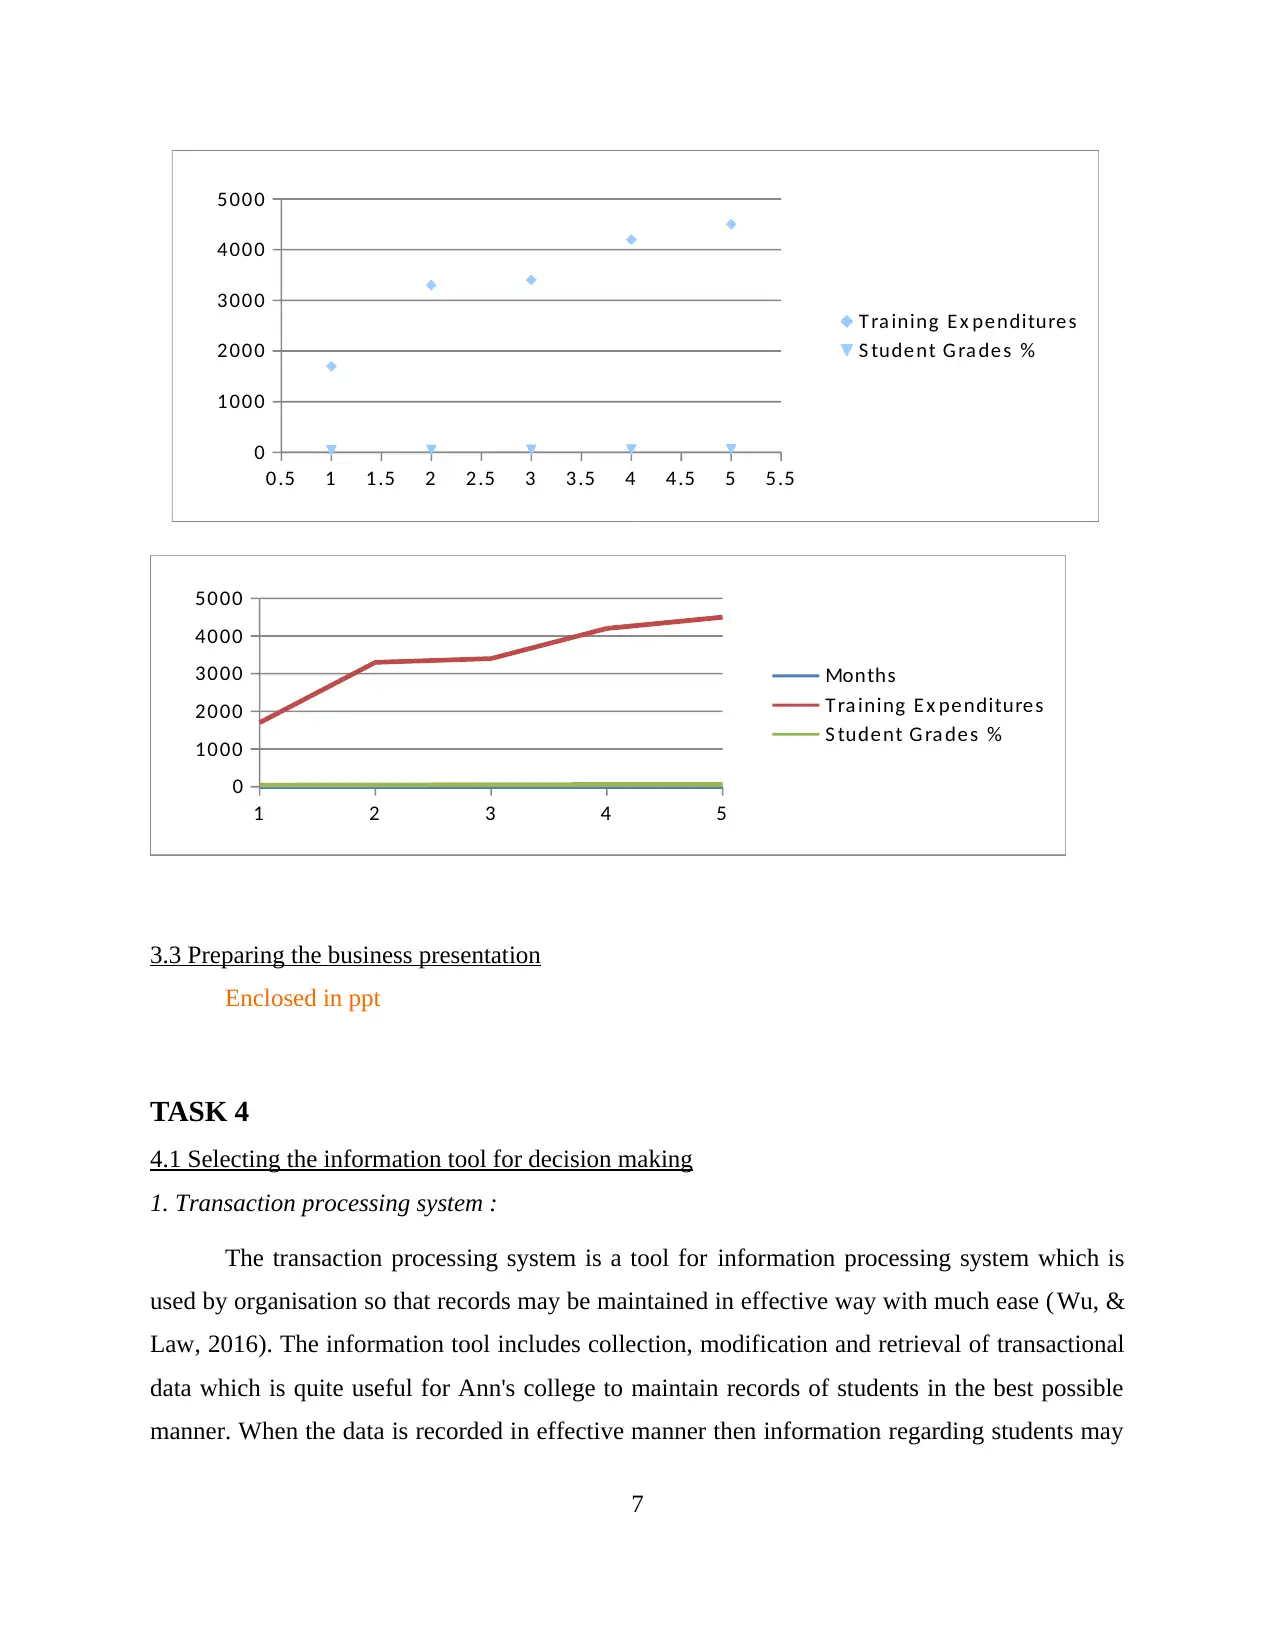
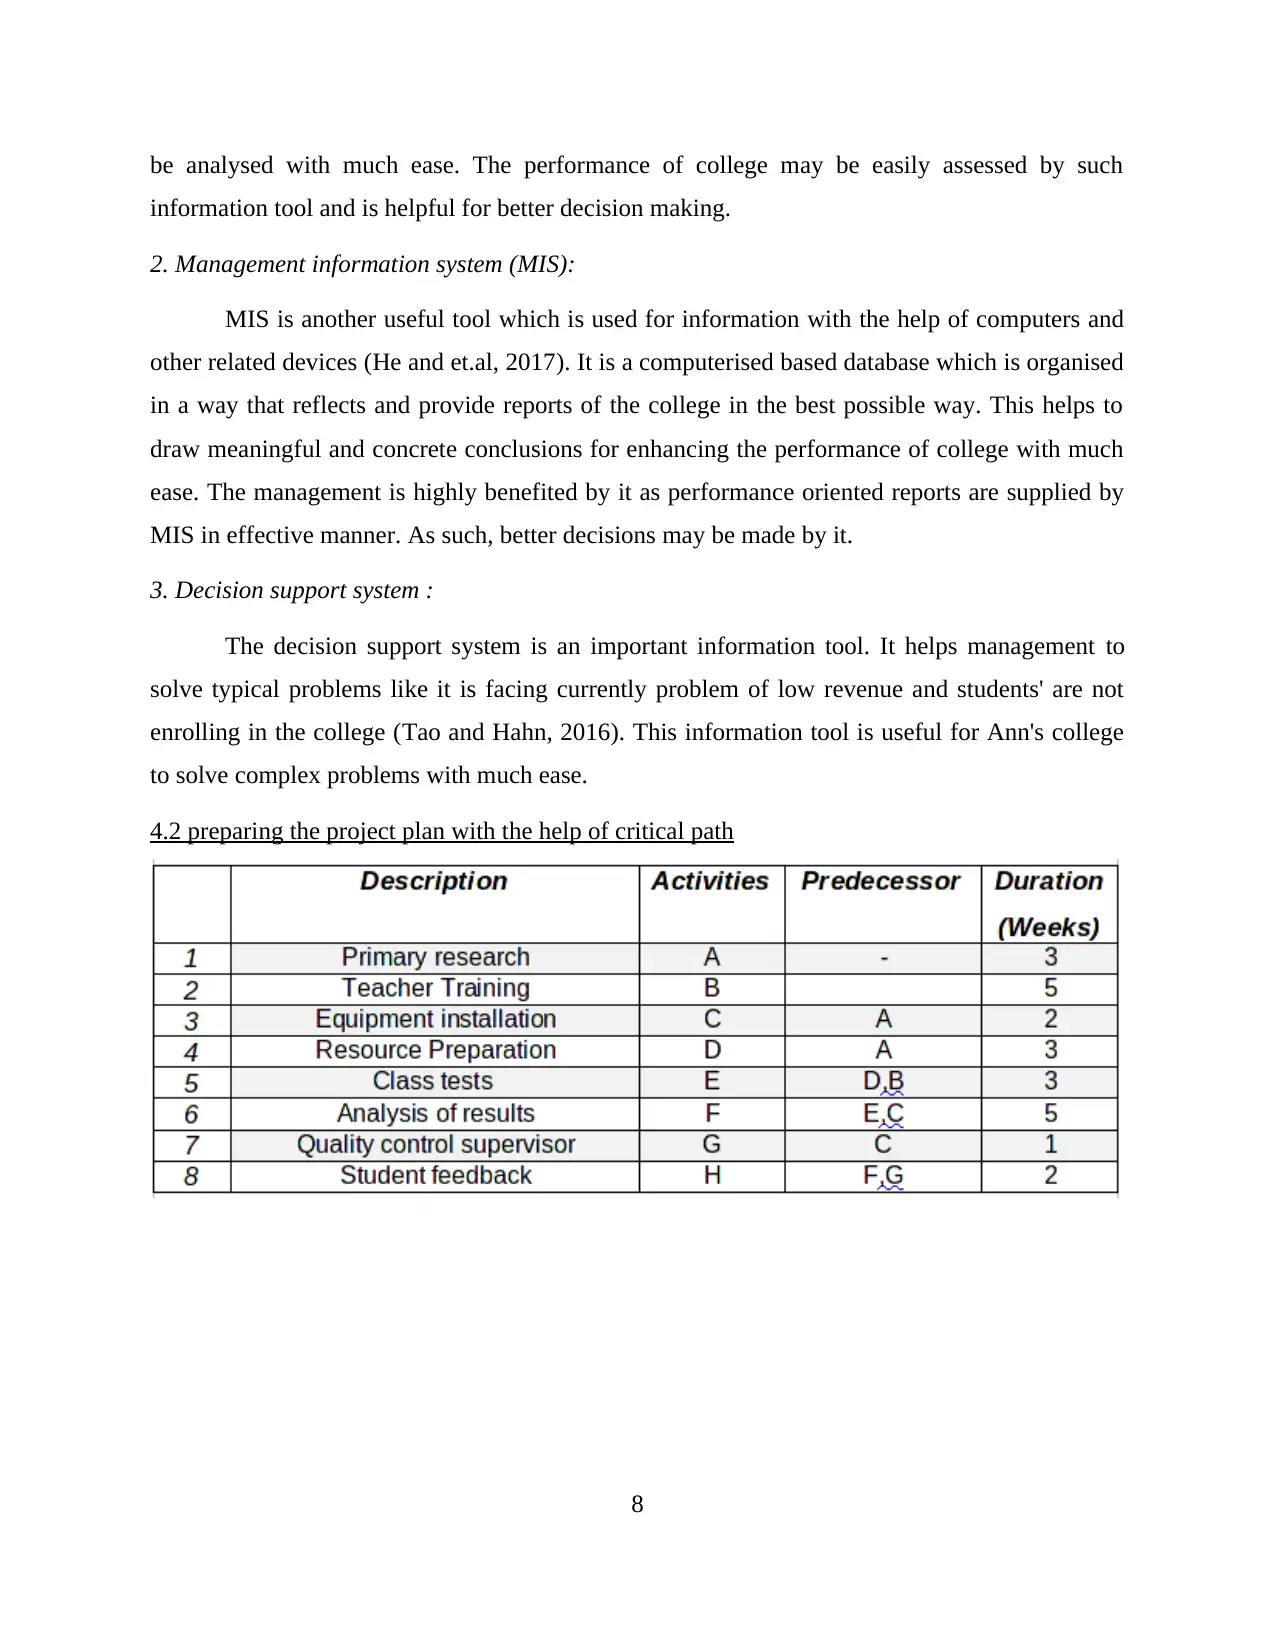
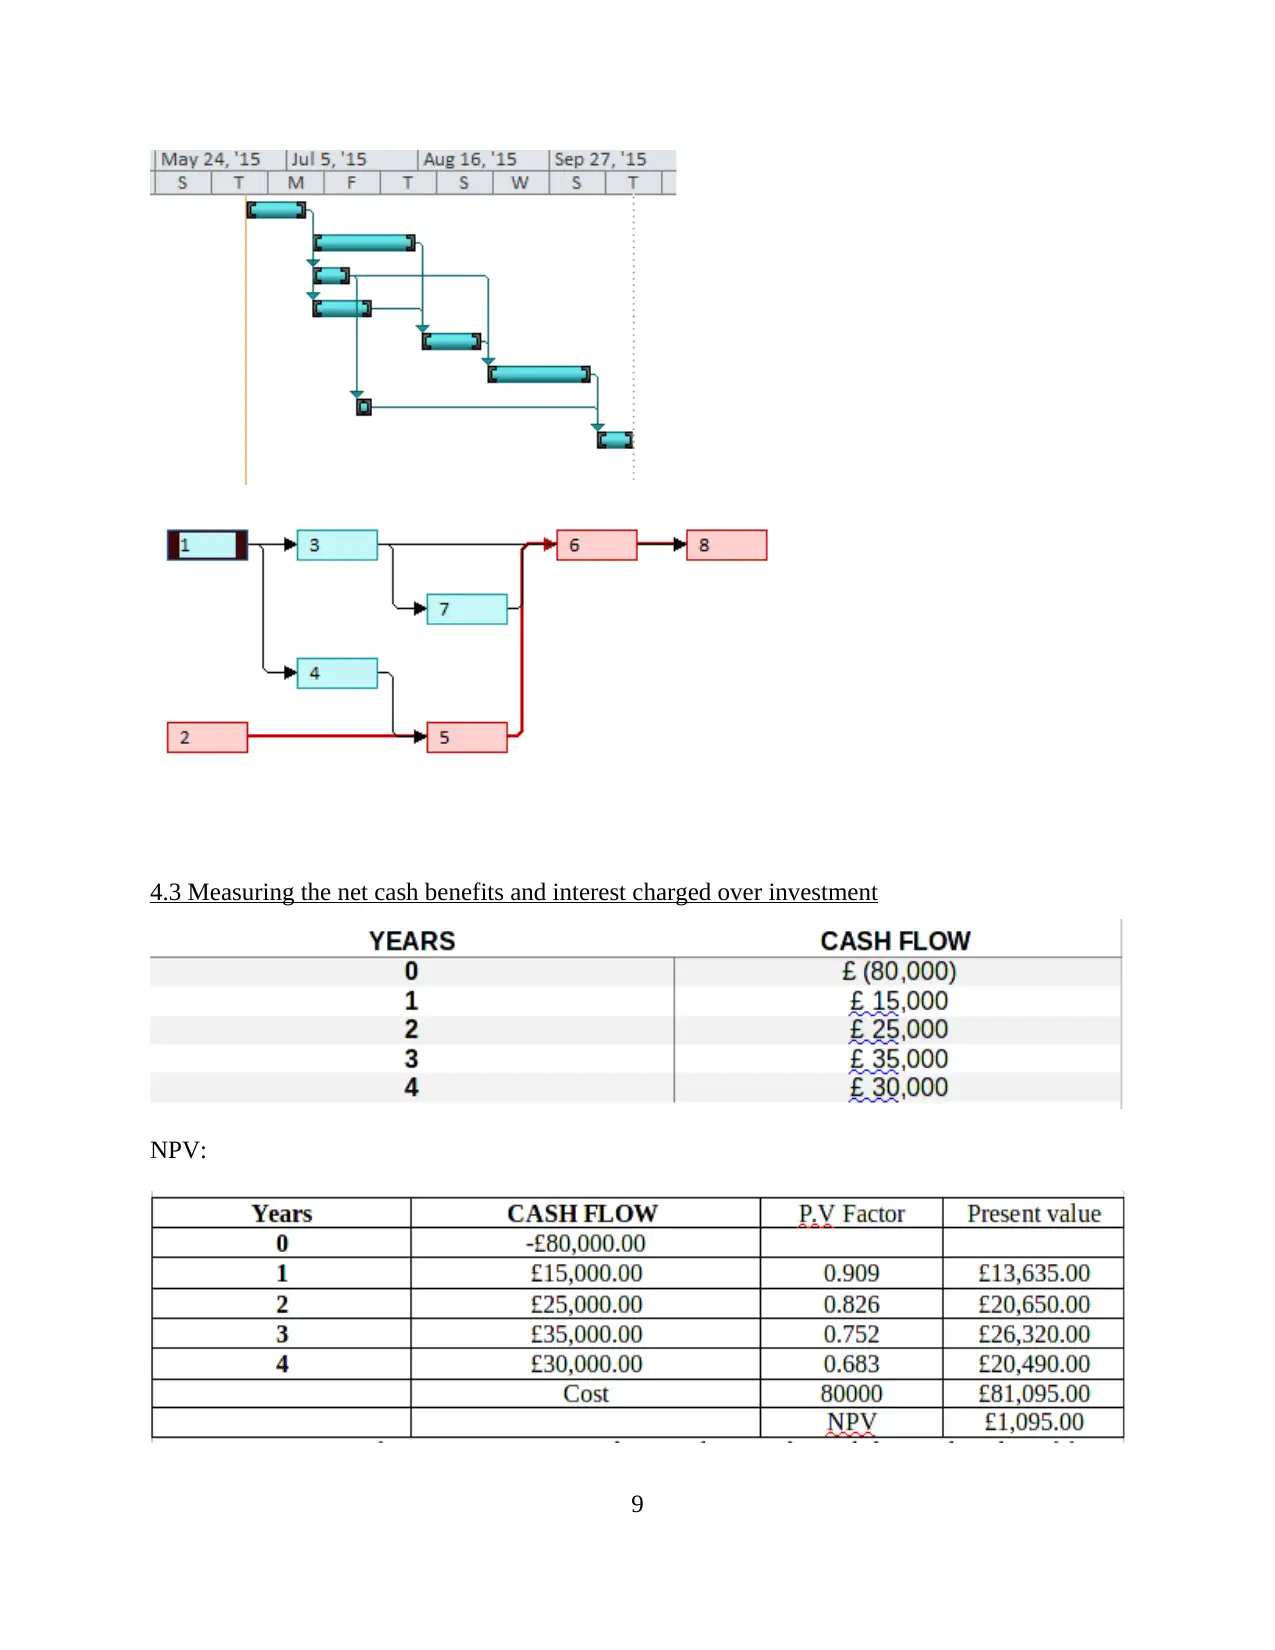
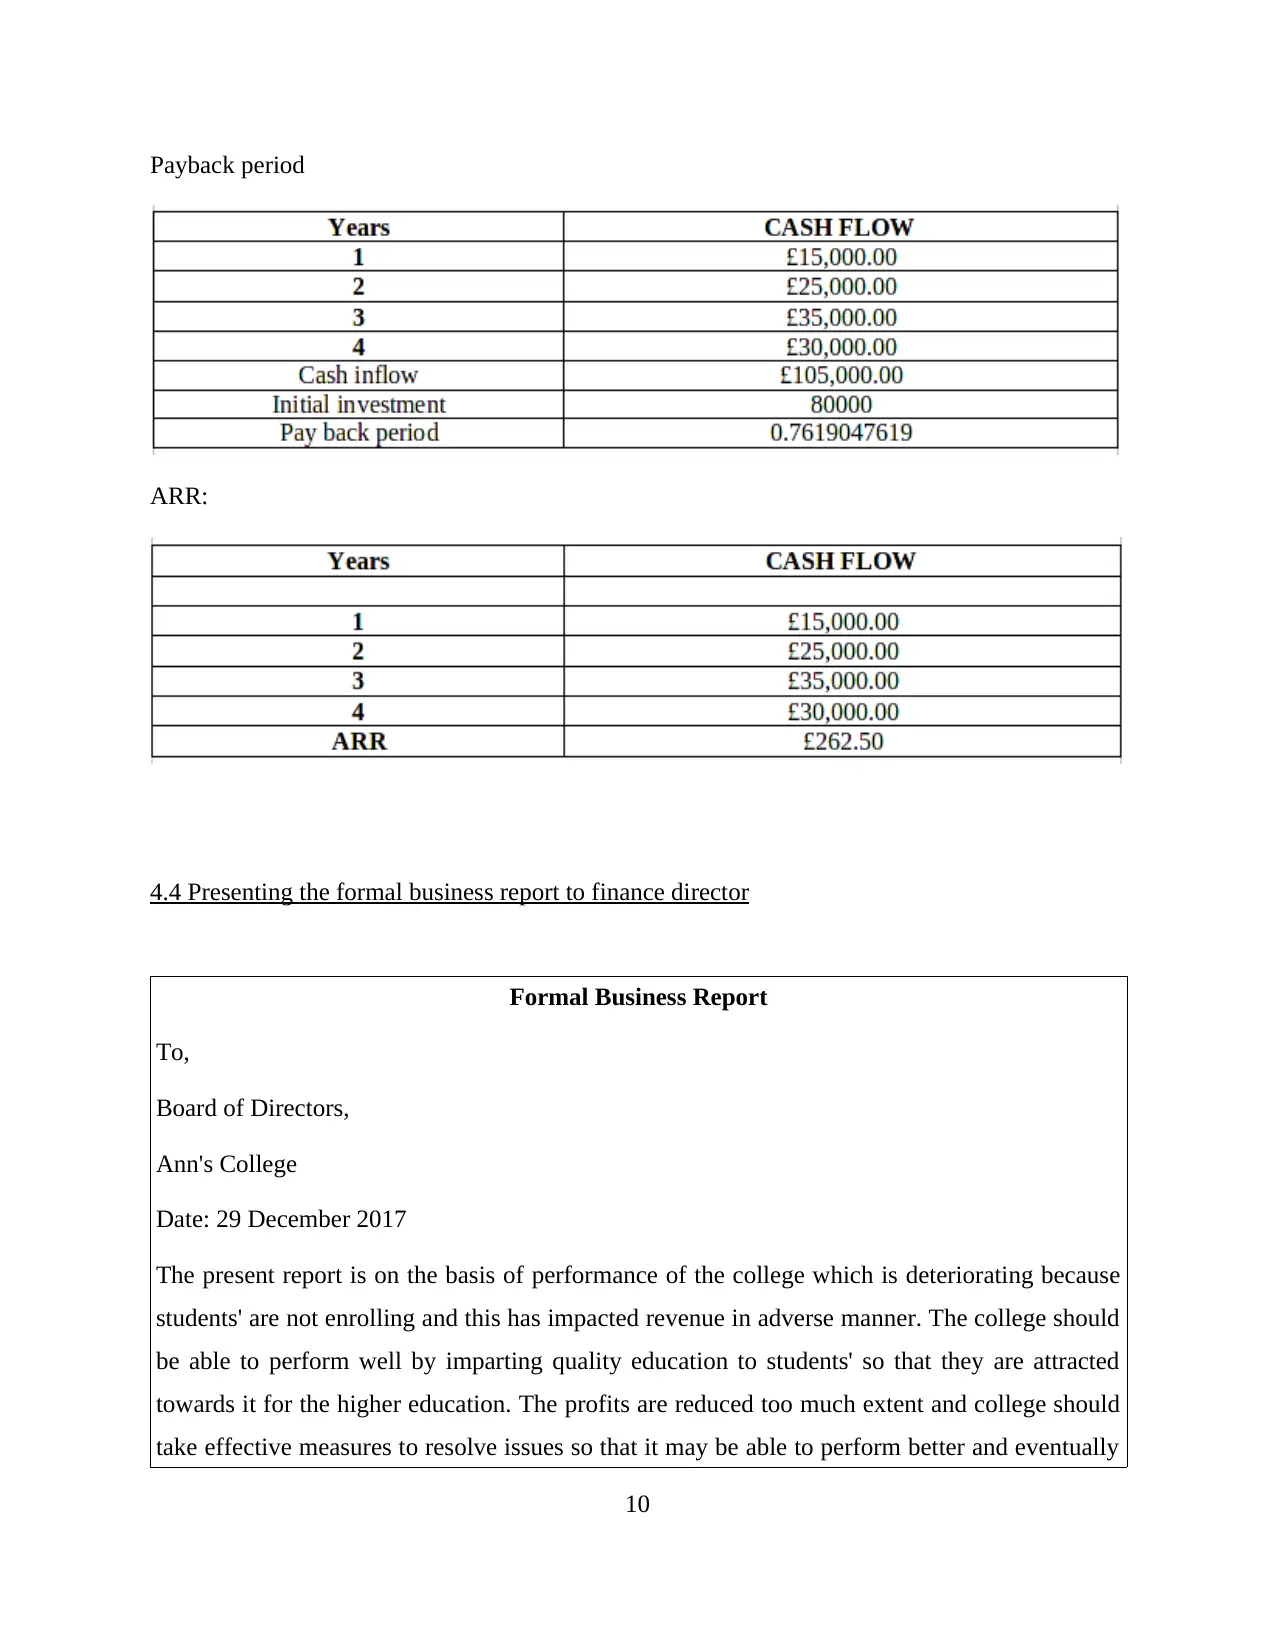
This report provides a comprehensive analysis of business decision-making, focusing on the challenges faced by Ann's College, including declining revenue and student enrollment. The report begins with an introduction to the business and its problems, followed by a research plan that outlines the collection of both primary and secondary data. It details the use of questionnaires for primary research and explains the sampling frame employed. The analysis includes the calculation of mean, median, mode, and standard deviation to summarize the collected data, with a subsequent analysis of the outcomes and conclusions drawn from the data. The report also covers the calculation of quartiles, percentiles, range, and correlation coefficients based on secondary research. It incorporates graphs and spreadsheets to present both primary and secondary data, along with business forecasts using scatter diagrams. Furthermore, the report explores information tools for decision-making, project planning using critical path analysis, and the measurement of net cash benefits and interest charged over investment, culminating in a formal business report presented to the finance director. The report concludes with recommendations for improving the college's performance and revenue generation through enhanced data analysis and strategic decision-making.

Business Decision Making
Paraphrase This Document
Need a fresh take? Get an instant paraphrase of this document with our AI Paraphraser

TABLE OF CONTENTS
INTRODUCTION...........................................................................................................................1
TASK 1............................................................................................................................................1
1.1 Describing the business and the problems faced by them................................................1
1.2 Presenting the primary and secondary research plan to analyse business obstacles........1
1.3 Presenting the primary research plan with the help of questionnaire...............................1
1.4 Determining the sampling frame for collection of informations......................................3
TASK 2............................................................................................................................................3
2.1 Measuring the mean, mode, median and standard deviation by summarising the data.. .3
2.2 Analysing the outcomes and presenting the conclusions.................................................5
2.3 Determining the Quartering, percentile, range correlation coefficient on the basis of
secondary research..................................................................................................................5
TASK 3............................................................................................................................................6
3.1 Presenting the graph and spread sheet for the primary and secondary data collection....6
3.2 Presenting the business forecast with measuring the scatter digram................................7
3.3 Preparing the business presentation..................................................................................7
TASK 4............................................................................................................................................7
4.1 Selecting the information tool for decision making.........................................................7
4.2 preparing the project plan with the help of critical path...................................................8
4.3 Measuring the net cash benefits and interest charged over investment............................9
4.4 Presenting the formal business report to finance director................................................9
CONCLUSION..............................................................................................................................10

INTRODUCTION
In order to make improvement of business performance there is need to make the
adequate analysis over the financial outcomes and present the fruitful decision in this context.
The present report deals with Ann's college which is facing problems regarding low revenue and
reduced enrolment of students in it (Babajana and Phillips, 2016). It is important that it should
take effective business decisions so that issues may be resolved by it in the most proficient way.
The data may be gathered in effective way and as such, decisions may be taken so that profits are
maximised and issues may also be removed up to higher extent.
TASK 1
1.1 Describing the business and the problems faced by them
The problems faced by Ann's college is that it is unable to make revenue as students are
decreasing. The college is facing serious problem as its performance is going down which is not
a good sign. As such, college needs to collect data and then analyse the same and then draw valid
conclusions. It should be able to identify the root cause behind such decline in performance and
as such, measures be taken by it so that performance may be increased too much extent. This will
automatically help college to achieve its objectives and performance may be increased which
will eventually provide better revenue in the most proficient way (Gong, Koh and Tan, 2016).
The business of college may be channelised in the most proficient way by collecting the primary
and secondary data. This data will provide clarity to Ann's college and in accordance with this, it
may formulate decision-making for the betterment of it and then performance may be improved
in the best possible way by gaining more profits. This way problems faced by it may be resolved
up too much extent.
1.2 Presenting the primary and secondary research plan to analyse business obstacles
1.3 Presenting the primary research plan with the help of questionnaire
Covered in ppt
1.4 Determining the sampling frame for collection of informations
The sampling frame is also an important criterion while collecting information. While,
doing so, it is practically not possible to include all the information available from the universe.
As such, sampling method is used which represents the universe (Jorgensen, Trotter and Hill,
2016). The simple random sampling can be used by Ann's college which will be representation
1
⊘ This is a preview!⊘
Do you want full access?
Subscribe today to unlock all pages.

Trusted by 1+ million students worldwide

of all the students. This method is simple to use and information can be generated with much
ease. It is so as no parameter is used. This method is free and randomly determine from the
information.
Ann's college can use 30 sample size of sampling by providing online questionnaire
forms to be filled by the respondents for producing effective and authentic information to
enhance decisions for the betterment of it.
TASK 2
2.1 Measuring the mean, mode, median and standard deviation by summarising the data
Mean:
2
Paraphrase This Document
Need a fresh take? Get an instant paraphrase of this document with our AI Paraphraser

Median:
Mode:
Standard deviation:
3
Mode:
Standard deviation:
3

2.2 Analysing the outcomes and presenting the conclusions
By analysing mean, median, mode, standard deviation and dispersion, it can be found out
that students of Ann's college has little expectations and are not dedicated to higher education.
They are focused not on scoring distinction marks rather focused on passing marks (Tseng, Chiu
and Liang, 2017). This thinking is generated because of the carelessness of college regarding
factors such as low concern about students attendance, low quality of education provided by the
faculty.
Moreover, they are not able to garner more profits and new students are not enrolling for
admission. It is concluded that primary data should be used as to enhance performance by
improving these concerns and can be used to develop realistic solutions to increase external view
over the education as well as dedication towards quality of education so that students' may be
attracted in enrolling in the college and this will help college to maximise profits by improving
performance (Decision making).
4
⊘ This is a preview!⊘
Do you want full access?
Subscribe today to unlock all pages.

Trusted by 1+ million students worldwide

2.3 Determining the Quartering, percentile, range correlation coefficient on the basis of
secondary research.
The Highest class boundary will therefore be 90 and lowest class country will be 10. Range= 90-
10=80
Quartiles is a part of the division of a distribution series in a continuum divided in four equal
parts.
Frequency quartiles for 6,17,25,38,53,53,79,94 would be
ï‚· Q1 17
ï‚· Q2 45.5
ï‚· Q3 53
The interquartile range will then be Q3-Q1 = 36
For attendance the quartiles for 2, 4, 6, 10, 13, 14, 15, 15 would be
ï‚· Q1 4
ï‚· Q2 11.5
ï‚· Q3 14
And the interquartile range is Q3-Q1 = 10
Percentiles refer to the percentage, %, of a case recurring at or below a score. A median is the
50th percentile. In quartiles Q1 is 25%, Q2 is 50% or the median, Q3 is 75% and Q4 is 100%
The coefficient of correlation is used to measure the relationship between two variables. The
types of correlation are Pearson’s correlation and Cramer’s V correlation.
This is a number between -1 & 1 where -1 means strong negative relationship, 0 means no
relationship and 1 is a strong positive relationship.
5
Paraphrase This Document
Need a fresh take? Get an instant paraphrase of this document with our AI Paraphraser

Marks Frequency
x
Attendance
y
xy
Less than 20 6 2 weeks 12 36 4
20-30 17 4 weeks 68 289 16
30-40 38 6 weeks 228 1444 36
40-50 53 10 weeks 530 2809 100
50-60 79 13 weeks 1027 6241 169
60-70 94 14 weeks 1316 8836 196
70-80 53 15 weeks 840 2809 225
80-100 25 15 weeks 375 625 225
Total 365 79 4396 23089 971
x=365, y=79 y=4396
=23089
=971
n=8
Indicating the strong positive relationship between frequency and attendance. Students
with higher attendance degree are more likely to achieve the better grades and succeed in higher
education.
TASK 3
3.1 Presenting the graph and spread sheet for the primary and secondary data collection
Covered in ppt
3.2 Presenting the business forecast with measuring the scatter digram
Mon th s T ra in in g E x p e n d itu re s S tu d e n t G ra d e s %
1 1 7 0 0 4 0
2 3 3 0 0 4 5
3 3 4 0 0 5 0
4 4 2 0 0 5 5
5 4 5 0 0 6 0
6

0.5 1 1.5 2 2.5 3 3.5 4 4.5 5 5.5
0
1000
2000
3000
4000
5000
T ra ining E x penditure s
S tude nt G ra de s %
1 2 3 4 5
0
1000
2000
3000
4000
5000
Months
T ra ining E x penditures
S tudent G ra des %
3.3 Preparing the business presentation
Enclosed in ppt
TASK 4
4.1 Selecting the information tool for decision making
1. Transaction processing system :
The transaction processing system is a tool for information processing system which is
used by organisation so that records may be maintained in effective way with much ease ( Wu, &
Law, 2016). The information tool includes collection, modification and retrieval of transactional
data which is quite useful for Ann's college to maintain records of students in the best possible
manner. When the data is recorded in effective manner then information regarding students may
7
0
1000
2000
3000
4000
5000
T ra ining E x penditure s
S tude nt G ra de s %
1 2 3 4 5
0
1000
2000
3000
4000
5000
Months
T ra ining E x penditures
S tudent G ra des %
3.3 Preparing the business presentation
Enclosed in ppt
TASK 4
4.1 Selecting the information tool for decision making
1. Transaction processing system :
The transaction processing system is a tool for information processing system which is
used by organisation so that records may be maintained in effective way with much ease ( Wu, &
Law, 2016). The information tool includes collection, modification and retrieval of transactional
data which is quite useful for Ann's college to maintain records of students in the best possible
manner. When the data is recorded in effective manner then information regarding students may
7
⊘ This is a preview!⊘
Do you want full access?
Subscribe today to unlock all pages.

Trusted by 1+ million students worldwide

be analysed with much ease. The performance of college may be easily assessed by such
information tool and is helpful for better decision making.
2. Management information system (MIS):
MIS is another useful tool which is used for information with the help of computers and
other related devices (He and et.al, 2017). It is a computerised based database which is organised
in a way that reflects and provide reports of the college in the best possible way. This helps to
draw meaningful and concrete conclusions for enhancing the performance of college with much
ease. The management is highly benefited by it as performance oriented reports are supplied by
MIS in effective manner. As such, better decisions may be made by it.
3. Decision support system :
The decision support system is an important information tool. It helps management to
solve typical problems like it is facing currently problem of low revenue and students' are not
enrolling in the college (Tao and Hahn, 2016). This information tool is useful for Ann's college
to solve complex problems with much ease.
4.2 preparing the project plan with the help of critical path
8
Paraphrase This Document
Need a fresh take? Get an instant paraphrase of this document with our AI Paraphraser

4.3 Measuring the net cash benefits and interest charged over investment
NPV:
9
NPV:
9

Payback period
ARR:
4.4 Presenting the formal business report to finance director
Formal Business Report
To,
Board of Directors,
Ann's College
Date: 29 December 2017
The present report is on the basis of performance of the college which is deteriorating because
students' are not enrolling and this has impacted revenue in adverse manner. The college should
be able to perform well by imparting quality education to students' so that they are attracted
towards it for the higher education. The profits are reduced too much extent and college should
take effective measures to resolve issues so that it may be able to perform better and eventually
10
⊘ This is a preview!⊘
Do you want full access?
Subscribe today to unlock all pages.

Trusted by 1+ million students worldwide
1 out of 15
Related Documents

Your All-in-One AI-Powered Toolkit for Academic Success.
 +13062052269
info@desklib.com
Available 24*7 on WhatsApp / Email
Unlock your academic potential
Copyright © 2020–2025 A2Z Services. All Rights Reserved. Developed and managed by ZUCOL.