Business Decision-Making Report: Data Analysis for TUI Group
VerifiedAdded on 2020/01/28
|16
|3953
|56
Report
AI Summary
This report provides a comprehensive analysis of business decision-making within the TUI Group. It begins by outlining a plan for gathering primary and secondary data, detailing survey techniques, and designing a questionnaire. The report then summarizes raw data, analyzes results, measures dispersion, and utilizes quartiles, percentiles, and correlation coefficients to aid decision-making. Task 3 includes the creation of graphs, chart, trend line analysis, business presentation and a formal business report. The report also explores appropriate information processing tools, project planning, and financial tools such as investment appraisal and cost-volume-profit analysis to assess the best options for TUI Group. Overall, the report aims to provide a thorough understanding of data-driven decision-making processes and strategies for the TUI Group.

BUSINESS
DECISION-MAKING
DECISION-MAKING
Paraphrase This Document
Need a fresh take? Get an instant paraphrase of this document with our AI Paraphraser
Table of Contents
INTRODUCTION...........................................................................................................................3
TASK. 1...........................................................................................................................................3
1.1 Design a plan for gathering of primary and secondary data in a TUI group:................3
1.2 Present the survey techniques and sampling frame:.........................................................4
1.3 Design a questionnaire:....................................................................................................4
TASK.2............................................................................................................................................5
2.1 Create information by summarising the raw data ............................................................5
2.2 Analyse the range of results:............................................................................................6
2.3 Analyse the measure of dispersion:..................................................................................7
2.4 Quartiles, percentile and correlation coefficient is utilised to assist the decision making:7
TASK.3............................................................................................................................................8
3.1 Graphs and chart:..............................................................................................................8
3.2 Trend line of TUI group in 2017 and 2018 of sales:........................................................9
3.3 Business presentation: ...................................................................................................10
3.4 Formal business report:..................................................................................................10
TASK.4..........................................................................................................................................11
4.1 Appropriate information processing tools & making project plan and identification of
critical path:..........................................................................................................................11
4.3 Financial tools such as investment appraisal and cost-volume profit analysis to assess the
..............................................................................................................................................13
best options:..........................................................................................................................13
CONCLUSION..............................................................................................................................15
REFERENCES..............................................................................................................................16
INTRODUCTION
In every business organisation, decision making plays a very crucial role in the
management of an organisation. Now, there are so many qualified professionals who contributes
their knowledge for the betterment of an organisation. They make their decisions on their own
behalf in order to attain the association's long term goals and objectives(Brynjolfsson, Hitt, and
Kim,2011.). Now, every organisation is mainly focused for betterment of their business, and this
is only achieved by way of effective and efficient decision making. Company's business decision
are mainly dependent to top level executives and they tare the ultimate persons who are
responsible for the impacts of decision making and also they take credits if something goods
happens. However, without decision making, company are not able to make their strategies in an
most and effective manner(Net Present Value- NPV.2017).
TASK. 1
1.1 Design a plan for gathering of primary and secondary data in a TUI group:
Data are importance for the creation of better strategies for the firm. There are two main
kinds of data are there, i.e. primary and another one is secondary(Vercellis, 2011). However,
qualitative and quantitative data are also there, but, they works on the data which have already
been gathered. Quantitative data means the data where information accumulated from studies,
polls, repetitive questionnaire, etc these quantitative data are completely connected to numbers
and their main aim is to attain the outcomes through numericals. While on the other hands,
qualitative data are the data which have been entered in details(Craft, 2013). For any
organisation, both of the data are important for the production of better and most profitable
outcomes. Primary data is to be gathered by way of doing interviews, surveys, face to face
interactions and any other mode through which the organisation could directly approach to the
respondents and able to attain the useful informations that could be entitled for the development
of the association. But, In the cited scenario, it is very crucial to get the client feedbacks
nowadays as these assist the firm's managers to make a perfect plan for the product
modifications. The TUI Group is able to use their internet website, internet business link as a
resource to gather information by covering a short questionnaires. Secondary data are the data
which can be gathered from any of the sources which already exists(Fernando and Chowdhury,
2010). Like- books and journals, internet database, and any other mode through which company
⊘ This is a preview!⊘
Do you want full access?
Subscribe today to unlock all pages.
Trusted by 1+ million students worldwide
could collect the data in an easiest format. Primary data is not an easy task for gathering the data
but, on the other hands, secondary data is so easy way fro gathering the data and this could be the
cheapest way to gather the information.
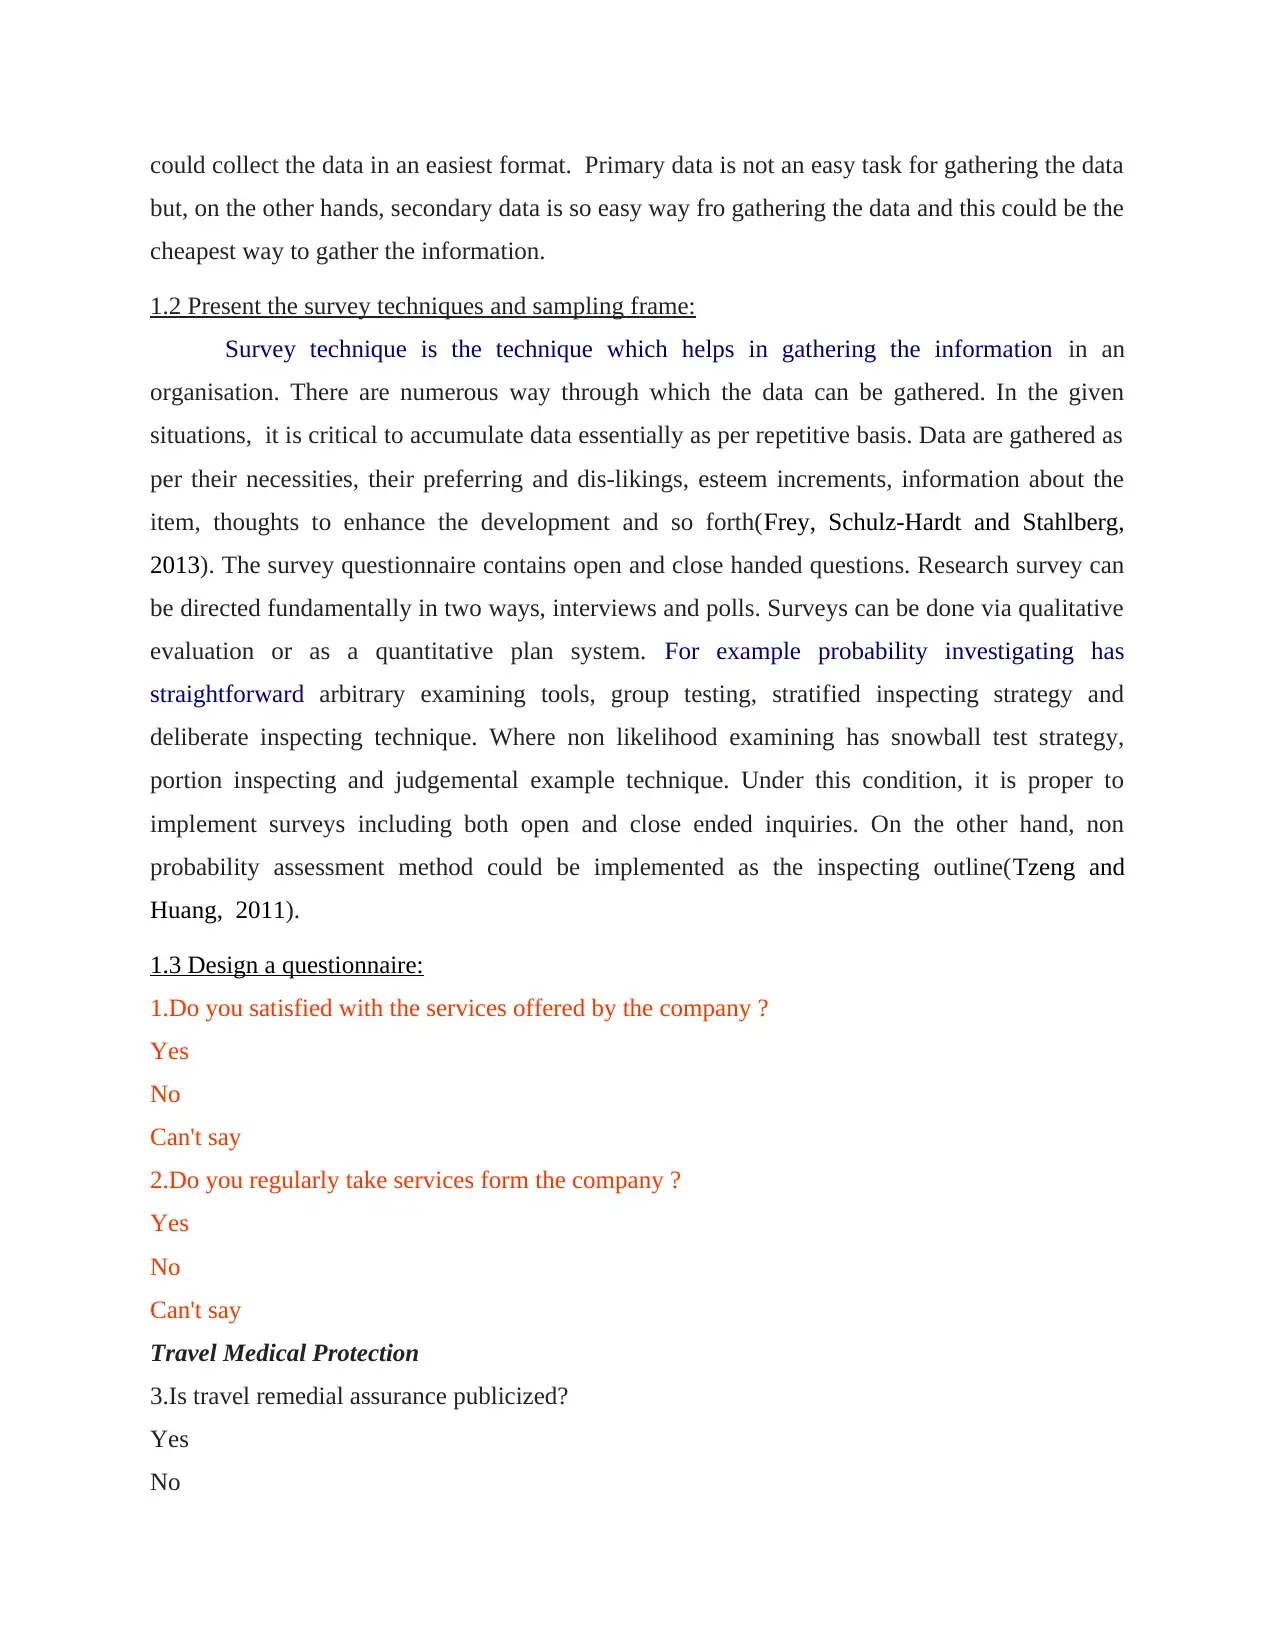
1.2 Present the survey techniques and sampling frame:
Survey technique is the technique which helps in gathering the information in an
organisation. There are numerous way through which the data can be gathered. In the given
situations, it is critical to accumulate data essentially as per repetitive basis. Data are gathered as
per their necessities, their preferring and dis-likings, esteem increments, information about the
item, thoughts to enhance the development and so forth(Frey, Schulz-Hardt and Stahlberg,
2013). The survey questionnaire contains open and close handed questions. Research survey can
be directed fundamentally in two ways, interviews and polls. Surveys can be done via qualitative
evaluation or as a quantitative plan system. For example probability investigating has
straightforward arbitrary examining tools, group testing, stratified inspecting strategy and
deliberate inspecting technique. Where non likelihood examining has snowball test strategy,
portion inspecting and judgemental example technique. Under this condition, it is proper to
implement surveys including both open and close ended inquiries. On the other hand, non
probability assessment method could be implemented as the inspecting outline(Tzeng and
Huang, 2011).
1.3 Design a questionnaire:
1.Do you satisfied with the services offered by the company ?
Yes
No
Can't say
2.Do you regularly take services form the company ?
Yes
No
Can't say
Travel Medical Protection
3.Is travel remedial assurance publicized?
Yes
No
but, on the other hands, secondary data is so easy way fro gathering the data and this could be the
cheapest way to gather the information.
1.2 Present the survey techniques and sampling frame:
Survey technique is the technique which helps in gathering the information in an
organisation. There are numerous way through which the data can be gathered. In the given
situations, it is critical to accumulate data essentially as per repetitive basis. Data are gathered as
per their necessities, their preferring and dis-likings, esteem increments, information about the
item, thoughts to enhance the development and so forth(Frey, Schulz-Hardt and Stahlberg,
2013). The survey questionnaire contains open and close handed questions. Research survey can
be directed fundamentally in two ways, interviews and polls. Surveys can be done via qualitative
evaluation or as a quantitative plan system. For example probability investigating has
straightforward arbitrary examining tools, group testing, stratified inspecting strategy and
deliberate inspecting technique. Where non likelihood examining has snowball test strategy,
portion inspecting and judgemental example technique. Under this condition, it is proper to
implement surveys including both open and close ended inquiries. On the other hand, non
probability assessment method could be implemented as the inspecting outline(Tzeng and
Huang, 2011).
1.3 Design a questionnaire:
1.Do you satisfied with the services offered by the company ?
Yes
No
Can't say
2.Do you regularly take services form the company ?
Yes
No
Can't say
Travel Medical Protection
3.Is travel remedial assurance publicized?
Yes
No
Paraphrase This Document
Need a fresh take? Get an instant paraphrase of this document with our AI Paraphraser
4.Is it mandatory?
Yes
No
Strategy for Transportation Describe entirety:
5.What commitment purposes of restriction are given by transport lines in:
US ______
UK _________
Somewhere else _______
Peril Administration
6.How often have affirmation of insurance from your suppliers?
Directly
Indirectly
7.Do you have procedures for crisis organization and emergency medicinal guide?
Yes
No
8. Do you allow use of alcohol?
Yes
No
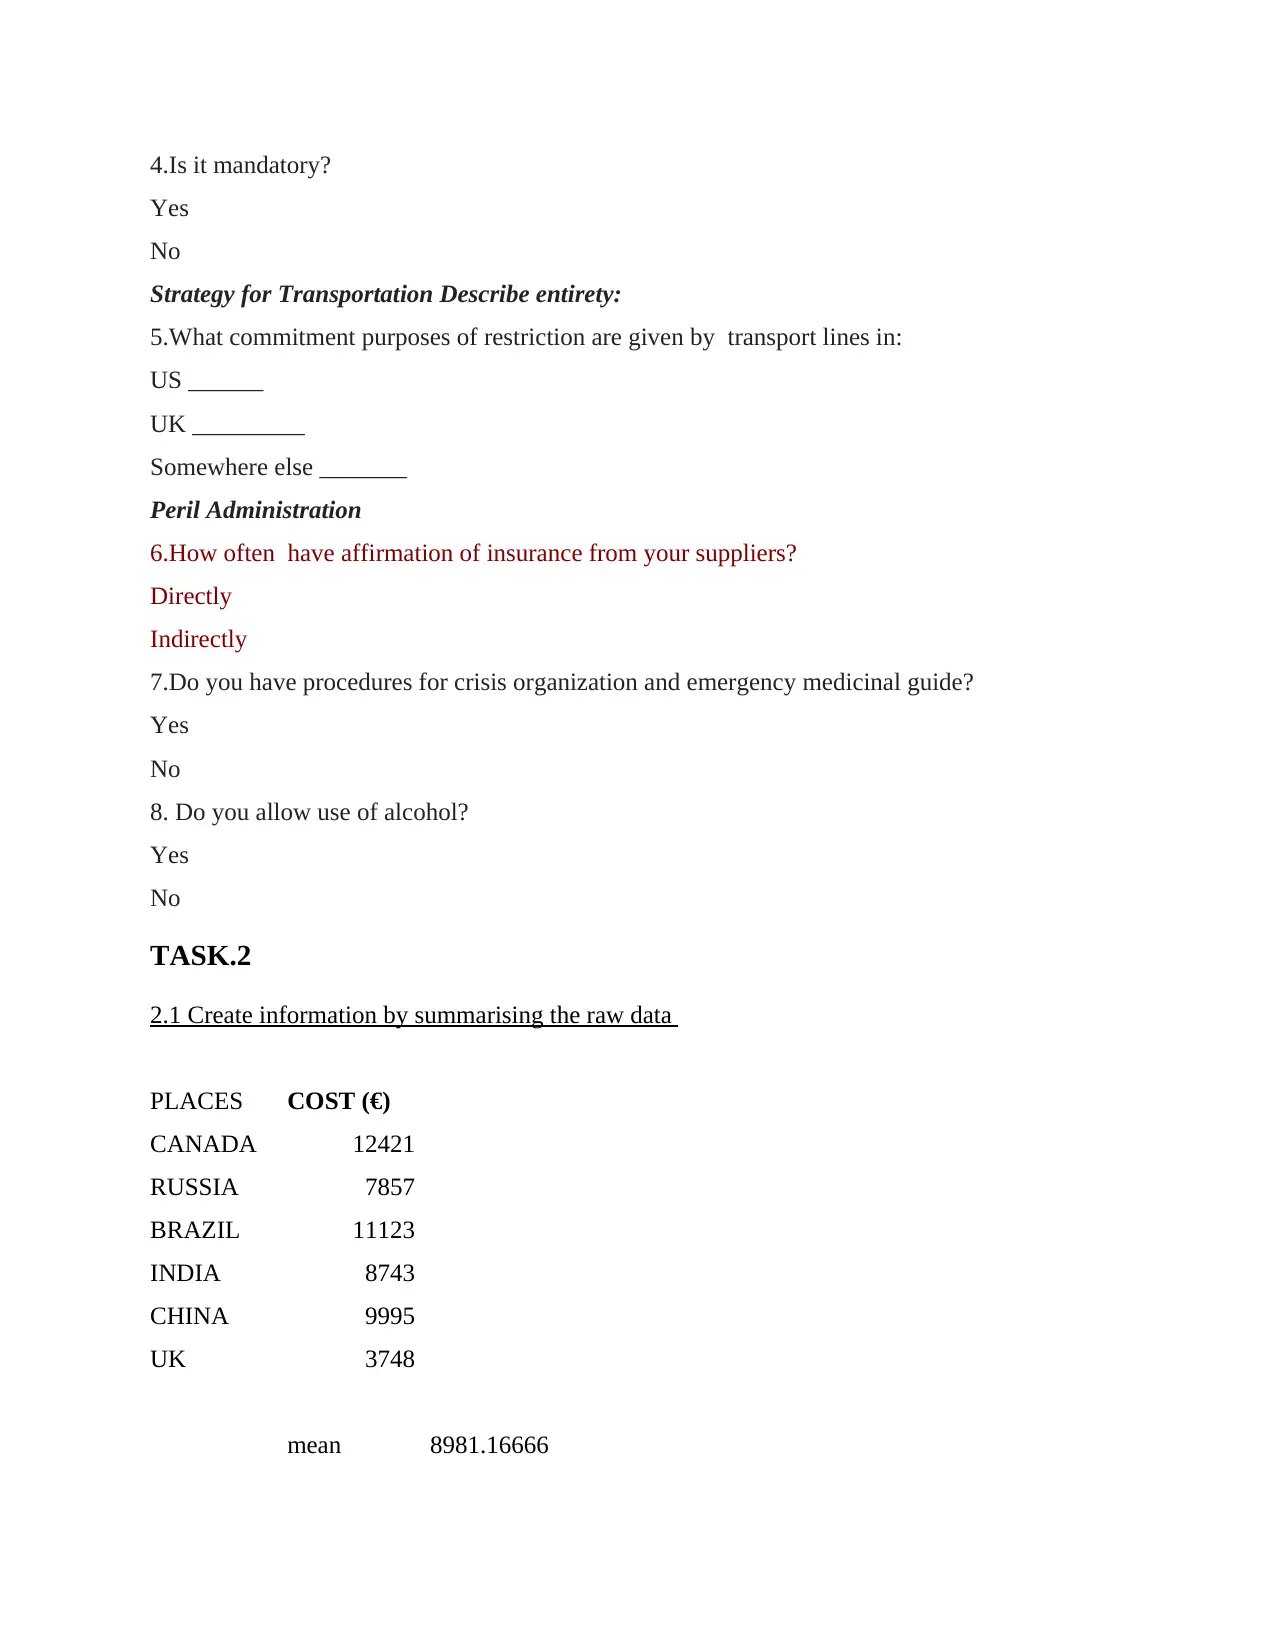
TASK.2
2.1 Create information by summarising the raw data
PLACES COST (€)
CANADA 12421
RUSSIA 7857
BRAZIL 11123
INDIA 8743
CHINA 9995
UK 3748
mean 8981.16666
Yes
No
Strategy for Transportation Describe entirety:
5.What commitment purposes of restriction are given by transport lines in:
US ______
UK _________
Somewhere else _______
Peril Administration
6.How often have affirmation of insurance from your suppliers?
Directly
Indirectly
7.Do you have procedures for crisis organization and emergency medicinal guide?
Yes
No
8. Do you allow use of alcohol?
Yes
No
TASK.2
2.1 Create information by summarising the raw data
PLACES COST (€)
CANADA 12421
RUSSIA 7857
BRAZIL 11123
INDIA 8743
CHINA 9995
UK 3748
mean 8981.16666
66667
median 9369
mode 1177
In
lower range 3748
upper range 12421
standard deviation
3038.23201
33042
Inter-quartile range 4617.75
Q1 6829.75
Q2 9369
Q3 11447.5
25th percentile 8078.5
50th percentile 9369
75th percentile 10841
100th percentile 12421
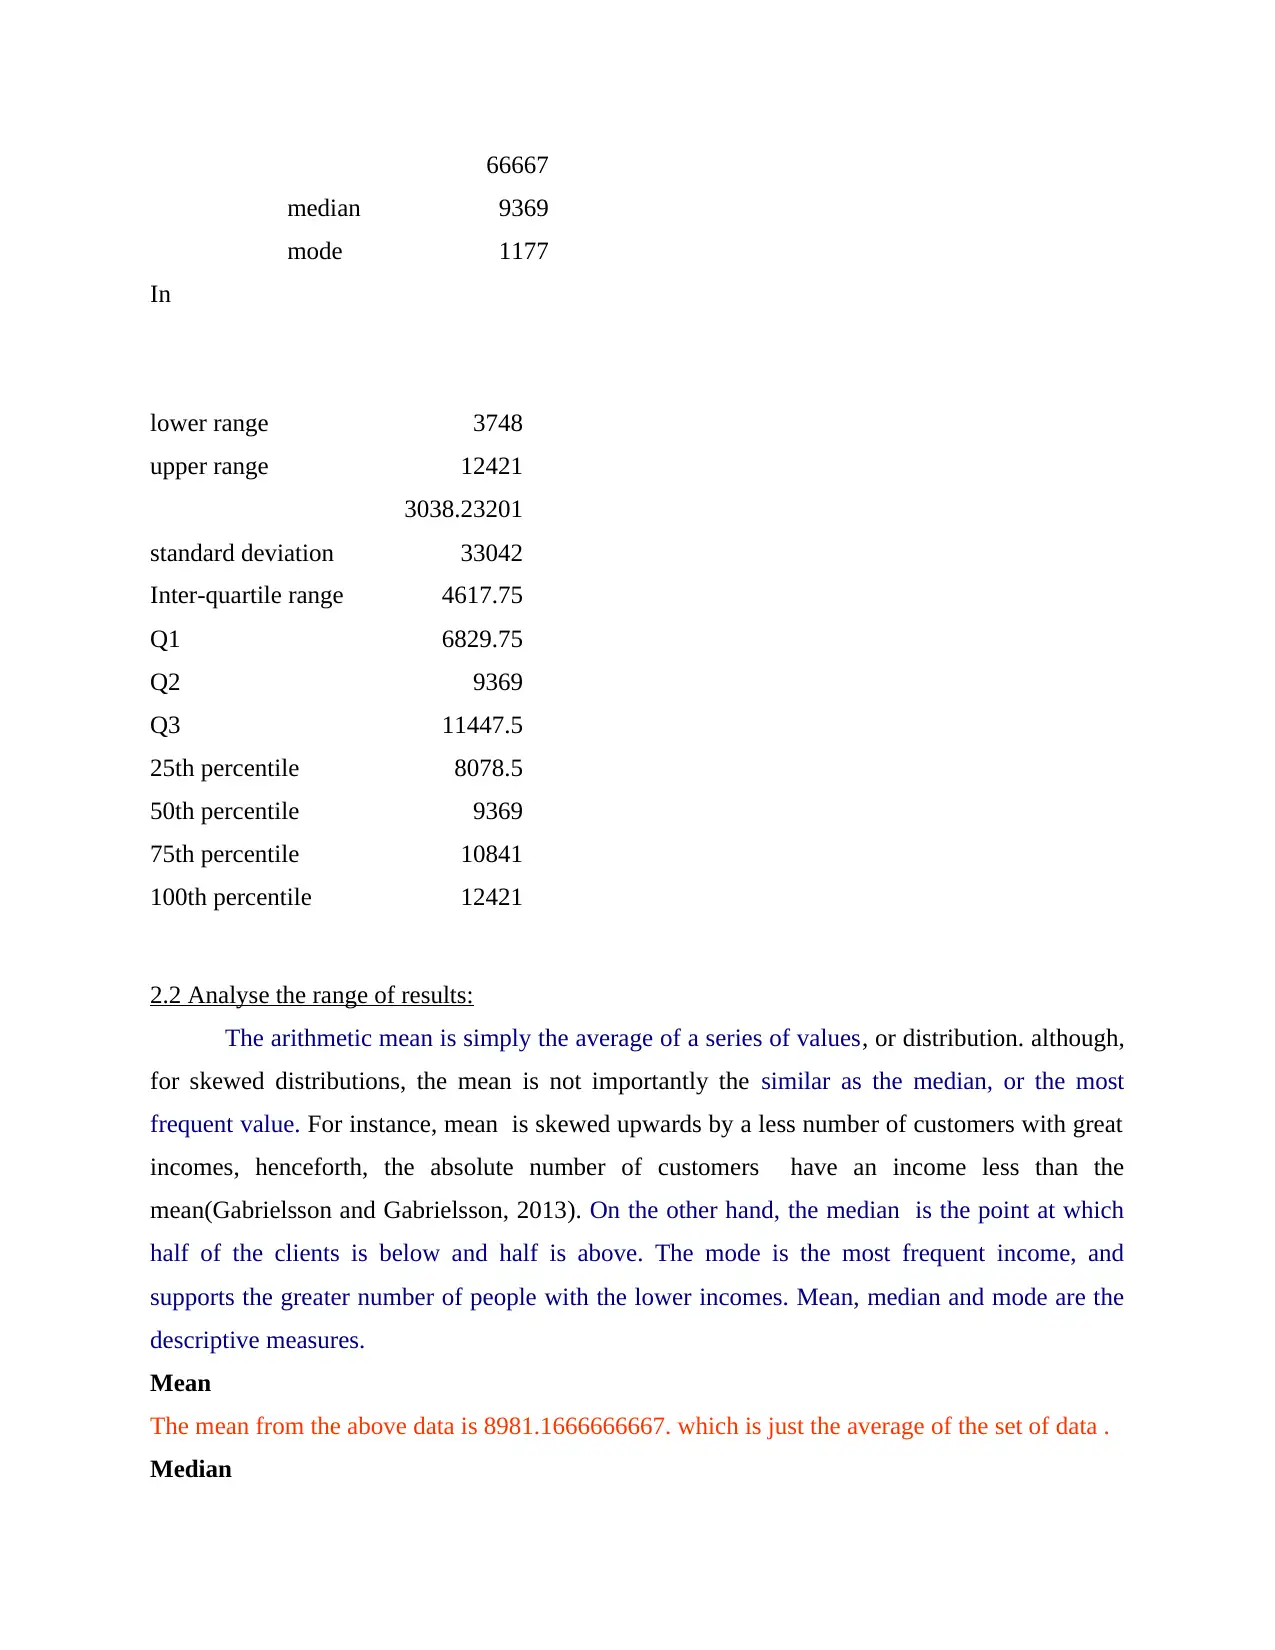
2.2 Analyse the range of results:
The arithmetic mean is simply the average of a series of values, or distribution. although,
for skewed distributions, the mean is not importantly the similar as the median, or the most
frequent value. For instance, mean is skewed upwards by a less number of customers with great
incomes, henceforth, the absolute number of customers have an income less than the
mean(Gabrielsson and Gabrielsson, 2013). On the other hand, the median is the point at which
half of the clients is below and half is above. The mode is the most frequent income, and
supports the greater number of people with the lower incomes. Mean, median and mode are the
descriptive measures.
Mean
The mean from the above data is 8981.1666666667. which is just the average of the set of data .
Median
median 9369
mode 1177
In
lower range 3748
upper range 12421
standard deviation
3038.23201
33042
Inter-quartile range 4617.75
Q1 6829.75
Q2 9369
Q3 11447.5
25th percentile 8078.5
50th percentile 9369
75th percentile 10841
100th percentile 12421
2.2 Analyse the range of results:
The arithmetic mean is simply the average of a series of values, or distribution. although,
for skewed distributions, the mean is not importantly the similar as the median, or the most
frequent value. For instance, mean is skewed upwards by a less number of customers with great
incomes, henceforth, the absolute number of customers have an income less than the
mean(Gabrielsson and Gabrielsson, 2013). On the other hand, the median is the point at which
half of the clients is below and half is above. The mode is the most frequent income, and
supports the greater number of people with the lower incomes. Mean, median and mode are the
descriptive measures.
Mean
The mean from the above data is 8981.1666666667. which is just the average of the set of data .
Median
⊘ This is a preview!⊘
Do you want full access?
Subscribe today to unlock all pages.
Trusted by 1+ million students worldwide
Median is calculated via :
lower mid value+ total number of customers/2-lower cumulative frequency* gap in interval
Total number of customers
Here, the median value is calculated as 9369.
Mode
The mode time taken to find out the value which seems to be appear the most often in
the data.
The values which is frequently occurred are assumed to be mode.
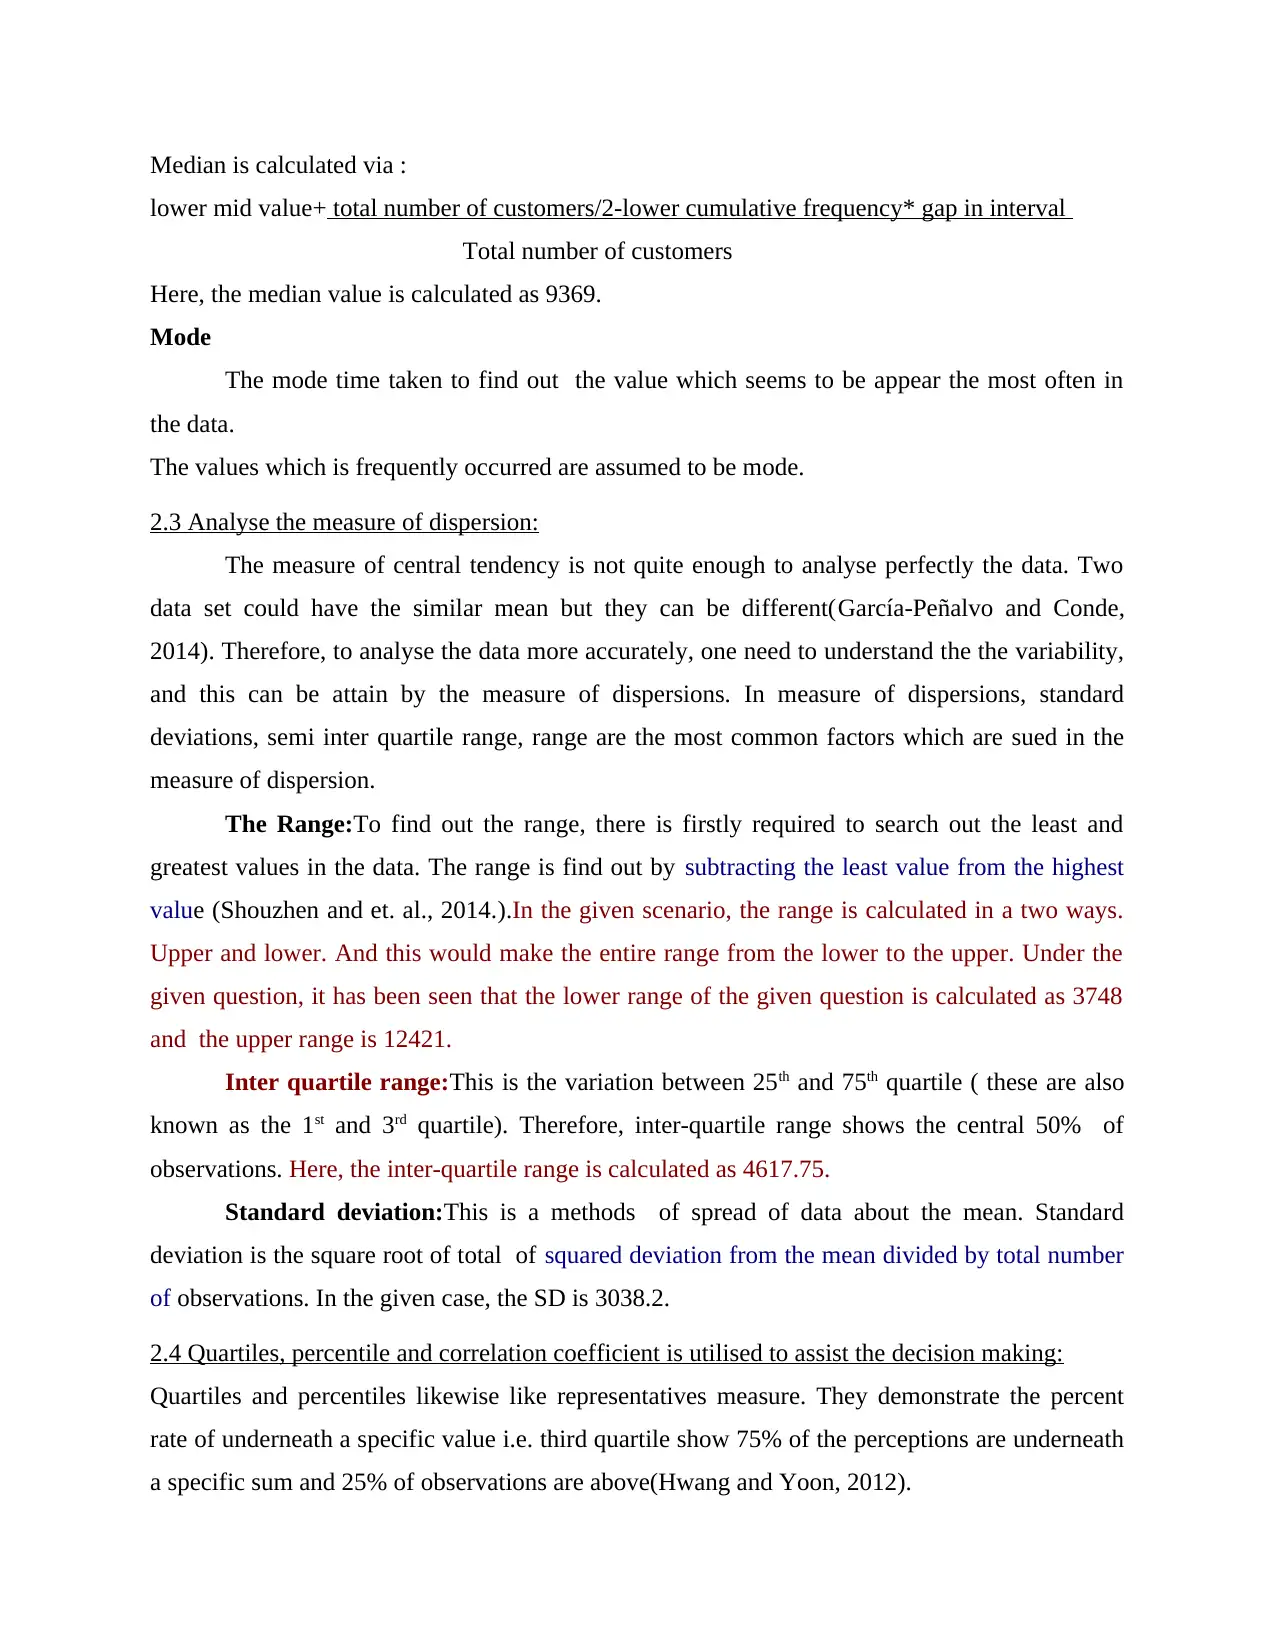
2.3 Analyse the measure of dispersion:
The measure of central tendency is not quite enough to analyse perfectly the data. Two
data set could have the similar mean but they can be different(García-Peñalvo and Conde,
2014). Therefore, to analyse the data more accurately, one need to understand the the variability,
and this can be attain by the measure of dispersions. In measure of dispersions, standard
deviations, semi inter quartile range, range are the most common factors which are sued in the
measure of dispersion.
The Range:To find out the range, there is firstly required to search out the least and
greatest values in the data. The range is find out by subtracting the least value from the highest
value (Shouzhen and et. al., 2014.).In the given scenario, the range is calculated in a two ways.
Upper and lower. And this would make the entire range from the lower to the upper. Under the
given question, it has been seen that the lower range of the given question is calculated as 3748
and the upper range is 12421.
Inter quartile range:This is the variation between 25th and 75th quartile ( these are also
known as the 1st and 3rd quartile). Therefore, inter-quartile range shows the central 50% of
observations. Here, the inter-quartile range is calculated as 4617.75.
Standard deviation:This is a methods of spread of data about the mean. Standard
deviation is the square root of total of squared deviation from the mean divided by total number
of observations. In the given case, the SD is 3038.2.
2.4 Quartiles, percentile and correlation coefficient is utilised to assist the decision making:
Quartiles and percentiles likewise like representatives measure. They demonstrate the percent
rate of underneath a specific value i.e. third quartile show 75% of the perceptions are underneath
a specific sum and 25% of observations are above(Hwang and Yoon, 2012).
lower mid value+ total number of customers/2-lower cumulative frequency* gap in interval
Total number of customers
Here, the median value is calculated as 9369.
Mode
The mode time taken to find out the value which seems to be appear the most often in
the data.
The values which is frequently occurred are assumed to be mode.
2.3 Analyse the measure of dispersion:
The measure of central tendency is not quite enough to analyse perfectly the data. Two
data set could have the similar mean but they can be different(García-Peñalvo and Conde,
2014). Therefore, to analyse the data more accurately, one need to understand the the variability,
and this can be attain by the measure of dispersions. In measure of dispersions, standard
deviations, semi inter quartile range, range are the most common factors which are sued in the
measure of dispersion.
The Range:To find out the range, there is firstly required to search out the least and
greatest values in the data. The range is find out by subtracting the least value from the highest
value (Shouzhen and et. al., 2014.).In the given scenario, the range is calculated in a two ways.
Upper and lower. And this would make the entire range from the lower to the upper. Under the
given question, it has been seen that the lower range of the given question is calculated as 3748
and the upper range is 12421.
Inter quartile range:This is the variation between 25th and 75th quartile ( these are also
known as the 1st and 3rd quartile). Therefore, inter-quartile range shows the central 50% of
observations. Here, the inter-quartile range is calculated as 4617.75.
Standard deviation:This is a methods of spread of data about the mean. Standard
deviation is the square root of total of squared deviation from the mean divided by total number
of observations. In the given case, the SD is 3038.2.
2.4 Quartiles, percentile and correlation coefficient is utilised to assist the decision making:
Quartiles and percentiles likewise like representatives measure. They demonstrate the percent
rate of underneath a specific value i.e. third quartile show 75% of the perceptions are underneath
a specific sum and 25% of observations are above(Hwang and Yoon, 2012).
Paraphrase This Document
Need a fresh take? Get an instant paraphrase of this document with our AI Paraphraser
Quartiles and percentile estimations of the garage
Quartiles-1 6829.75
Quartiles-2 9369
Quartile- 3 11447.5
Percentile-25% 8078.5
Percentiles-75% 15
Percentile-half 14.5
Percentile-100% 12421
Coefficient of correlation measures the quality of the linear connection between two
factors. It is indicated by "r". Estimation of "r" dependably lie between - 1 and +1. In the event
that "r" is more like +1, two factors have solid positive relationship. Connection and coefficient
likewise settles on business decisions.
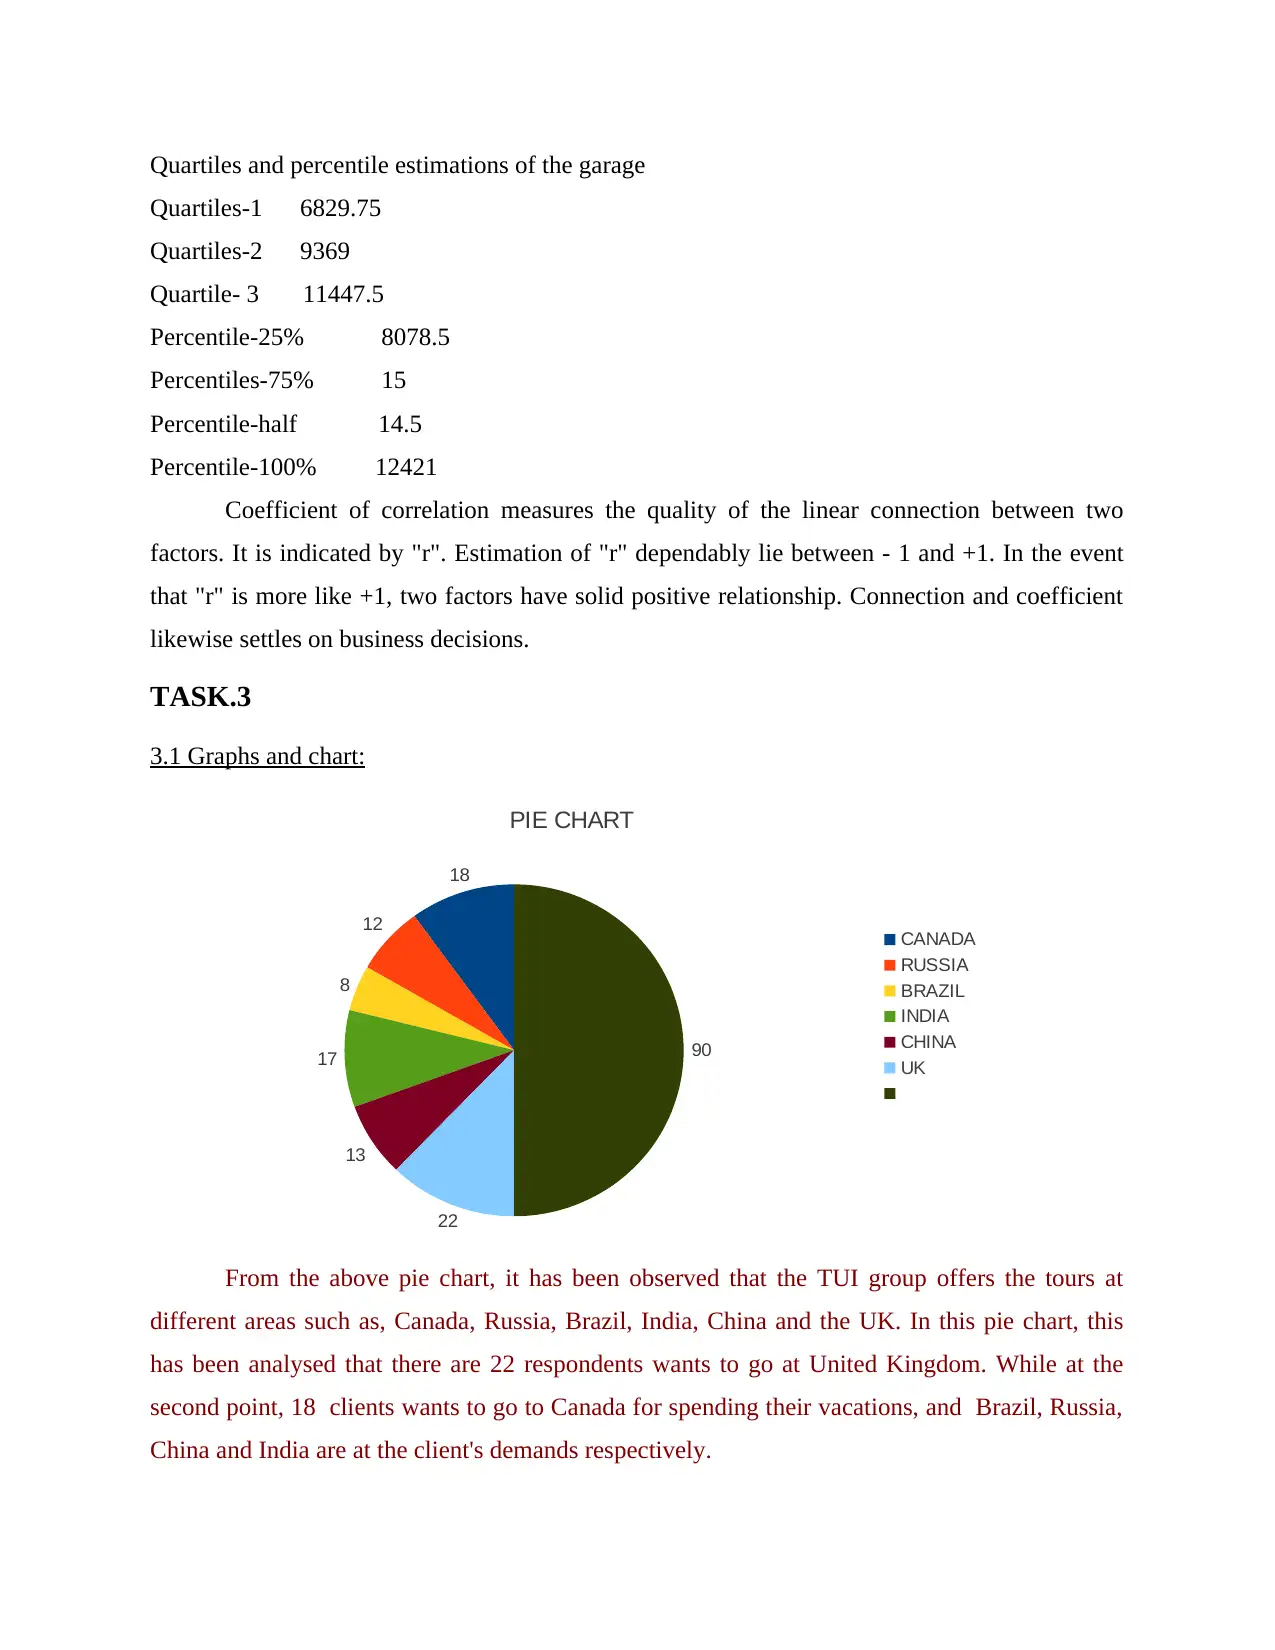
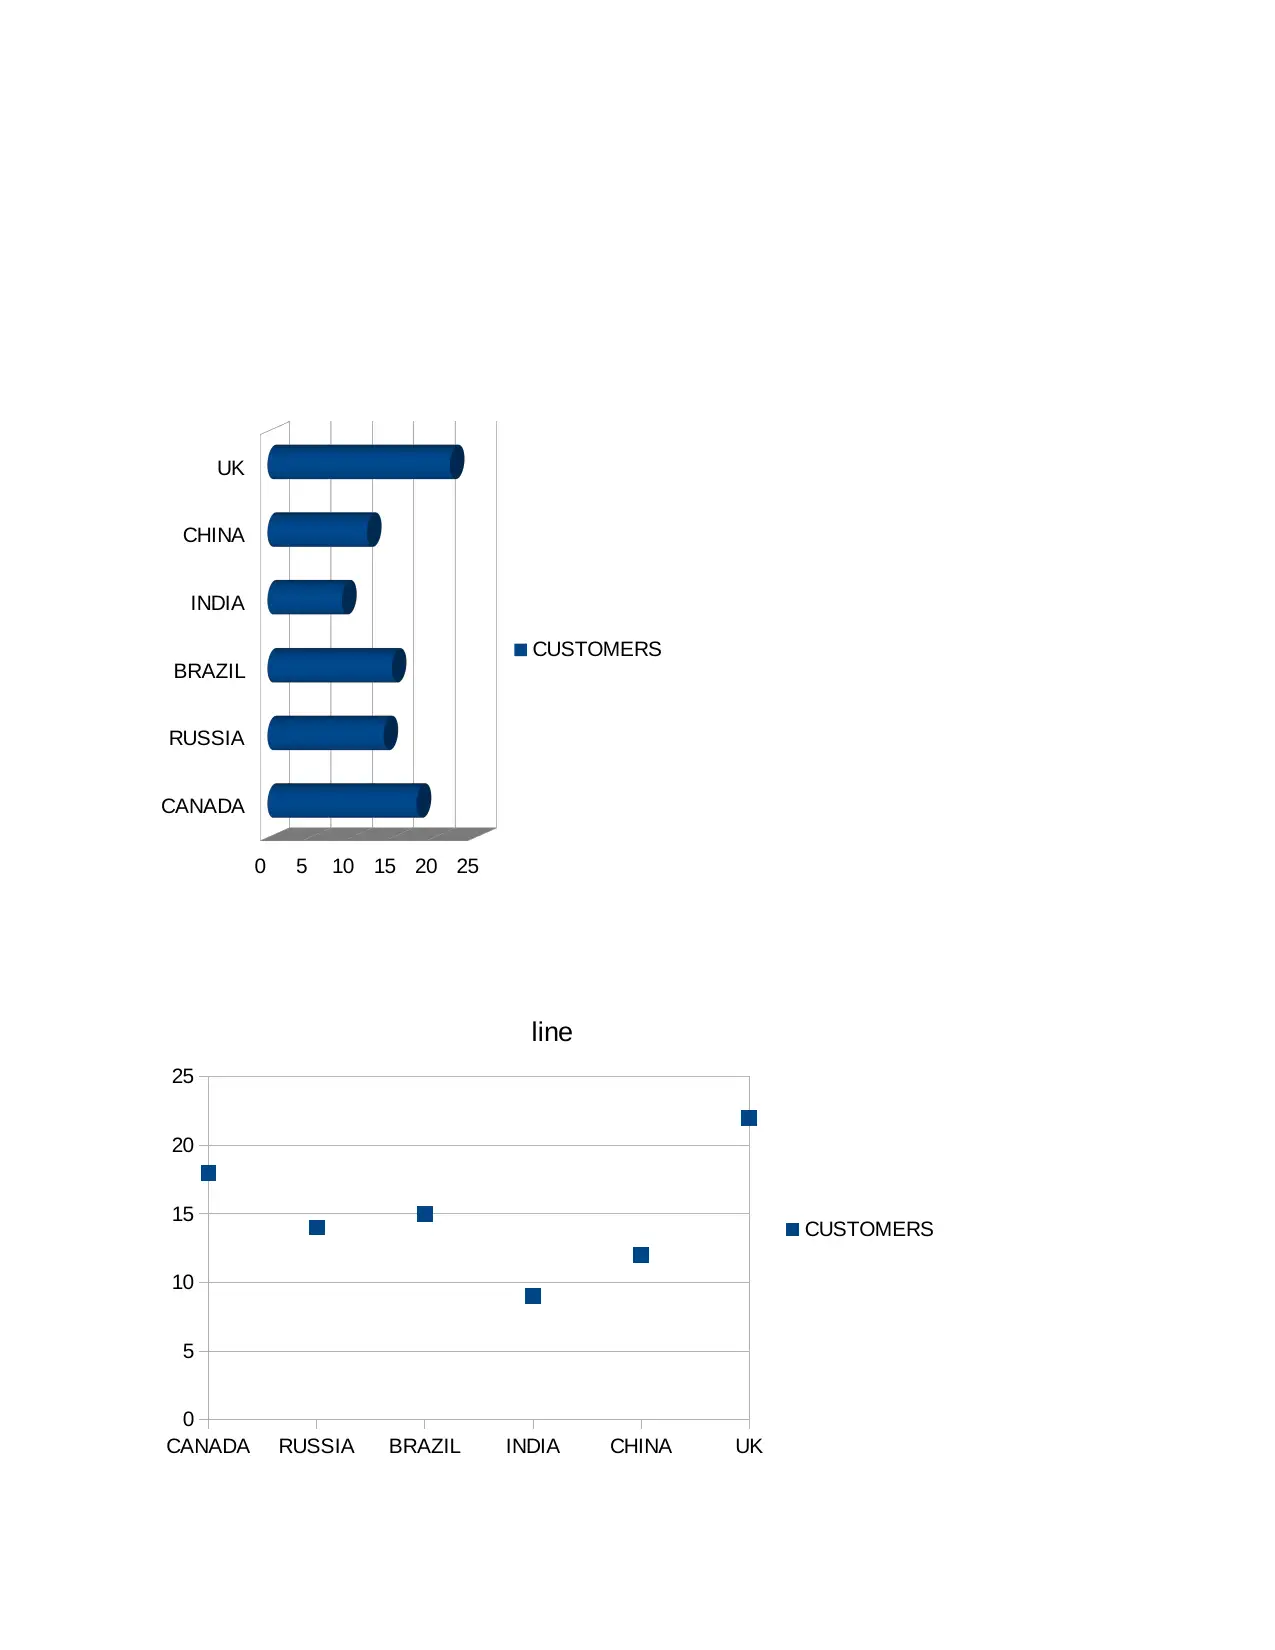
TASK.3
3.1 Graphs and chart:
18
12
8
17
13
22
90
PIE CHART
CANADA
RUSSIA
BRAZIL
INDIA
CHINA
UK
From the above pie chart, it has been observed that the TUI group offers the tours at
different areas such as, Canada, Russia, Brazil, India, China and the UK. In this pie chart, this
has been analysed that there are 22 respondents wants to go at United Kingdom. While at the
second point, 18 clients wants to go to Canada for spending their vacations, and Brazil, Russia,
China and India are at the client's demands respectively.
Quartiles-1 6829.75
Quartiles-2 9369
Quartile- 3 11447.5
Percentile-25% 8078.5
Percentiles-75% 15
Percentile-half 14.5
Percentile-100% 12421
Coefficient of correlation measures the quality of the linear connection between two
factors. It is indicated by "r". Estimation of "r" dependably lie between - 1 and +1. In the event
that "r" is more like +1, two factors have solid positive relationship. Connection and coefficient
likewise settles on business decisions.
TASK.3
3.1 Graphs and chart:
18
12
8
17
13
22
90
PIE CHART
CANADA
RUSSIA
BRAZIL
INDIA
CHINA
UK
From the above pie chart, it has been observed that the TUI group offers the tours at
different areas such as, Canada, Russia, Brazil, India, China and the UK. In this pie chart, this
has been analysed that there are 22 respondents wants to go at United Kingdom. While at the
second point, 18 clients wants to go to Canada for spending their vacations, and Brazil, Russia,
China and India are at the client's demands respectively.
CANADA
RUSSIA
BRAZIL
INDIA
CHINA
UK
0 5 10 15 20 25
CUSTOMERS
CANADA RUSSIA BRAZIL INDIA CHINA UK
0
5
10
15
20
25
line
CUSTOMERS
RUSSIA
BRAZIL
INDIA
CHINA
UK
0 5 10 15 20 25
CUSTOMERS
CANADA RUSSIA BRAZIL INDIA CHINA UK
0
5
10
15
20
25
line
CUSTOMERS
⊘ This is a preview!⊘
Do you want full access?
Subscribe today to unlock all pages.
Trusted by 1+ million students worldwide
3.2 Trend line of TUI group in 2017 and 2018 of sales:
1 2 3 4 5 6
0
50000
100000
150000
200000
250000
300000
350000
400000
Sales in € 2017
Sales in €2018
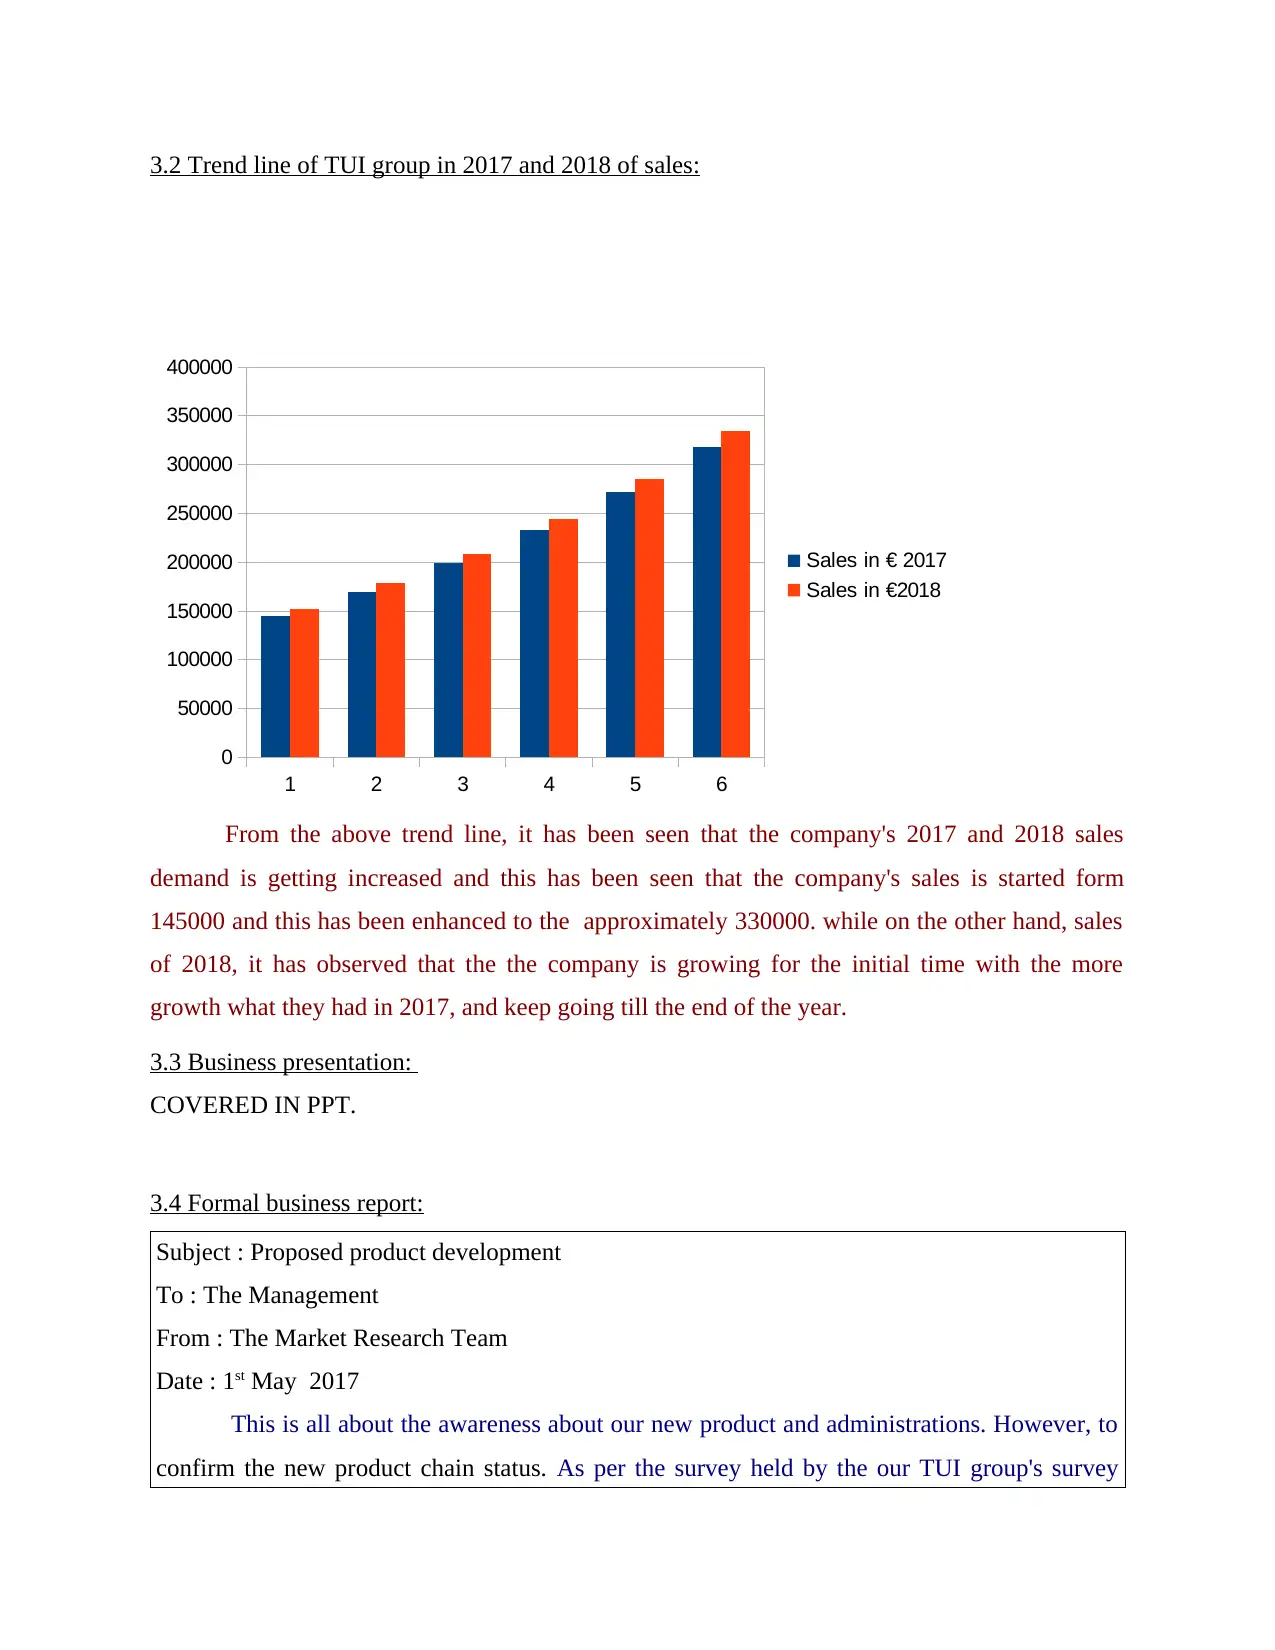
From the above trend line, it has been seen that the company's 2017 and 2018 sales
demand is getting increased and this has been seen that the company's sales is started form
145000 and this has been enhanced to the approximately 330000. while on the other hand, sales
of 2018, it has observed that the the company is growing for the initial time with the more
growth what they had in 2017, and keep going till the end of the year.
3.3 Business presentation:
COVERED IN PPT.
3.4 Formal business report:
Subject : Proposed product development
To : The Management
From : The Market Research Team
Date : 1st May 2017
This is all about the awareness about our new product and administrations. However, to
confirm the new product chain status. As per the survey held by the our TUI group's survey
1 2 3 4 5 6
0
50000
100000
150000
200000
250000
300000
350000
400000
Sales in € 2017
Sales in €2018
From the above trend line, it has been seen that the company's 2017 and 2018 sales
demand is getting increased and this has been seen that the company's sales is started form
145000 and this has been enhanced to the approximately 330000. while on the other hand, sales
of 2018, it has observed that the the company is growing for the initial time with the more
growth what they had in 2017, and keep going till the end of the year.
3.3 Business presentation:
COVERED IN PPT.
3.4 Formal business report:
Subject : Proposed product development
To : The Management
From : The Market Research Team
Date : 1st May 2017
This is all about the awareness about our new product and administrations. However, to
confirm the new product chain status. As per the survey held by the our TUI group's survey
Paraphrase This Document
Need a fresh take? Get an instant paraphrase of this document with our AI Paraphraser
team in order to gather the required information. We have 90 respondents from clients. We
realize that the males are utilizing our services more significant than the females(Maxwell,
Jeffrey and Lévesque, 2011). The clients are glad to manage our foundation. 63 clients out of 90
knew about the new product which the TUI group is going to launch. About 75% of clients are
happy with our existing costs. As per the data, our quality teams and management are dedicated
to introduce the new products to the clients where the organization has constructed. Hence TUI
group have almost 90% of informal advancement through satisfied customers. As per the
availability of the data and information, the organisation is performs amazingly well than other
business competitors.
We prescribe that the after sales service ought to make improves. The vast majority of
the criticism has evaluated highly good, however the hierarchical objective ought to be to give
an excessively customized administration to get more rates on surpassing desire. The client
service manager is dependable to present client oriented training.
TASK.4
4.1 Appropriate information processing tools & making project plan and identification of critical
path:
Information dealing with systems are the methodology for collecting appropriate data for
at the season of presenting new items at a market place(Milovic and Milovic, 2012). Information
taking care of strategies are the change or changes in the open data to make them all the more
convincing for the use of enormous business which suggests get ready gadgets are the change of
data into reasonable information to make it supportive or related. It is a control of data as shown
by the information required for specific task or activities.
There are few data handling apparatuses are:-
Spreadsheets
Maps
Databases
Models
Inner and outside sources
The data handling method is utilized to restrict the mistake from all the accessible information so
as to achieve the correct results or to suspend future errors. The principle data handling devices
is to confine the mistake among whole available information so as to accomplish exact outcomes
or to overlook future blunders in the initiation of new item(Muindi, 2011). For the most part data
instruments go about as a change of information into data for the advancement of business by
giving real and right confirmations by social affair information from essential and optional
sources(Shepherd, 2011).
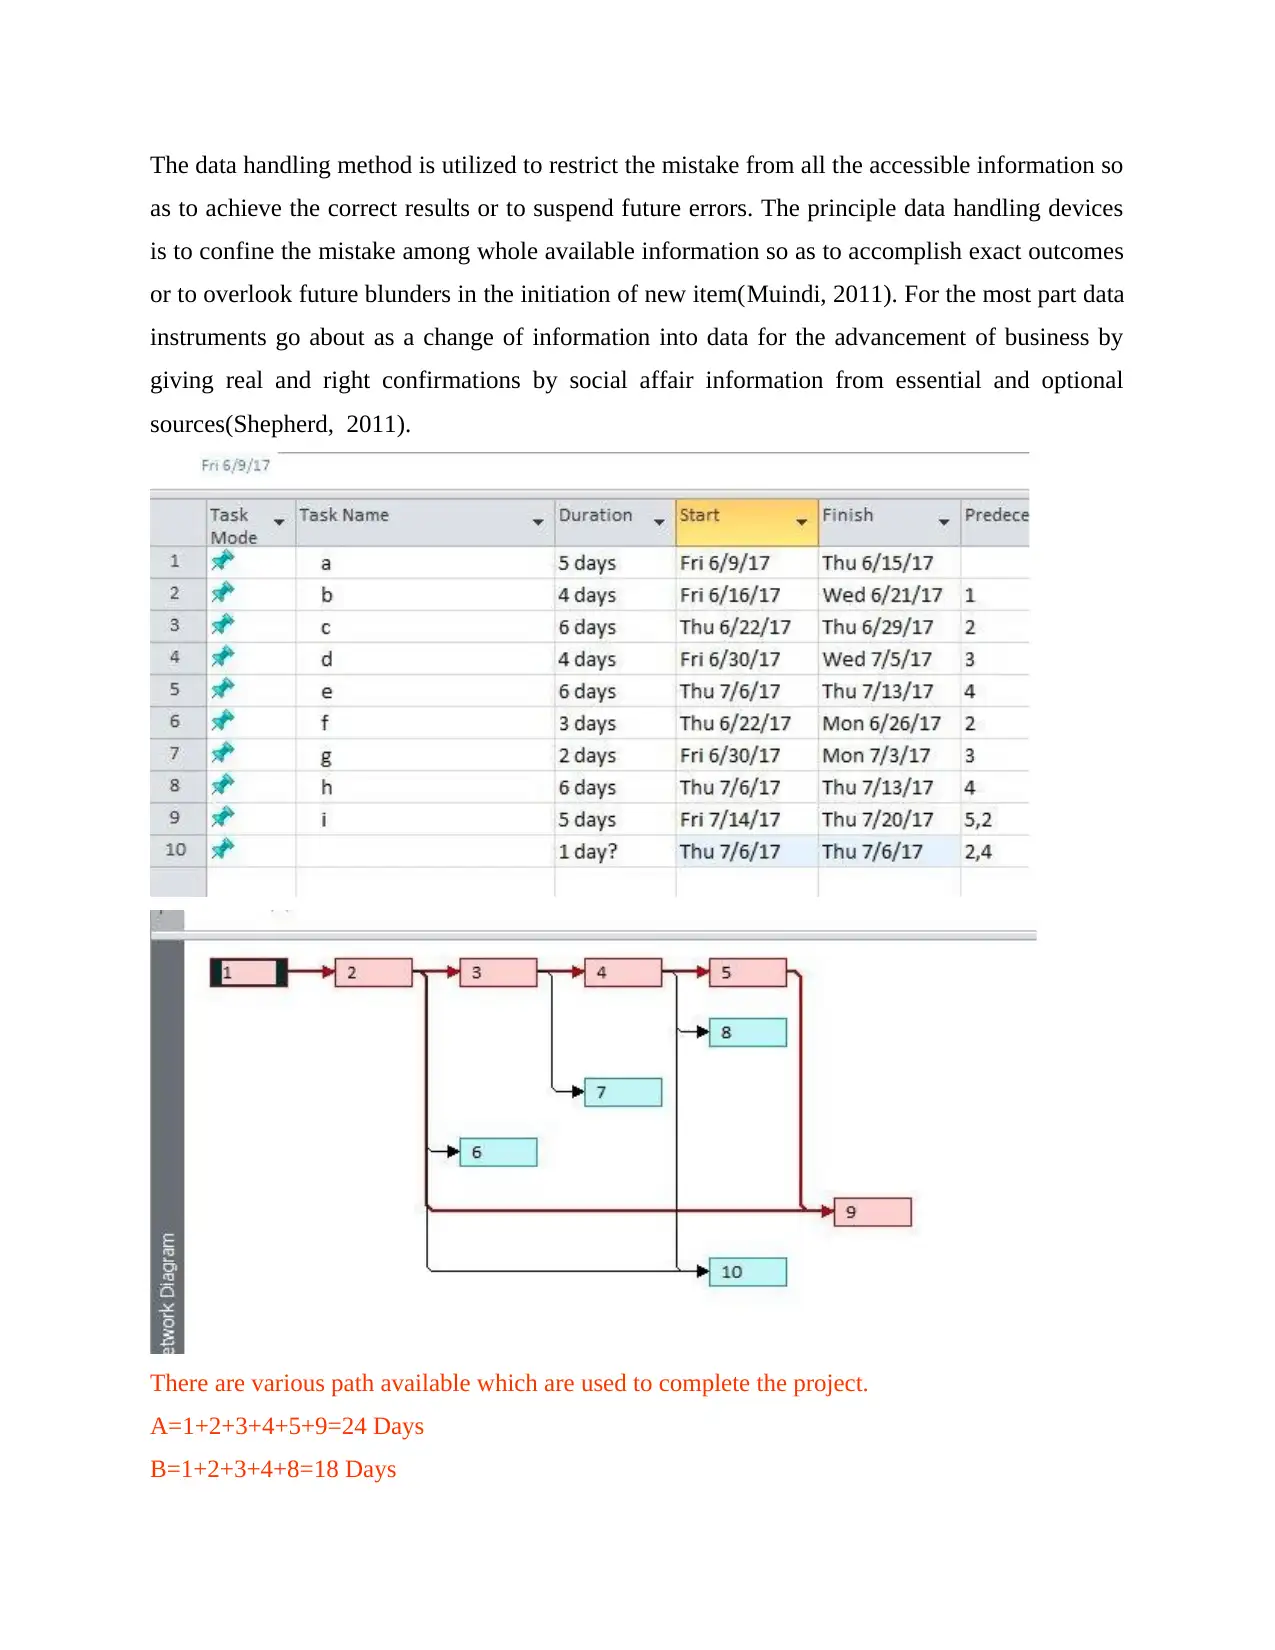
There are various path available which are used to complete the project.
A=1+2+3+4+5+9=24 Days
B=1+2+3+4+8=18 Days
as to achieve the correct results or to suspend future errors. The principle data handling devices
is to confine the mistake among whole available information so as to accomplish exact outcomes
or to overlook future blunders in the initiation of new item(Muindi, 2011). For the most part data
instruments go about as a change of information into data for the advancement of business by
giving real and right confirmations by social affair information from essential and optional
sources(Shepherd, 2011).
There are various path available which are used to complete the project.
A=1+2+3+4+5+9=24 Days
B=1+2+3+4+8=18 Days
⊘ This is a preview!⊘
Do you want full access?
Subscribe today to unlock all pages.
Trusted by 1+ million students worldwide
1 out of 16
Related Documents


Your All-in-One AI-Powered Toolkit for Academic Success.
+13062052269
info@desklib.com
Available 24*7 on WhatsApp / Email
![[object Object]](/_next/static/media/star-bottom.7253800d.svg)
Unlock your academic potential
Copyright © 2020–2026 A2Z Services. All Rights Reserved. Developed and managed by ZUCOL.