Business Decision Making Report: Restaurant Location Analysis, London

Verified

Added on  2023/03/16

|32
|3823
|32
Report
AI Summary
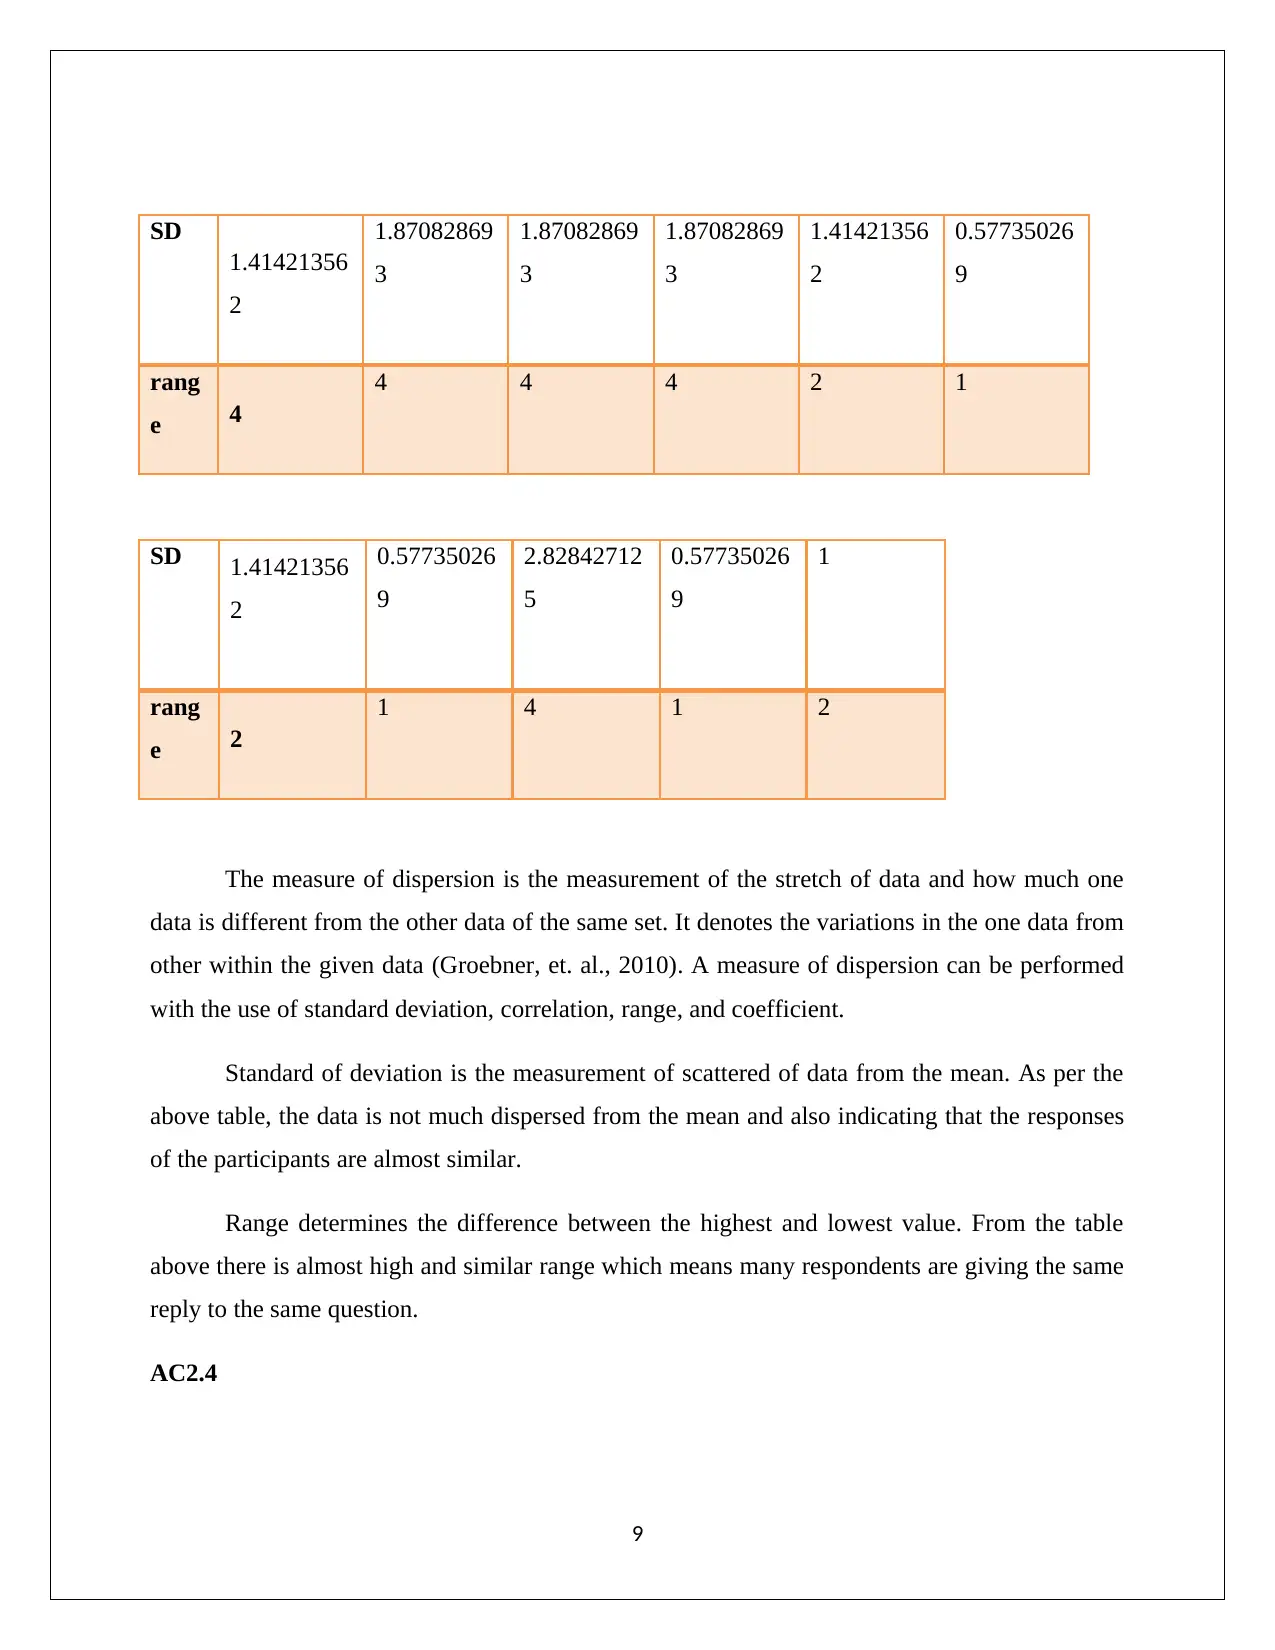
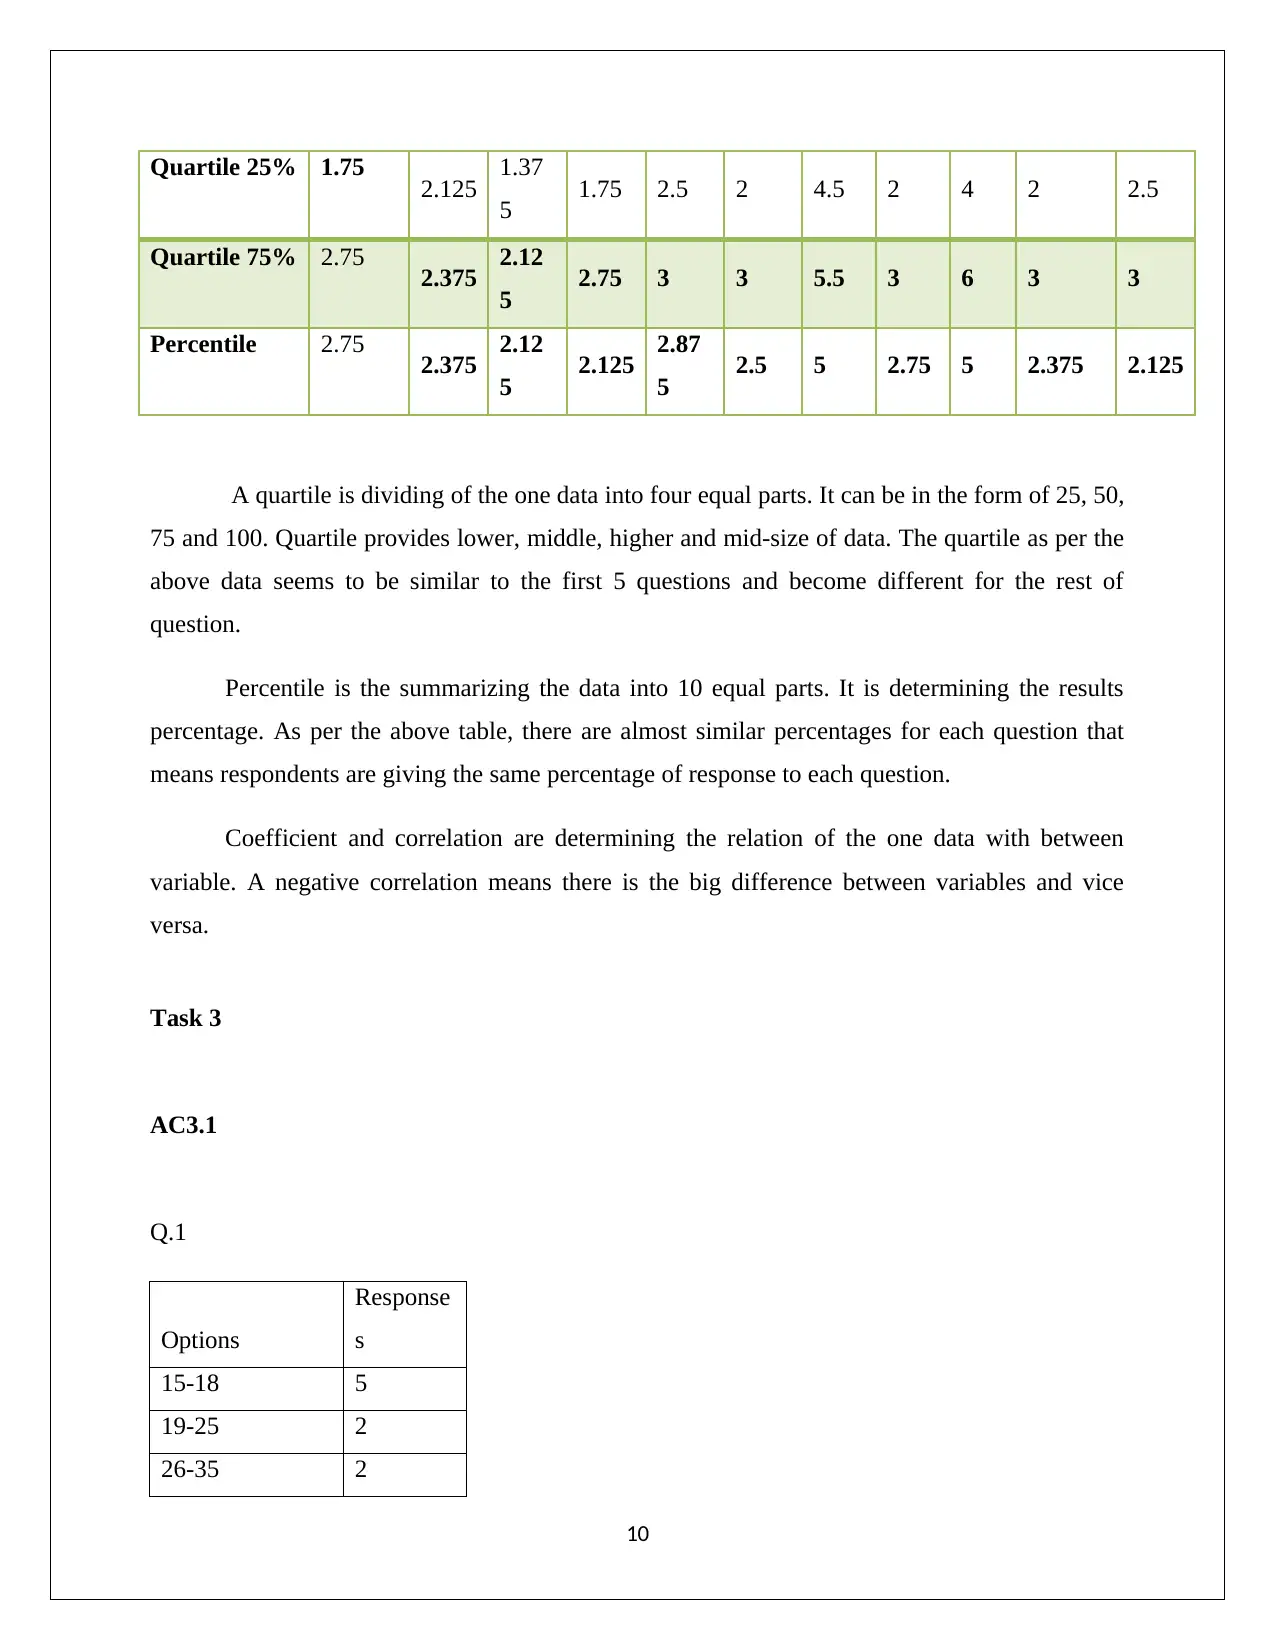
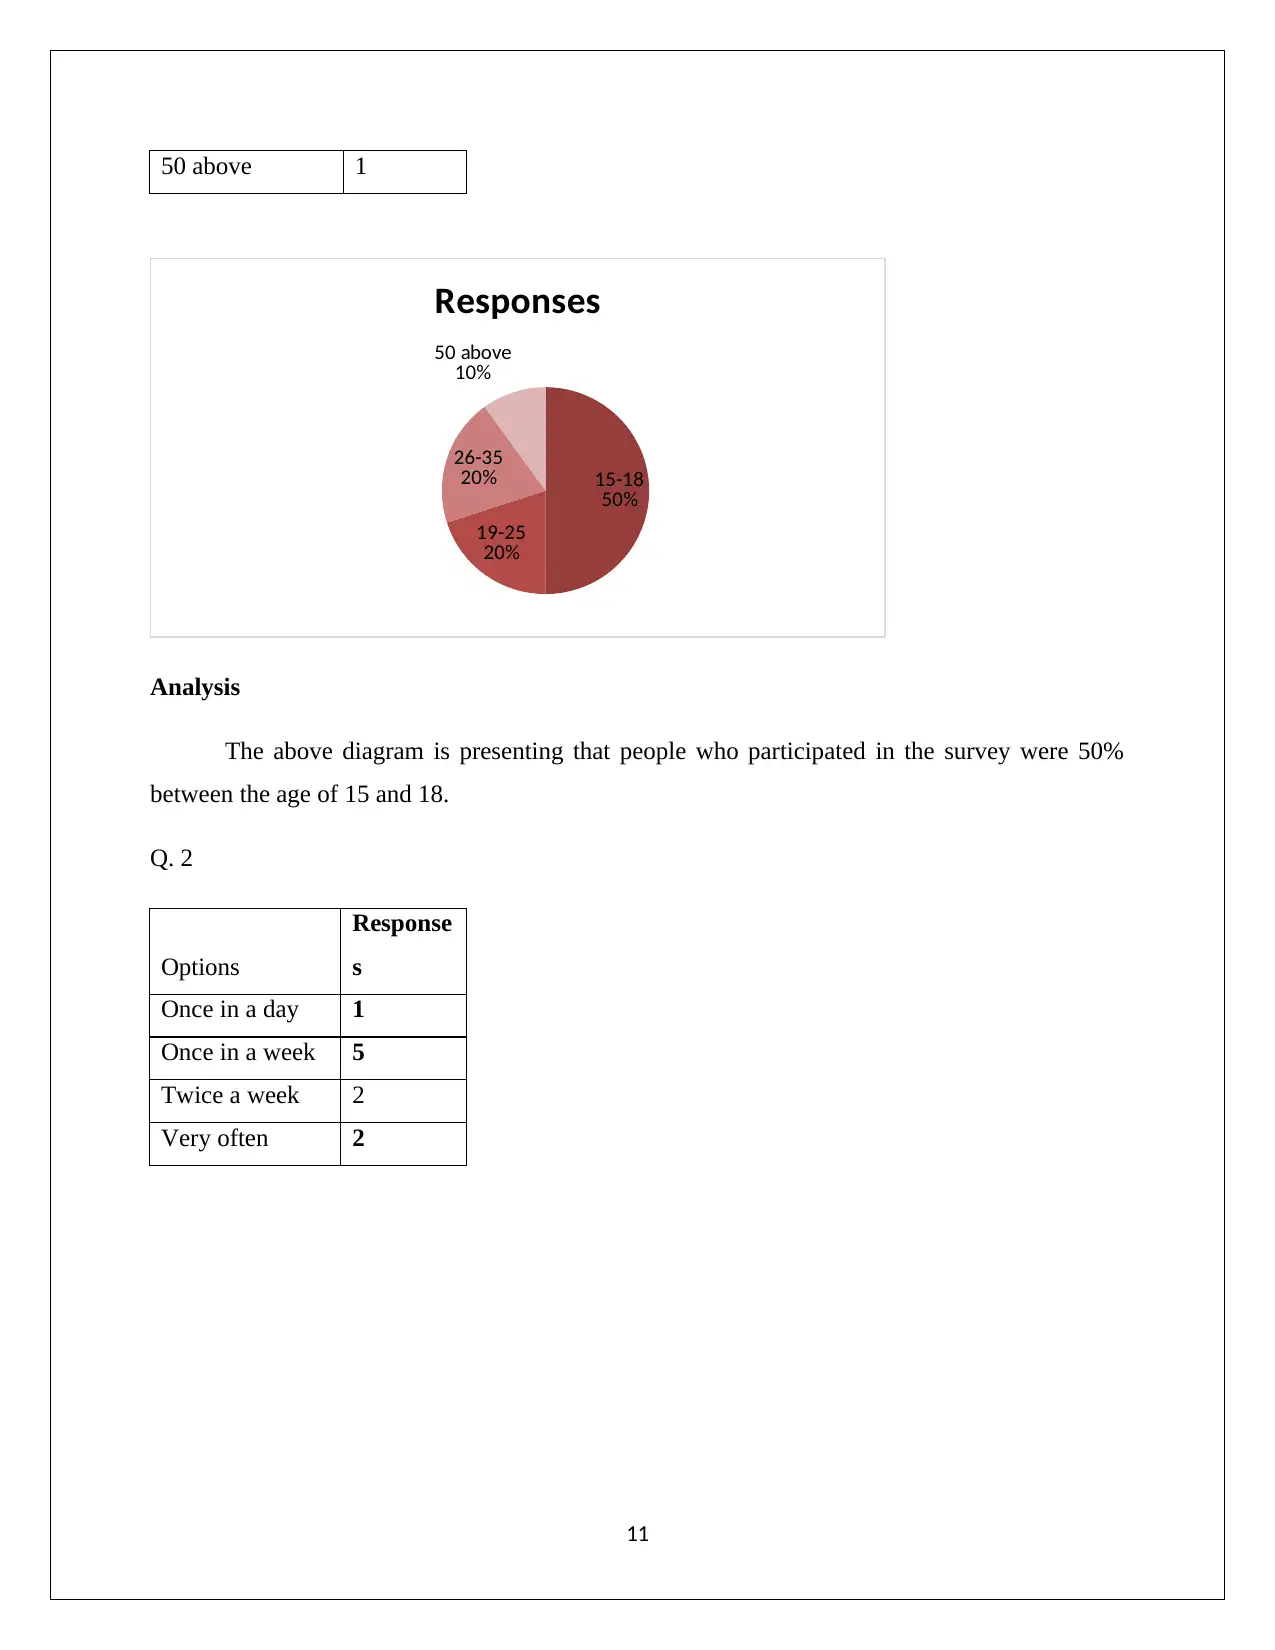
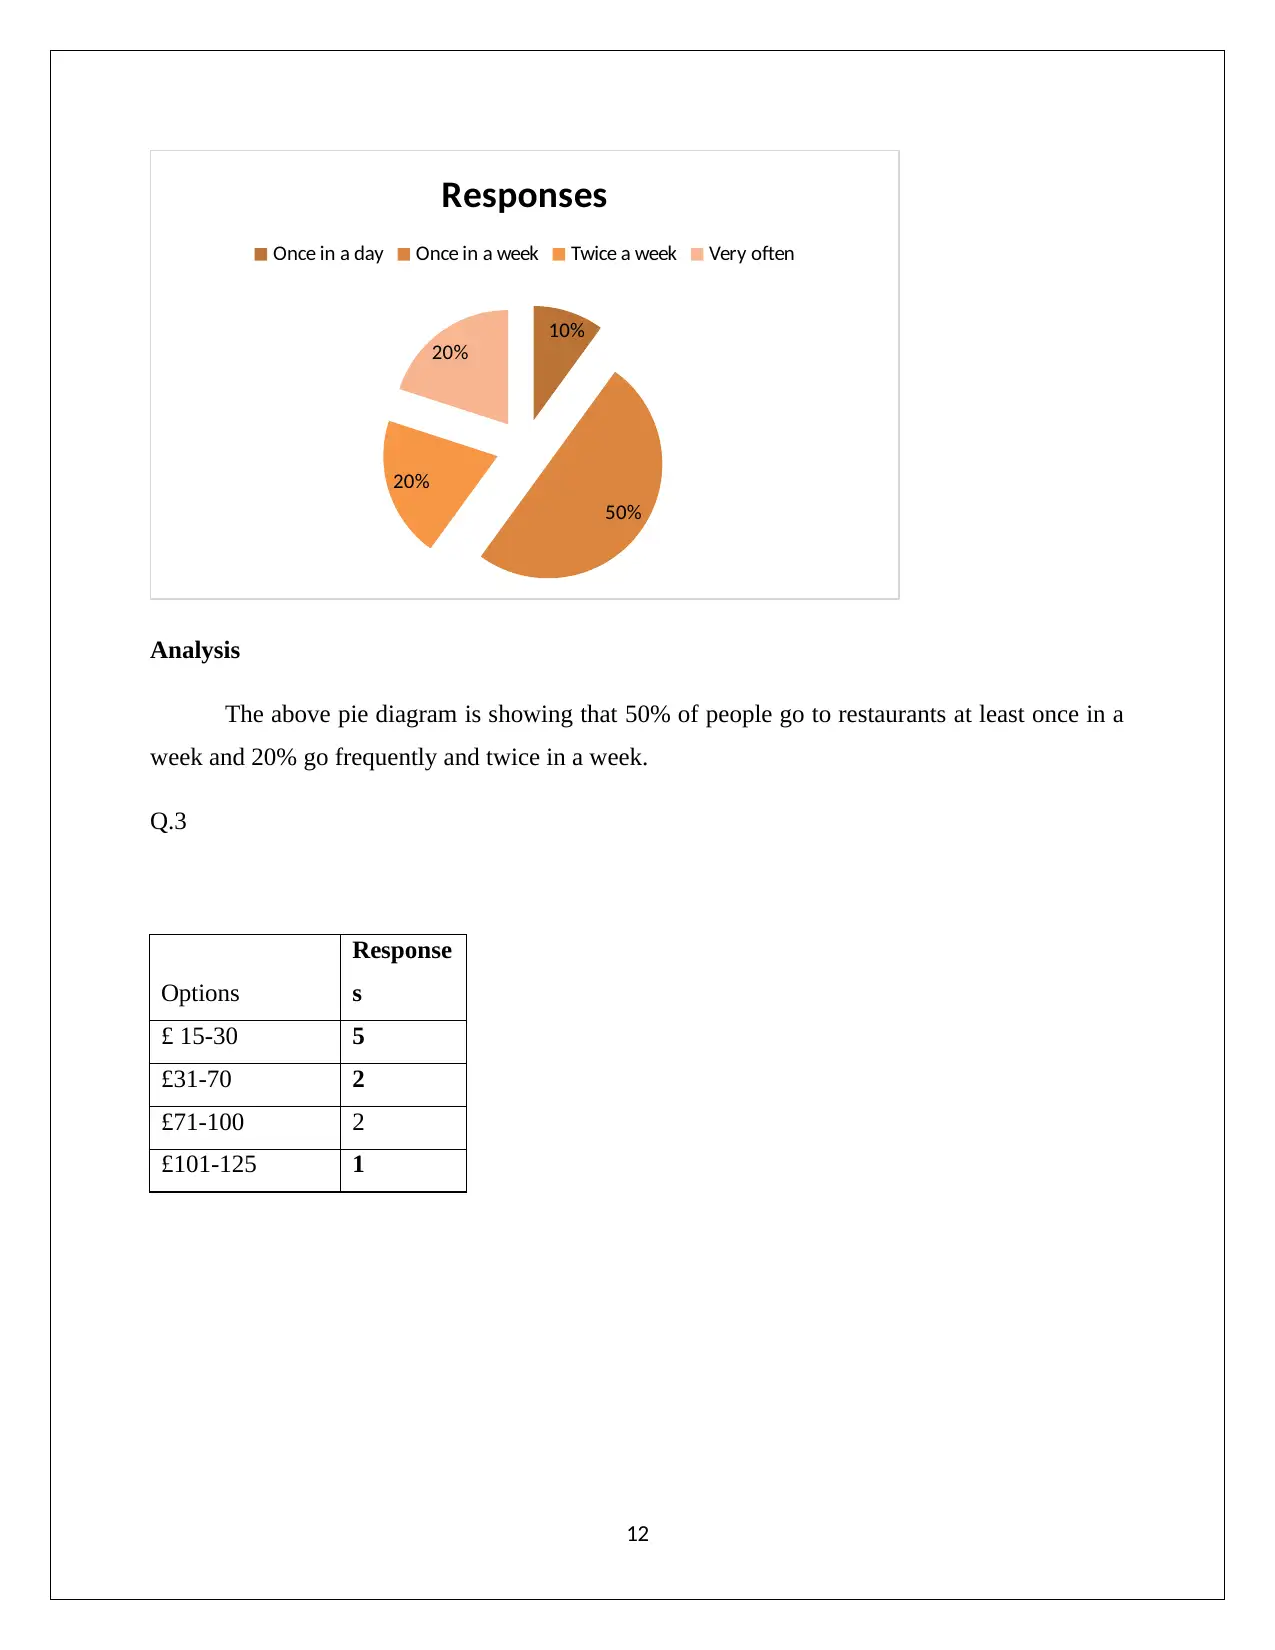
This report presents a comprehensive analysis of data collected to inform business decision-making, specifically focusing on the optimal location for a new restaurant in London. The report begins with a detailed plan for collecting both primary and secondary data, outlining the use of questionnaires and survey methodologies to gather customer preferences regarding price, taste, and location. It then describes the survey methodology, including the sampling frame and questionnaire design, which includes both open-ended and closed-ended questions. The core of the report involves the analysis of survey results, including representative values such as mean, median, and mode, as well as measures of dispersion, quartiles, and percentiles, to draw valid conclusions. The data analysis utilizes various charts and diagrams to visually represent the findings, such as pie charts and bar graphs. The report concludes with recommendations for the restaurant's board of directors, emphasizing the importance of quality food, reasonable prices, and strategic location to ensure successful business launch. Furthermore, the report includes a detailed discussion of the survey results, highlighting consumer preferences and providing insights into the most effective strategies for attracting a large customer base.
Document Page
Business Decision Making
1
tabler-icon-diamond-filled.svg

Paraphrase This Document

Need a fresh take? Get an instant paraphrase of this document with our AI Paraphraser
Document Page
Table of Contents
Task 1...............................................................................................................................................3
Task 2...............................................................................................................................................6
Task 3.............................................................................................................................................10
Task 4.............................................................................................................................................26
References......................................................................................................................................31
2
Document Page
Task 1
A.C 1.1
The research aims to collect the data which can help in understanding the price, taste, and
preferences for a location for opening the second restaurant in London.
The data will be collected from both primary and secondary source. Primary data will
collect the direct information from the customers or can also be said to be first-hand information.
The researcher himself collects the information which can be via email, face to face and
telephone. For the collecting, the primary data the questionnaire will be prepared including open-
ended questions (Osborne, 2012). There will be minimum 10 questions to be asked under the
questionnaire. The questionnaire will be posted via using online platform where customers who
are interested can fill their forms and the data collected will be helpful in opening the second
restaurant “food for friends”.
Another source for collecting the data is the secondary data collection under which the
data has already been collected and scrutinized by another researcher. The secondary data will be
collected through directory, articles, journals which are containing the details of the existing
restaurants and the menu of the restaurants.
A.C 1.2
Survey methodology is the method to be used or involved in conducting a survey on the
population of London. A comprehensive research method will be implemented for accumulating
the significant information for the business decision making(Mackey and Gass, 2015). The
survey can be conducted by telephone, mails or personal interview. The survey will be conducted
on the 100 people determining their preferences, choices and liking for the restaurant. The survey
will be conducted with two essential elements which are questionnaire and sample framework.
But as discussed above the data will be collected via questionnaire sequenced in an effective
manner for obtaining the essential information. The questionnaire will be very supportive in
getting the data in a fair manner preventing biases. After performing the survey the data will be
positioned in the safe and secure place.
3
Document Page
Sample framework will assist in studying the population. There are various methods for
sampling and for this research; there will be the use of simple random sampling method under
which every participant will get the equal opportunity to get selected. Among 100 respondents,
10 participants will be selected for interpretation of the data. There will be the application of
both qualitative and quantitative survey methodology. Under quantitative research framework
the data will be analysed with the use of numerical terms and in qualitative research method,
there will be the use of bars, diagrams, and graphs.
A.C 1.3
The questionnaire is the set of the questions planned in relation to the topic of the
research circulated to the respondents for getting the required information. The questionnaire
will be helpful for the board of directors for deciding the location for the restaurant.
Q1 what is your age faction?
a. 15-18
b. 19-25
c. 26-35
d. 50 above
Q2 How often you go to a restaurant?
a. Once in a day
b. Once in a week
c. Twice a week
d. Very often
Q3 what price you like to spend on going for food in a restaurant?
a. £ 15-30
b. £31-70
c. £71-100
d. £101-125
Q4 which location you prefer the most when going to any restaurant?
4
tabler-icon-diamond-filled.svg

Paraphrase This Document

Need a fresh take? Get an instant paraphrase of this document with our AI Paraphraser
Document Page
a. City
b. Street place
c. Beaches
d. Shopping malls
Q5 When would you like to go in a restaurant?
a. Morning
b. Evening
c. Night
d. Any time
Q6 what would you like the most effective in any restaurant?
a. Quality
b. Taste
c. Health
d. Price
Q7 Would you like to try new restaurants?
a. Yes
b. No
Q8 what would you like to have anything other than the food in any restaurant?
a. Music
b. Shows
c. Culture festivals
d. Nothing but peace
Q9 Would you like to recommend your friends and relatives for the new restaurant?
a. Yes
b. No
Q 10 What type of food you prefer the most?
5
Document Page
a. Vegetarian food
b. Non-vegetarian food
c. Chinese food
d. Spicy food
Q11 How much you want to spend for a single type of food?
a. £ 13-20
b. £21-35
c. £36-45
d. £46-65
Task 2
AC2.1
After reviewing the results of the survey conducted on the people of London, it has been
found that most of the people prefer to go to restaurants once in a week. Further, the results also
summarized that people prefer to pay less while going to restaurants. Respondents found to be
more concern on the location of the restaurant and demanded that the restaurant should be at city
and showed less interest in the shopping malls. There is the equal response of the respondent to
go to the restaurant at any time or at night or evening. Quality and taste should be the most
effective and amazing part of the restaurant.
6
Document Page
As
per the preferences of the people of London, there should be more shows, cultural festivals in the
restaurants as it provides peace and wonderful experience to them. People would prefer to have
more non vegetarian and Chinese food in the restaurant.
As the board of directors is required to take the best decision for the opening of the
second restaurant in London than from the above review it can be said that foremost need to
ensure the successful launch is to bring quality food with reasonable prices. Most of the
population would like to come anytime in the restaurant that means there will be a requirement
of providing 24*7hours services (Groebner, et. al., 2010). For that double shift will be required
to be there in the Company. Management would also be required to focus on controlling its cost
of producing food as people will prefer to pay less and also with high quality then only there will
7
Responses
Question 1 2 3 4 5 6 7 8 9 10
1 A D B B C A C A A A
2 B C A D D B C B B B
3 B C D A A B C A A C
4 A B C C D A A A A A
5 B B B C C C D D A C
6 A C D B A B C B A D
7 A B B A B B A A B B
8 A B B B A C C D D C
9 B B B A B B A B A B
10 A A B B B C C D C D
11 A A A B C C D C B B
tabler-icon-diamond-filled.svg

Paraphrase This Document

Need a fresh take? Get an instant paraphrase of this document with our AI Paraphraser
Document Page
be chances of going ahead of the break-even point. Management would also be required to invest
in organizing some shows and cultural festival as it will attract a large audience to come in the
restaurant.
AC2.2
Mean 2.5 2.5 2.5 2.5 2.5 2.5 5 2.5 5 2.5 2.5
Median 2 2 2 2 3 2.5 5 2.5 5 2.5 3
Mode 1 2 2 0 3 3 0 0 #N/A 2 3
Mean is deriving the average by summing up all the data and dividing it with the number
of data (Groebner, et. al., 2010). The above table is representing that the average mean of
respondent are mostly 2.5 which is also indicating that every question has a chance of average of
more than 20 people.
The mode is the repetition of the data or the value which is frequently occurring. The
mode can be calculated by using individual series, concrete and discrete series. The mode is
majorly found to be 3 which are also denoting that 30% of the people are around with the same
response.
Median can be said to be the mid value of the data or the middle most value of the data
and is derived by setting the data in ascending to descending order (Castro, et. al., 2010). As per
the above table, the median is mostly 2 or around 2 which means that most of the questions have
similar outcomes.
AC2.3
8
Document Page
SD
1.41421356
2
1.87082869
3
1.87082869
3
1.87082869
3
1.41421356
2
0.57735026
9
rang
e 4
4 4 4 2 1
SD 1.41421356
2
0.57735026
9
2.82842712
5
0.57735026
9
1
rang
e 2
1 4 1 2
The measure of dispersion is the measurement of the stretch of data and how much one
data is different from the other data of the same set. It denotes the variations in the one data from
other within the given data (Groebner, et. al., 2010). A measure of dispersion can be performed
with the use of standard deviation, correlation, range, and coefficient.
Standard of deviation is the measurement of scattered of data from the mean. As per the
above table, the data is not much dispersed from the mean and also indicating that the responses
of the participants are almost similar.
Range determines the difference between the highest and lowest value. From the table
above there is almost high and similar range which means many respondents are giving the same
reply to the same question.
AC2.4
9
Document Page
Quartile 25% 1.75 2.125 1.37
5 1.75 2.5 2 4.5 2 4 2 2.5
Quartile 75% 2.75 2.375 2.12
5 2.75 3 3 5.5 3 6 3 3
Percentile 2.75 2.375 2.12
5 2.125 2.87
5 2.5 5 2.75 5 2.375 2.125
A quartile is dividing of the one data into four equal parts. It can be in the form of 25, 50,
75 and 100. Quartile provides lower, middle, higher and mid-size of data. The quartile as per the
above data seems to be similar to the first 5 questions and become different for the rest of
question.
Percentile is the summarizing the data into 10 equal parts. It is determining the results
percentage. As per the above table, there are almost similar percentages for each question that
means respondents are giving the same percentage of response to each question.
Coefficient and correlation are determining the relation of the one data with between
variable. A negative correlation means there is the big difference between variables and vice
versa.
Task 3
AC3.1
Q.1
Options
Response
s
15-18 5
19-25 2
26-35 2
10
tabler-icon-diamond-filled.svg

Paraphrase This Document

Need a fresh take? Get an instant paraphrase of this document with our AI Paraphraser
Document Page
50 above 1
15-18
50%
19-25
20%
26-35
20%
50 above
10%
Responses
Analysis
The above diagram is presenting that people who participated in the survey were 50%
between the age of 15 and 18.
Q. 2
Options
Response
s
Once in a day 1
Once in a week 5
Twice a week 2
Very often 2
11
Document Page
10%
50%
20%
20%
Responses
Once in a day Once in a week Twice a week Very often
Analysis
The above pie diagram is showing that 50% of people go to restaurants at least once in a
week and 20% go frequently and twice in a week.
Q.3
Options
Response
s
£ 15-30 5
£31-70 2
£71-100 2
£101-125 1
12
chevron_up_icon
1 out of 32
circle_padding
hide_on_mobile
zoom_out_icon
[object Object]