Business Decision Making: Data Analysis and Report for F&F
VerifiedAdded on 2020/06/05
|16
|3871
|322
Report
AI Summary
This report, created for a Business Decision Making assignment, provides a comprehensive analysis of a business scenario involving a restaurant, Food for Friends (F&F), aiming to enhance its customer base and profitability. The report begins with a detailed plan for collecting primary data through surveys and secondary data from various sources, followed by the design of a questionnaire. It then delves into data analysis, summarizing sales and profit figures using representative values and measures of dispersion, and drawing valid conclusions through thematic perception testing. The report showcases the application of statistical tools like quartile, percentile, and correlation coefficients, along with the creation of graphs and trend lines. It concludes with a discussion on project planning, financial tools, and their role in effective business decision-making. The assignment covers various aspects of data collection, analysis, and presentation, highlighting the importance of informed decision-making in a business context.

Business Decision Making
Paraphrase This Document
Need a fresh take? Get an instant paraphrase of this document with our AI Paraphraser
TABLE OF CONTENTS
INTRODUCTION......................................................................................................................1
TASK 1......................................................................................................................................1
1.1 Creating plan for primary and secondary data collection................................................1
1.2 Presenting survey methodology and sampling frame used..............................................2
1.3 Designing questionnaire for survey purpose....................................................................3
2.1 Creating information for decision making by summarizing data set...............................5
2.2 Analyzing results to draw valid conclusion.....................................................................6
2.3 Summarizing data through using measures of dispersion................................................7
2.4 Explaining quartile, percentile and correlation co-efficient.............................................8
3.1 Producing graph using spreadsheet..................................................................................9
3.2 Creating trend lines in spreadsheet graphs.......................................................................9
3.3 Preparing business presentation.....................................................................................10
3.4 Producing formal business report...................................................................................10
TASK 2....................................................................................................................................11
4.1 Using appropriate information processing tools for decision making...........................11
4.2 Preparing project plan and determining critical path.....................................................11
4.3 Using financial tools for decision making.....................................................................13
CONCLUSION........................................................................................................................14
REFERENCES.........................................................................................................................15
INTRODUCTION
Business decision making implies for the selection of one proposal out of several
alternative options available to the entrepreneur. Sales, profit and success of business unit is
highly dependent on the decision taken by the manager. Thus, it is the accountability of
manager to consider both financial and non-financial aspects while taking decision. Now,
several statistical tools are available that can be easily applied by the manager for decision
making. In the recent times, London becomes most exciting and dynamic city in the world.
Moreover, it is highly suitable for all purpose such as commerce, studies, business, culture
etc. By considering this, business entity has taken decision in relation to opening new
restaurant in London namely Food for Friends (F&F). In this, report will highlight
preferences and attitude of customers through the means of primary as well as secondary
research. Further, it will also provide deeper insight about the how statistical tools are applied
for summarizing data set. Besides this, it also shed light on the manner in which project
management and financial tools aid in decision making.
TASK 1
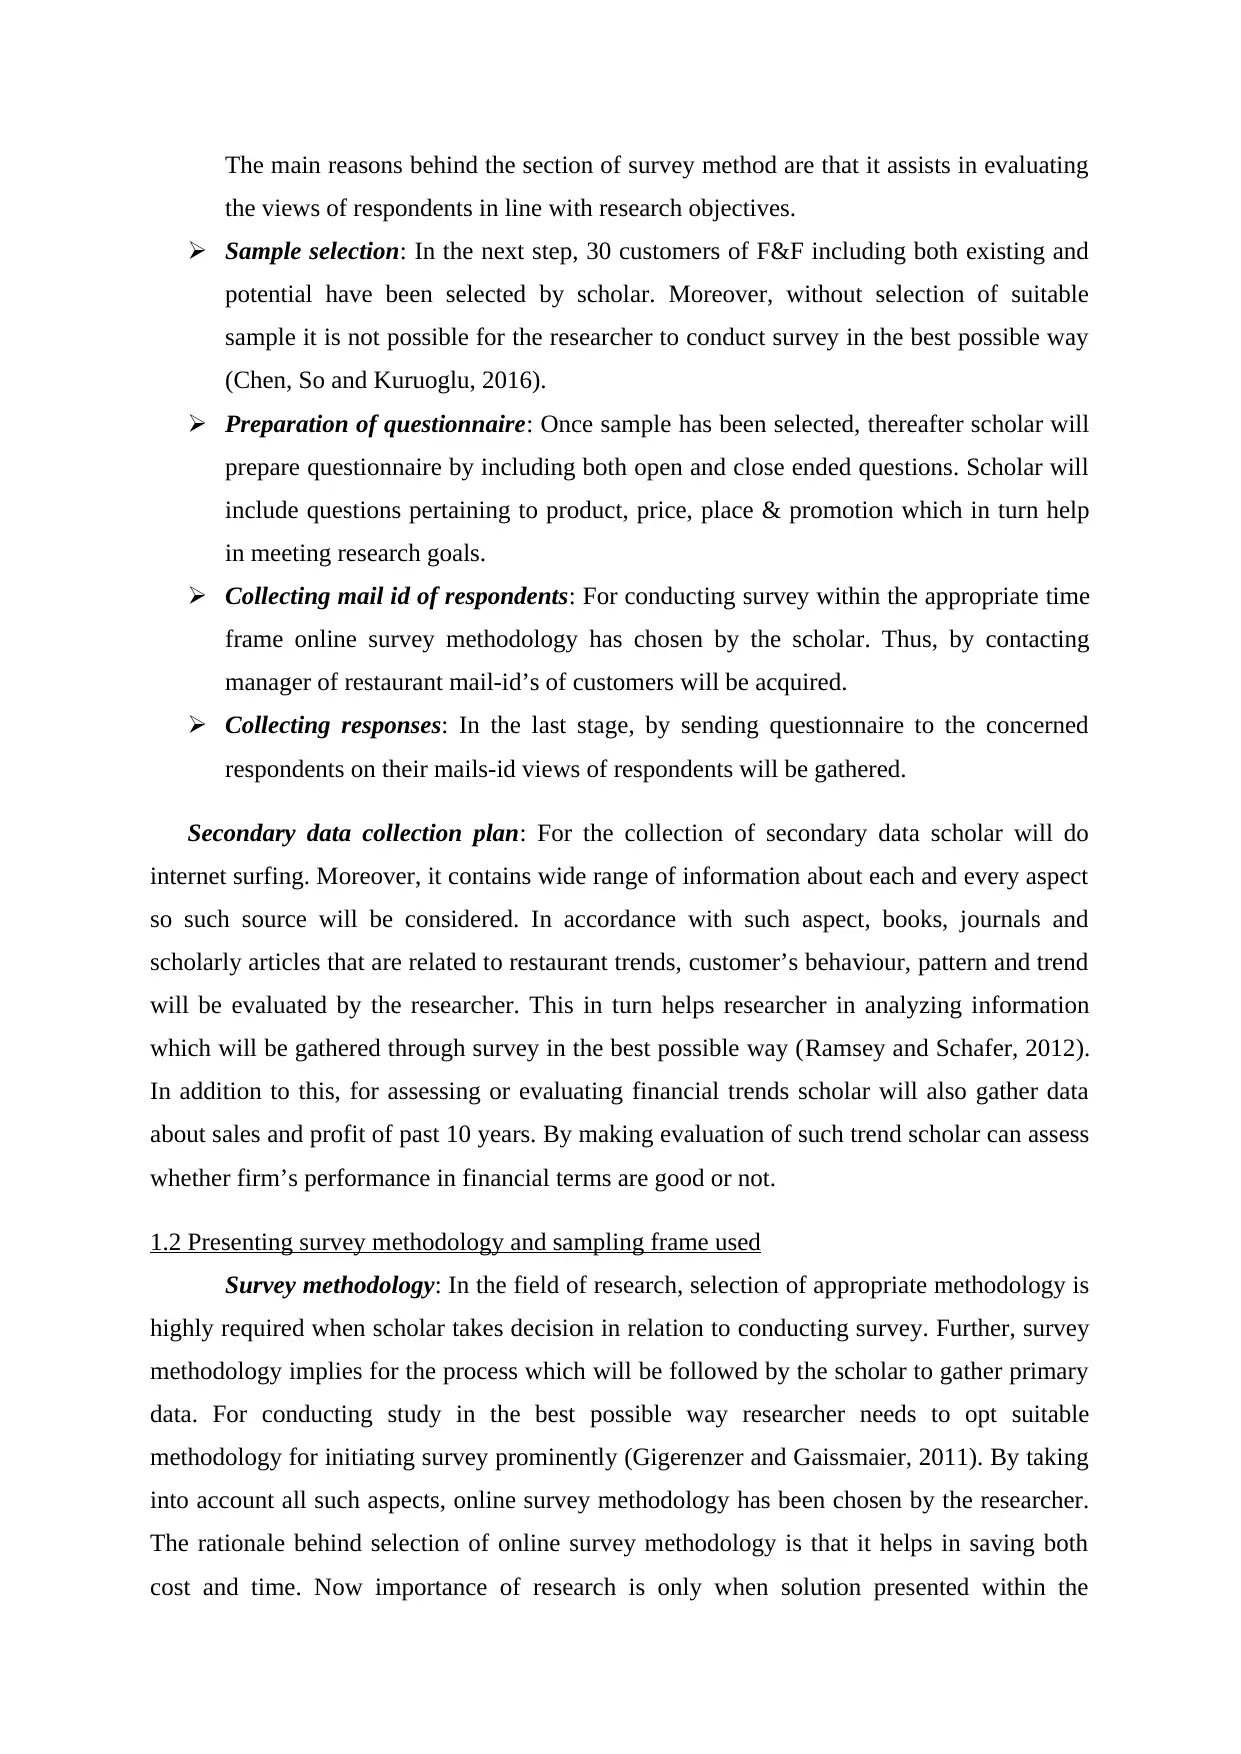
1.1 Creating plan for primary and secondary data collection
Owner of F&F wants to enhance customer base as well as maximize productivity and
profitability. However, before doing large investment business entity wishes to assess the
needs and expectation of existing customers. In this regard, investigation is carried out by the
researcher by gathering both primary and secondary data set. Primary data is the one that
researcher specifically gathers for meeting research aims and objectives (Bickel and
Lehmann, 2012). On the contrary to it, secondary data refers to the one that has already been
gathered, analyzed and published by other scholars. Thus, plan pertaining to data collection is
enumerated below:
Plan for primary data collection: Survey will be conducted by the researcher to
gather primary data. For this purpose, below mentioned plan will be followed by the scholar:
Selection of primary data method: Out of several methods, such as interview,
observation, focus group etc, scholar has taken decision in relation to doing survey.
Business decision making implies for the selection of one proposal out of several
alternative options available to the entrepreneur. Sales, profit and success of business unit is
highly dependent on the decision taken by the manager. Thus, it is the accountability of
manager to consider both financial and non-financial aspects while taking decision. Now,
several statistical tools are available that can be easily applied by the manager for decision
making. In the recent times, London becomes most exciting and dynamic city in the world.
Moreover, it is highly suitable for all purpose such as commerce, studies, business, culture
etc. By considering this, business entity has taken decision in relation to opening new
restaurant in London namely Food for Friends (F&F). In this, report will highlight
preferences and attitude of customers through the means of primary as well as secondary
research. Further, it will also provide deeper insight about the how statistical tools are applied
for summarizing data set. Besides this, it also shed light on the manner in which project
management and financial tools aid in decision making.
TASK 1
1.1 Creating plan for primary and secondary data collection
Owner of F&F wants to enhance customer base as well as maximize productivity and
profitability. However, before doing large investment business entity wishes to assess the
needs and expectation of existing customers. In this regard, investigation is carried out by the
researcher by gathering both primary and secondary data set. Primary data is the one that
researcher specifically gathers for meeting research aims and objectives (Bickel and
Lehmann, 2012). On the contrary to it, secondary data refers to the one that has already been
gathered, analyzed and published by other scholars. Thus, plan pertaining to data collection is
enumerated below:
Plan for primary data collection: Survey will be conducted by the researcher to
gather primary data. For this purpose, below mentioned plan will be followed by the scholar:
Selection of primary data method: Out of several methods, such as interview,
observation, focus group etc, scholar has taken decision in relation to doing survey.
⊘ This is a preview!⊘
Do you want full access?
Subscribe today to unlock all pages.
Trusted by 1+ million students worldwide
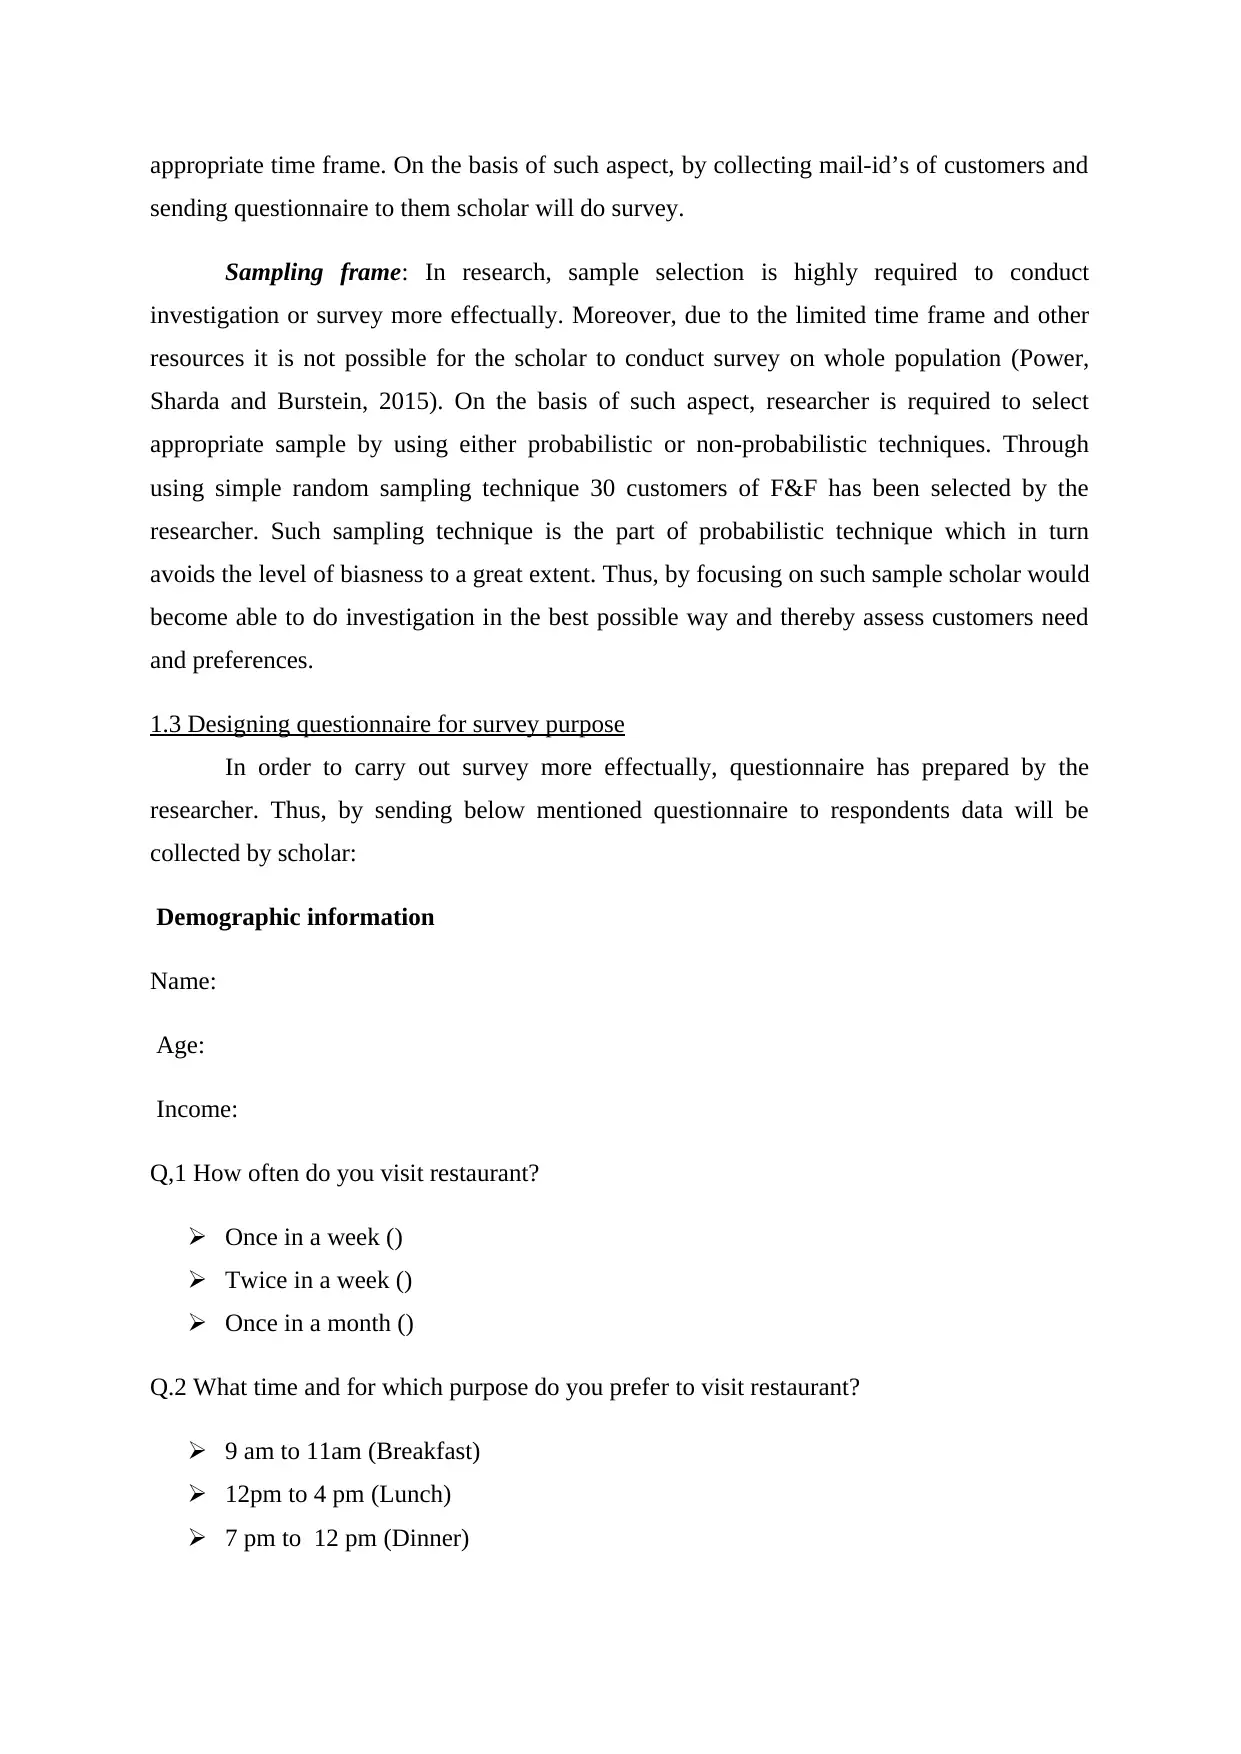
The main reasons behind the section of survey method are that it assists in evaluating
the views of respondents in line with research objectives.
Sample selection: In the next step, 30 customers of F&F including both existing and
potential have been selected by scholar. Moreover, without selection of suitable
sample it is not possible for the researcher to conduct survey in the best possible way
(Chen, So and Kuruoglu, 2016).
Preparation of questionnaire: Once sample has been selected, thereafter scholar will
prepare questionnaire by including both open and close ended questions. Scholar will
include questions pertaining to product, price, place & promotion which in turn help
in meeting research goals.
Collecting mail id of respondents: For conducting survey within the appropriate time
frame online survey methodology has chosen by the scholar. Thus, by contacting
manager of restaurant mail-id’s of customers will be acquired.
Collecting responses: In the last stage, by sending questionnaire to the concerned
respondents on their mails-id views of respondents will be gathered.
Secondary data collection plan: For the collection of secondary data scholar will do
internet surfing. Moreover, it contains wide range of information about each and every aspect
so such source will be considered. In accordance with such aspect, books, journals and
scholarly articles that are related to restaurant trends, customer’s behaviour, pattern and trend
will be evaluated by the researcher. This in turn helps researcher in analyzing information
which will be gathered through survey in the best possible way (Ramsey and Schafer, 2012).
In addition to this, for assessing or evaluating financial trends scholar will also gather data
about sales and profit of past 10 years. By making evaluation of such trend scholar can assess
whether firm’s performance in financial terms are good or not.
1.2 Presenting survey methodology and sampling frame used
Survey methodology: In the field of research, selection of appropriate methodology is
highly required when scholar takes decision in relation to conducting survey. Further, survey
methodology implies for the process which will be followed by the scholar to gather primary
data. For conducting study in the best possible way researcher needs to opt suitable
methodology for initiating survey prominently (Gigerenzer and Gaissmaier, 2011). By taking
into account all such aspects, online survey methodology has been chosen by the researcher.
The rationale behind selection of online survey methodology is that it helps in saving both
cost and time. Now importance of research is only when solution presented within the
Paraphrase This Document
Need a fresh take? Get an instant paraphrase of this document with our AI Paraphraser
appropriate time frame. On the basis of such aspect, by collecting mail-id’s of customers and
sending questionnaire to them scholar will do survey.
Sampling frame: In research, sample selection is highly required to conduct
investigation or survey more effectually. Moreover, due to the limited time frame and other
resources it is not possible for the scholar to conduct survey on whole population (Power,
Sharda and Burstein, 2015). On the basis of such aspect, researcher is required to select
appropriate sample by using either probabilistic or non-probabilistic techniques. Through
using simple random sampling technique 30 customers of F&F has been selected by the
researcher. Such sampling technique is the part of probabilistic technique which in turn
avoids the level of biasness to a great extent. Thus, by focusing on such sample scholar would
become able to do investigation in the best possible way and thereby assess customers need
and preferences.
1.3 Designing questionnaire for survey purpose
In order to carry out survey more effectually, questionnaire has prepared by the
researcher. Thus, by sending below mentioned questionnaire to respondents data will be
collected by scholar:
Demographic information
Name:
Age:
Income:
Q,1 How often do you visit restaurant?
Once in a week ()
Twice in a week ()
Once in a month ()
Q.2 What time and for which purpose do you prefer to visit restaurant?
9 am to 11am (Breakfast)
12pm to 4 pm (Lunch)
7 pm to 12 pm (Dinner)
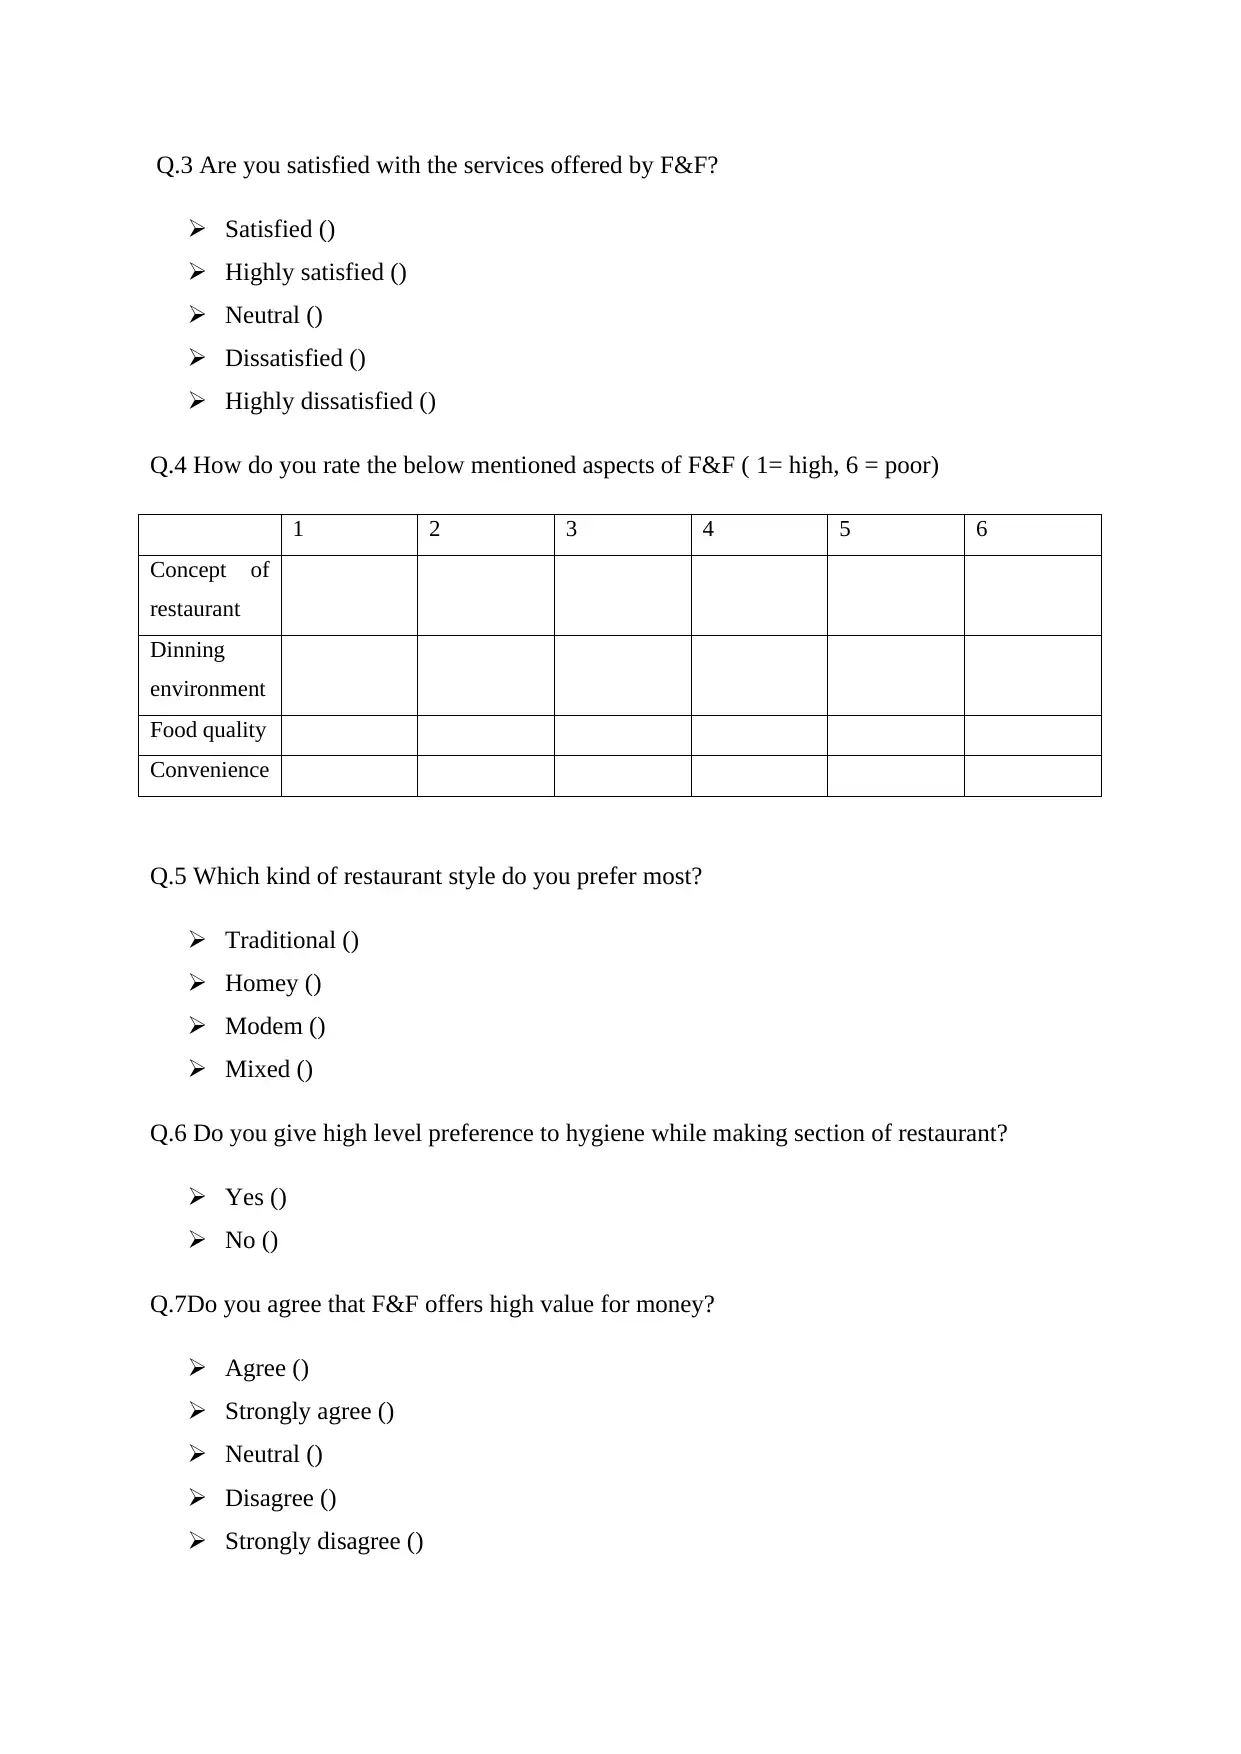
Q.3 Are you satisfied with the services offered by F&F?
Satisfied ()
Highly satisfied ()
Neutral ()
Dissatisfied ()
Highly dissatisfied ()
Q.4 How do you rate the below mentioned aspects of F&F ( 1= high, 6 = poor)
1 2 3 4 5 6
Concept of
restaurant
Dinning
environment
Food quality
Convenience
Q.5 Which kind of restaurant style do you prefer most?
Traditional ()
Homey ()
Modem ()
Mixed ()
Q.6 Do you give high level preference to hygiene while making section of restaurant?
Yes ()
No ()
Q.7Do you agree that F&F offers high value for money?
Agree ()
Strongly agree ()
Neutral ()
Disagree ()
Strongly disagree ()
⊘ This is a preview!⊘
Do you want full access?
Subscribe today to unlock all pages.
Trusted by 1+ million students worldwide
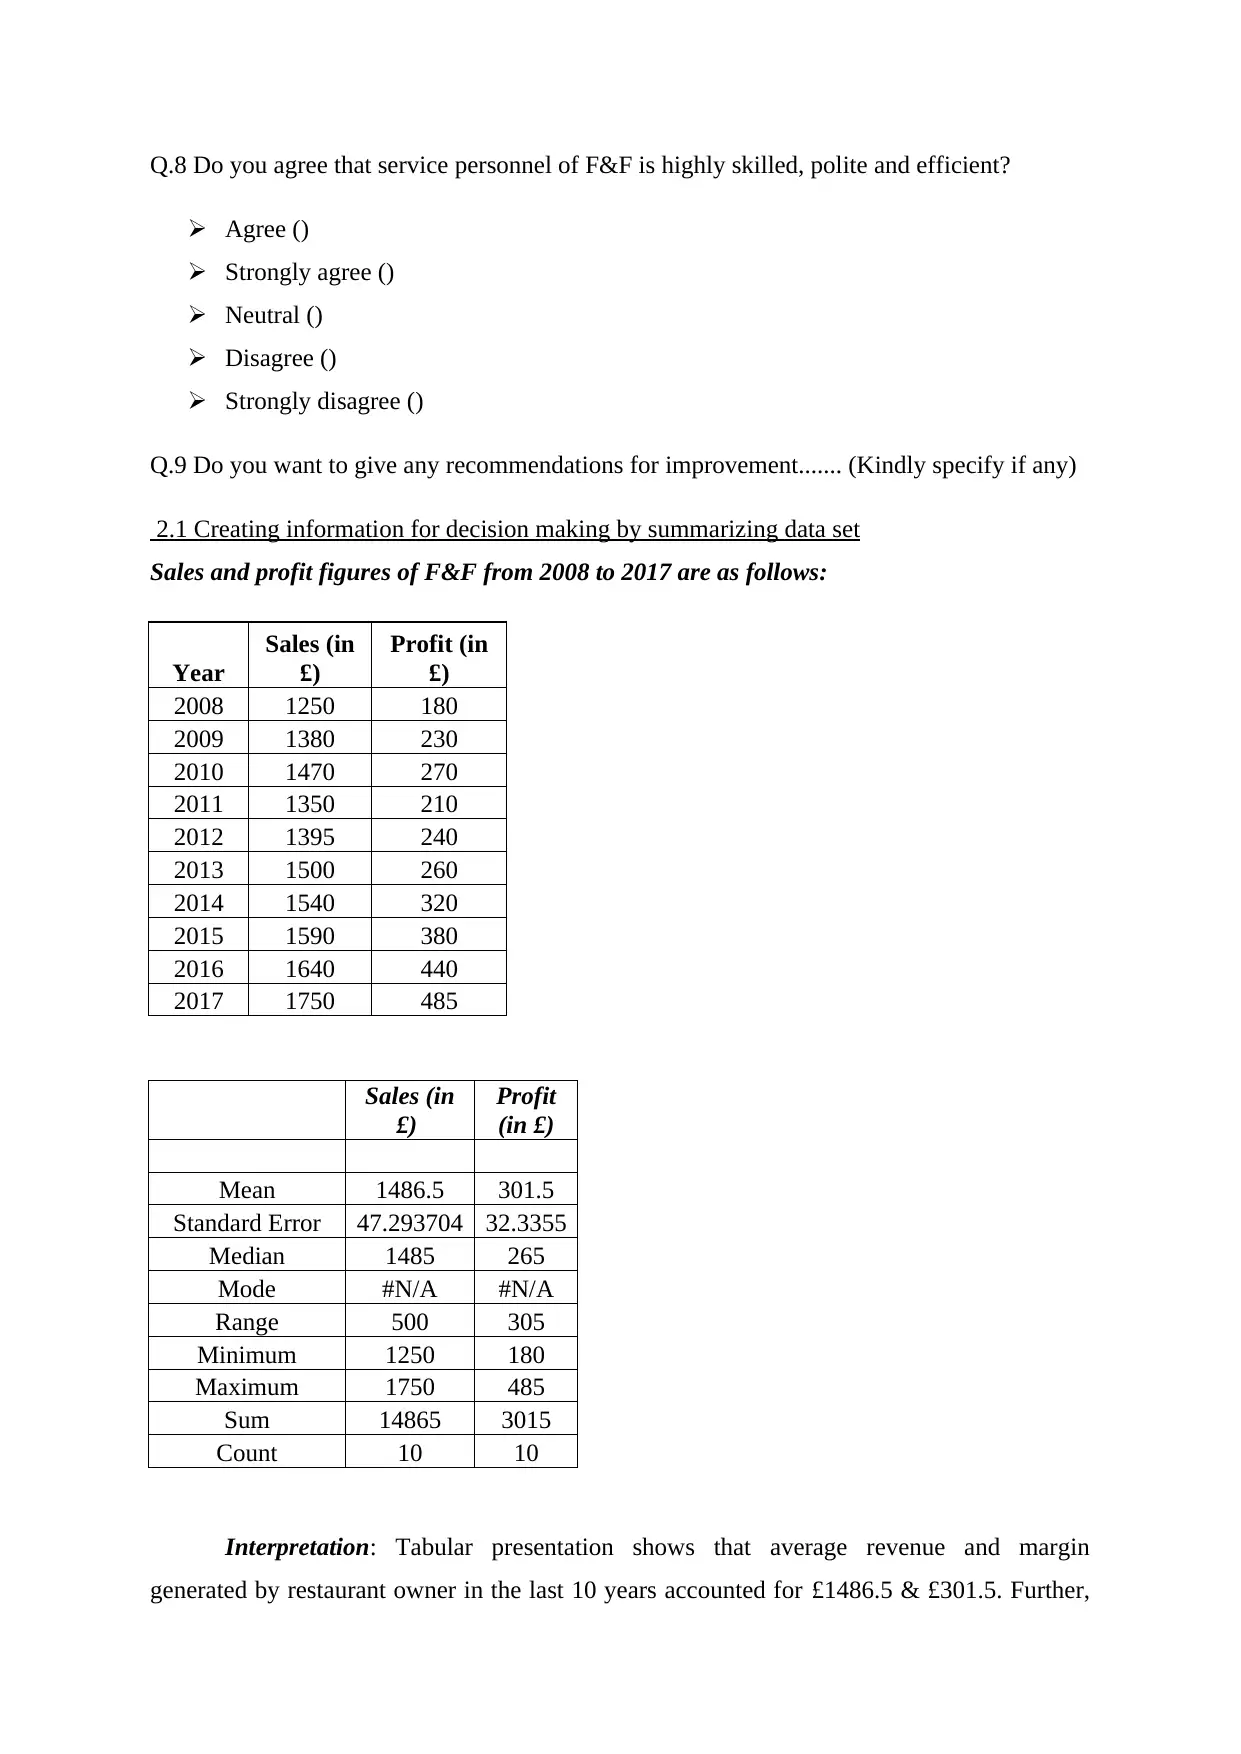
Q.8 Do you agree that service personnel of F&F is highly skilled, polite and efficient?
Agree ()
Strongly agree ()
Neutral ()
Disagree ()
Strongly disagree ()
Q.9 Do you want to give any recommendations for improvement....... (Kindly specify if any)
2.1 Creating information for decision making by summarizing data set
Sales and profit figures of F&F from 2008 to 2017 are as follows:
Year
Sales (in
£)
Profit (in
£)
2008 1250 180
2009 1380 230
2010 1470 270
2011 1350 210
2012 1395 240
2013 1500 260
2014 1540 320
2015 1590 380
2016 1640 440
2017 1750 485
Sales (in
£)
Profit
(in £)
Mean 1486.5 301.5
Standard Error 47.293704 32.3355
Median 1485 265
Mode #N/A #N/A
Range 500 305
Minimum 1250 180
Maximum 1750 485
Sum 14865 3015
Count 10 10
Interpretation: Tabular presentation shows that average revenue and margin
generated by restaurant owner in the last 10 years accounted for £1486.5 & £301.5. Further,
Paraphrase This Document
Need a fresh take? Get an instant paraphrase of this document with our AI Paraphraser
median (50% sales) is £1485 & £265. Thus, considering such trend, it can be depicted that
mean and median sales are highly near. However, for making improvement and enhancing
profit margin restaurant owner is required to undertake budgeting technique. By doing this,
restaurant unit can exert control over expenses and thereby improves profit margin.
2.2 Analyzing results to draw valid conclusion
In order to analyze primary data, thematic perception test technique has been used by
the researcher. To facilitate better understanding about outcome graphs and charts have also
been included.
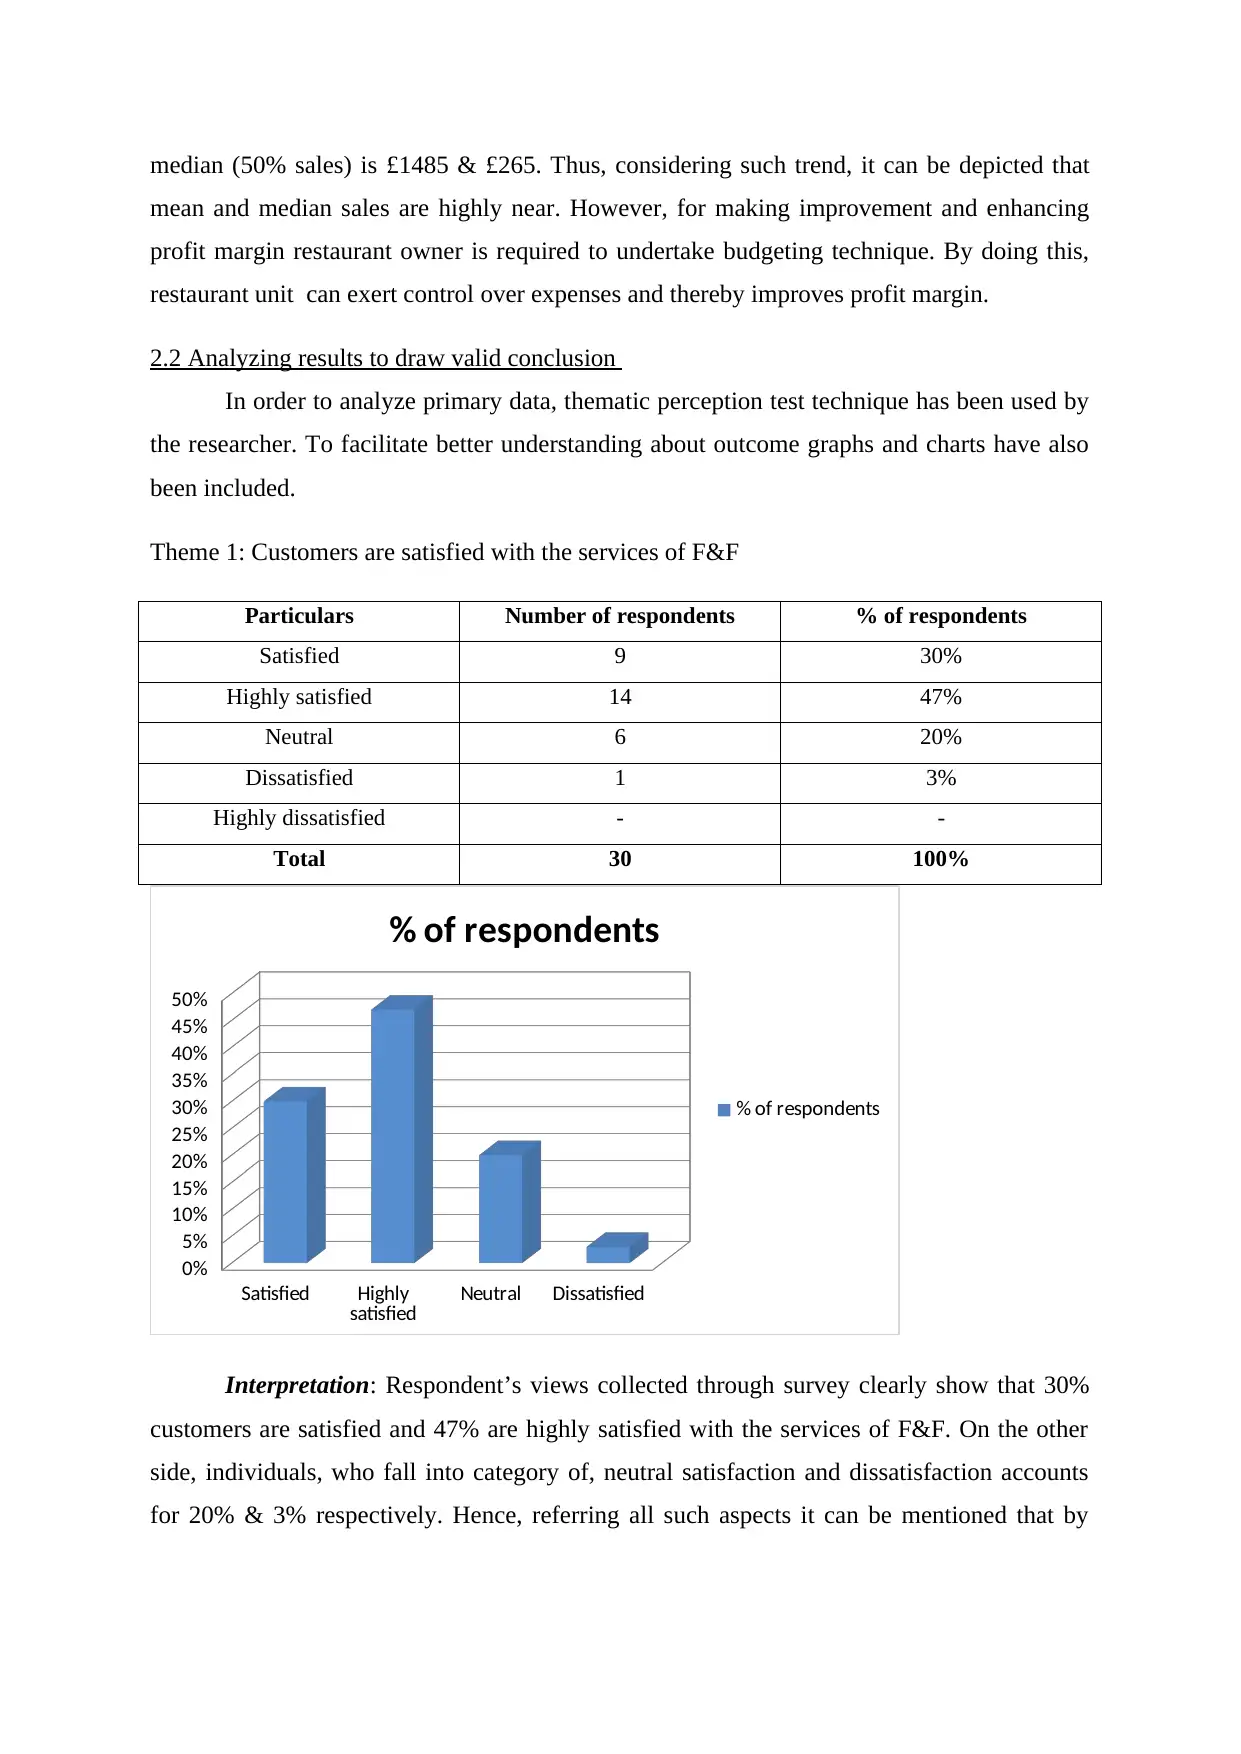
Theme 1: Customers are satisfied with the services of F&F
Particulars Number of respondents % of respondents
Satisfied 9 30%
Highly satisfied 14 47%
Neutral 6 20%
Dissatisfied 1 3%
Highly dissatisfied - -
Total 30 100%
Satisfied Highly
satisfied Neutral Dissatisfied
0%
5%
10%
15%
20%
25%
30%
35%
40%
45%
50%
% of respondents
% of respondents
Interpretation: Respondent’s views collected through survey clearly show that 30%
customers are satisfied and 47% are highly satisfied with the services of F&F. On the other
side, individuals, who fall into category of, neutral satisfaction and dissatisfaction accounts
for 20% & 3% respectively. Hence, referring all such aspects it can be mentioned that by
mean and median sales are highly near. However, for making improvement and enhancing
profit margin restaurant owner is required to undertake budgeting technique. By doing this,
restaurant unit can exert control over expenses and thereby improves profit margin.
2.2 Analyzing results to draw valid conclusion
In order to analyze primary data, thematic perception test technique has been used by
the researcher. To facilitate better understanding about outcome graphs and charts have also
been included.
Theme 1: Customers are satisfied with the services of F&F
Particulars Number of respondents % of respondents
Satisfied 9 30%
Highly satisfied 14 47%
Neutral 6 20%
Dissatisfied 1 3%
Highly dissatisfied - -
Total 30 100%
Satisfied Highly
satisfied Neutral Dissatisfied
0%
5%
10%
15%
20%
25%
30%
35%
40%
45%
50%
% of respondents
% of respondents
Interpretation: Respondent’s views collected through survey clearly show that 30%
customers are satisfied and 47% are highly satisfied with the services of F&F. On the other
side, individuals, who fall into category of, neutral satisfaction and dissatisfaction accounts
for 20% & 3% respectively. Hence, referring all such aspects it can be mentioned that by
offering quality and standard services restaurant has evolved high level of satisfaction among
the customers.
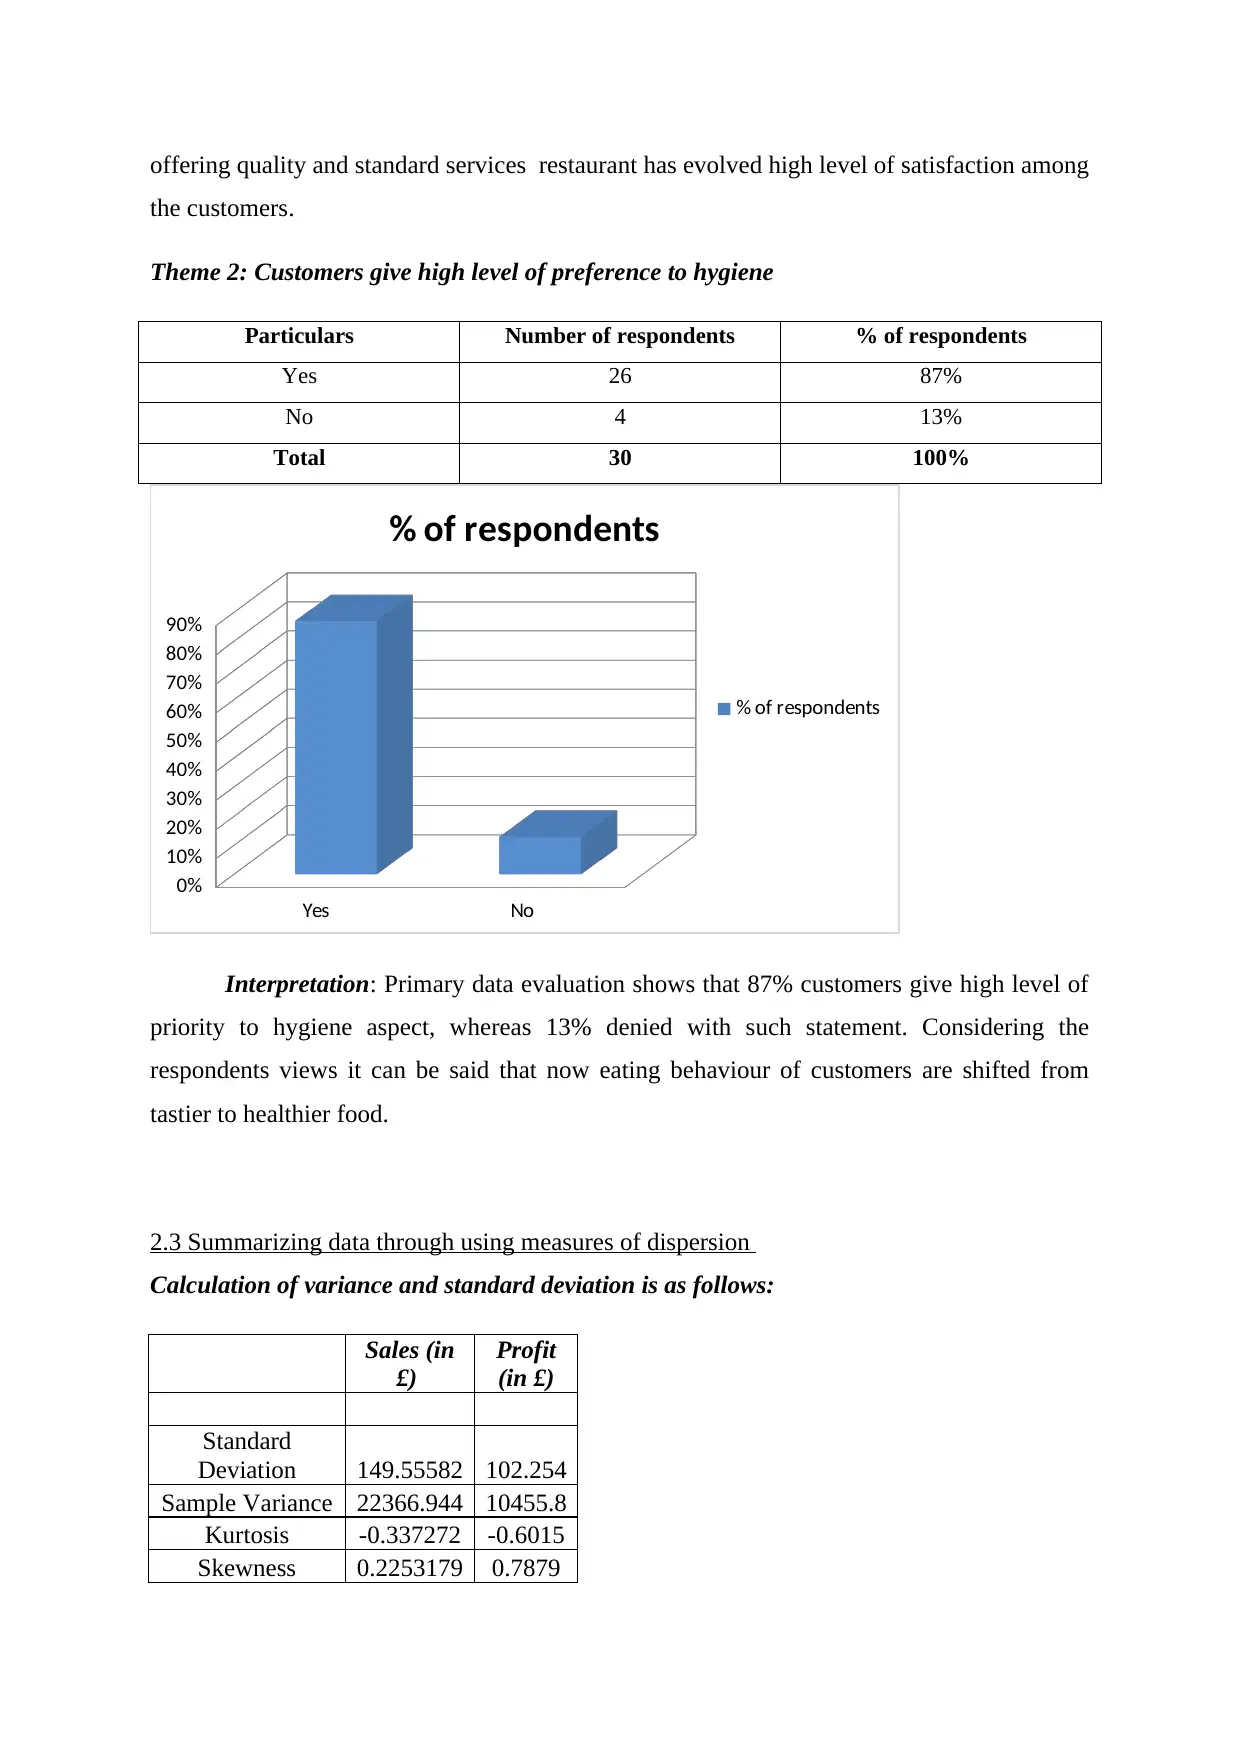
Theme 2: Customers give high level of preference to hygiene
Particulars Number of respondents % of respondents
Yes 26 87%
No 4 13%
Total 30 100%
Yes No
0%
10%
20%
30%
40%
50%
60%
70%
80%
90%
% of respondents
% of respondents
Interpretation: Primary data evaluation shows that 87% customers give high level of
priority to hygiene aspect, whereas 13% denied with such statement. Considering the
respondents views it can be said that now eating behaviour of customers are shifted from
tastier to healthier food.
2.3 Summarizing data through using measures of dispersion
Calculation of variance and standard deviation is as follows:
Sales (in
£)
Profit
(in £)
Standard
Deviation 149.55582 102.254
Sample Variance 22366.944 10455.8
Kurtosis -0.337272 -0.6015
Skewness 0.2253179 0.7879
the customers.
Theme 2: Customers give high level of preference to hygiene
Particulars Number of respondents % of respondents
Yes 26 87%
No 4 13%
Total 30 100%
Yes No
0%
10%
20%
30%
40%
50%
60%
70%
80%
90%
% of respondents
% of respondents
Interpretation: Primary data evaluation shows that 87% customers give high level of
priority to hygiene aspect, whereas 13% denied with such statement. Considering the
respondents views it can be said that now eating behaviour of customers are shifted from
tastier to healthier food.
2.3 Summarizing data through using measures of dispersion
Calculation of variance and standard deviation is as follows:
Sales (in
£)
Profit
(in £)
Standard
Deviation 149.55582 102.254
Sample Variance 22366.944 10455.8
Kurtosis -0.337272 -0.6015
Skewness 0.2253179 0.7879
⊘ This is a preview!⊘
Do you want full access?
Subscribe today to unlock all pages.
Trusted by 1+ million students worldwide
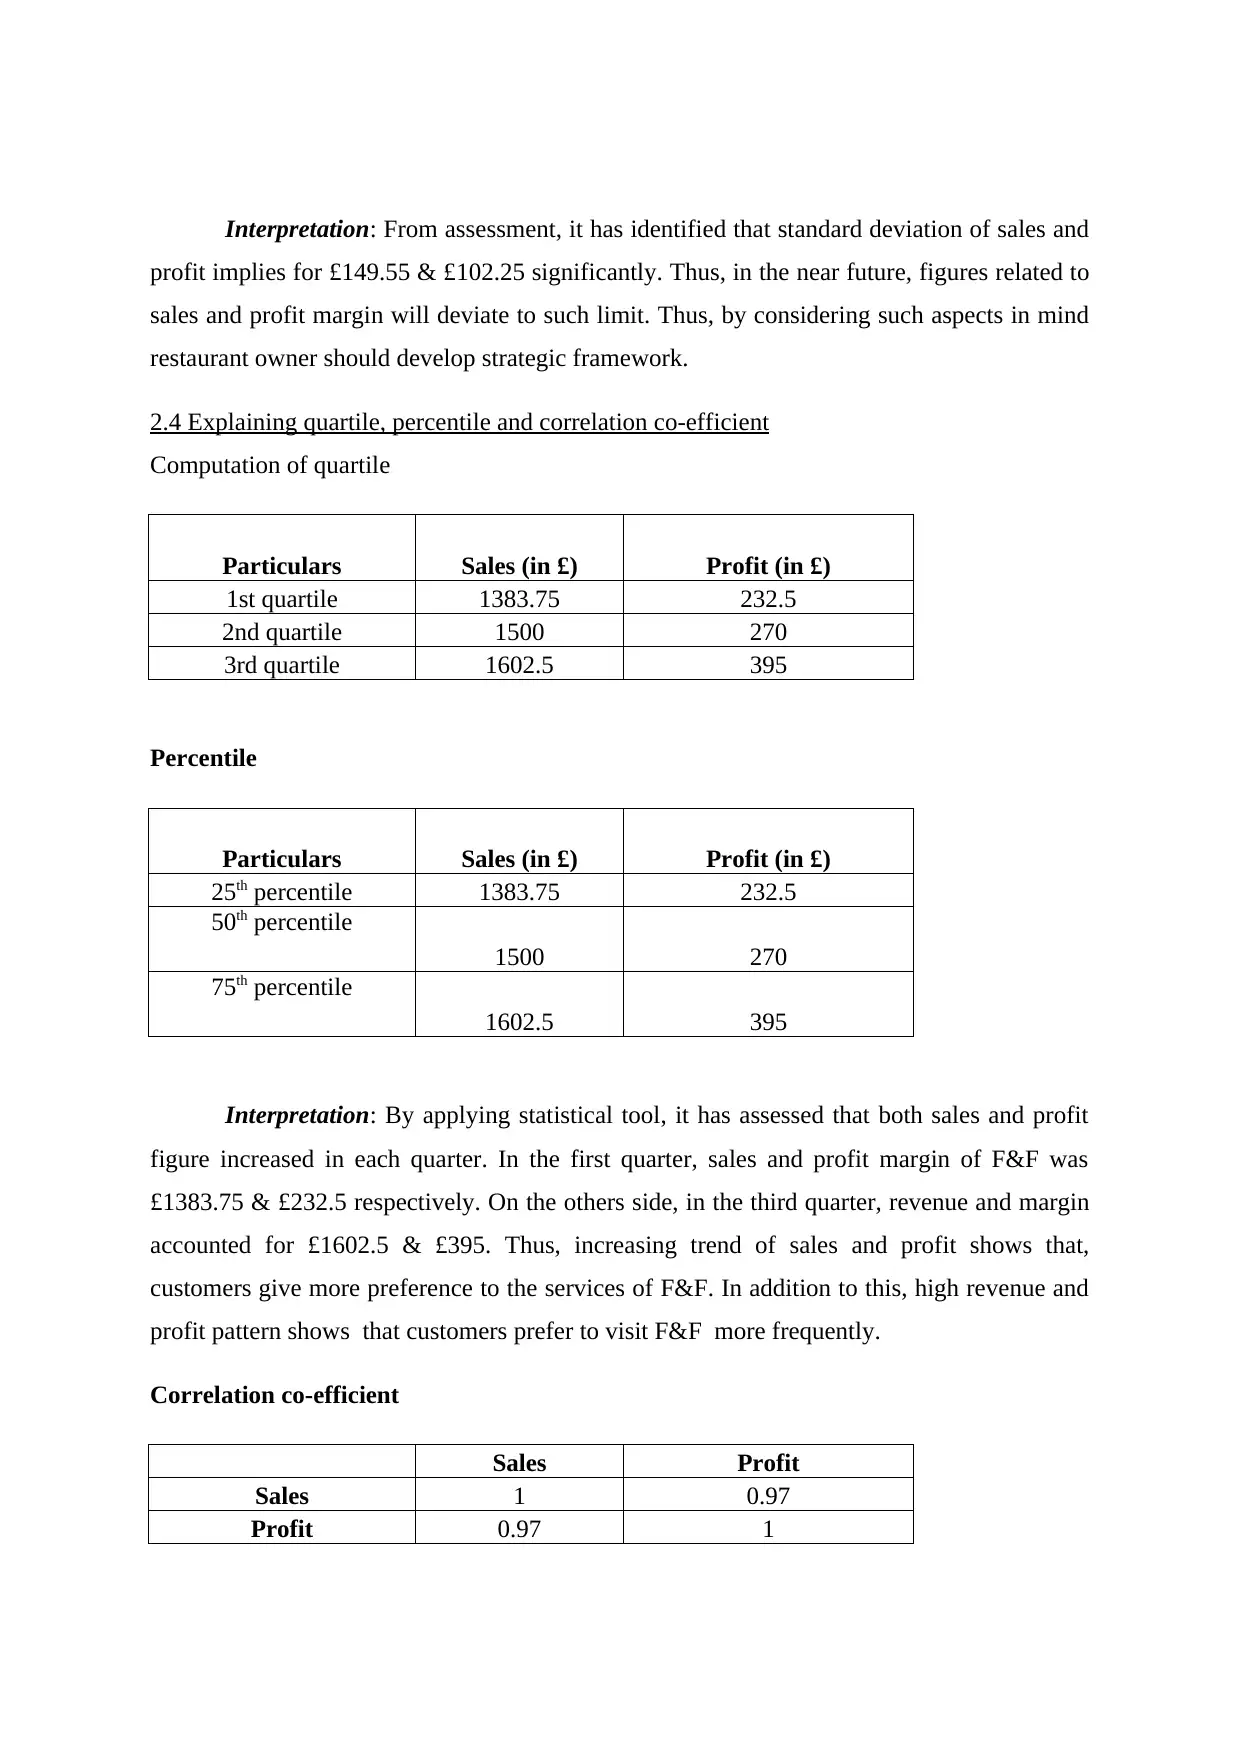
Interpretation: From assessment, it has identified that standard deviation of sales and
profit implies for £149.55 & £102.25 significantly. Thus, in the near future, figures related to
sales and profit margin will deviate to such limit. Thus, by considering such aspects in mind
restaurant owner should develop strategic framework.
2.4 Explaining quartile, percentile and correlation co-efficient
Computation of quartile
Particulars Sales (in £) Profit (in £)
1st quartile 1383.75 232.5
2nd quartile 1500 270
3rd quartile 1602.5 395
Percentile
Particulars Sales (in £) Profit (in £)
25th percentile 1383.75 232.5
50th percentile
1500 270
75th percentile
1602.5 395
Interpretation: By applying statistical tool, it has assessed that both sales and profit
figure increased in each quarter. In the first quarter, sales and profit margin of F&F was
£1383.75 & £232.5 respectively. On the others side, in the third quarter, revenue and margin
accounted for £1602.5 & £395. Thus, increasing trend of sales and profit shows that,
customers give more preference to the services of F&F. In addition to this, high revenue and
profit pattern shows that customers prefer to visit F&F more frequently.
Correlation co-efficient
Sales Profit
Sales 1 0.97
Profit 0.97 1
Paraphrase This Document
Need a fresh take? Get an instant paraphrase of this document with our AI Paraphraser
Interpretation: Outcome of statistical analysis exhibits that highly positive
relationship takes place between sales and profit such as .97. On the basis of such aspect,
both the factors have significant impact on each other and will move in same direction.
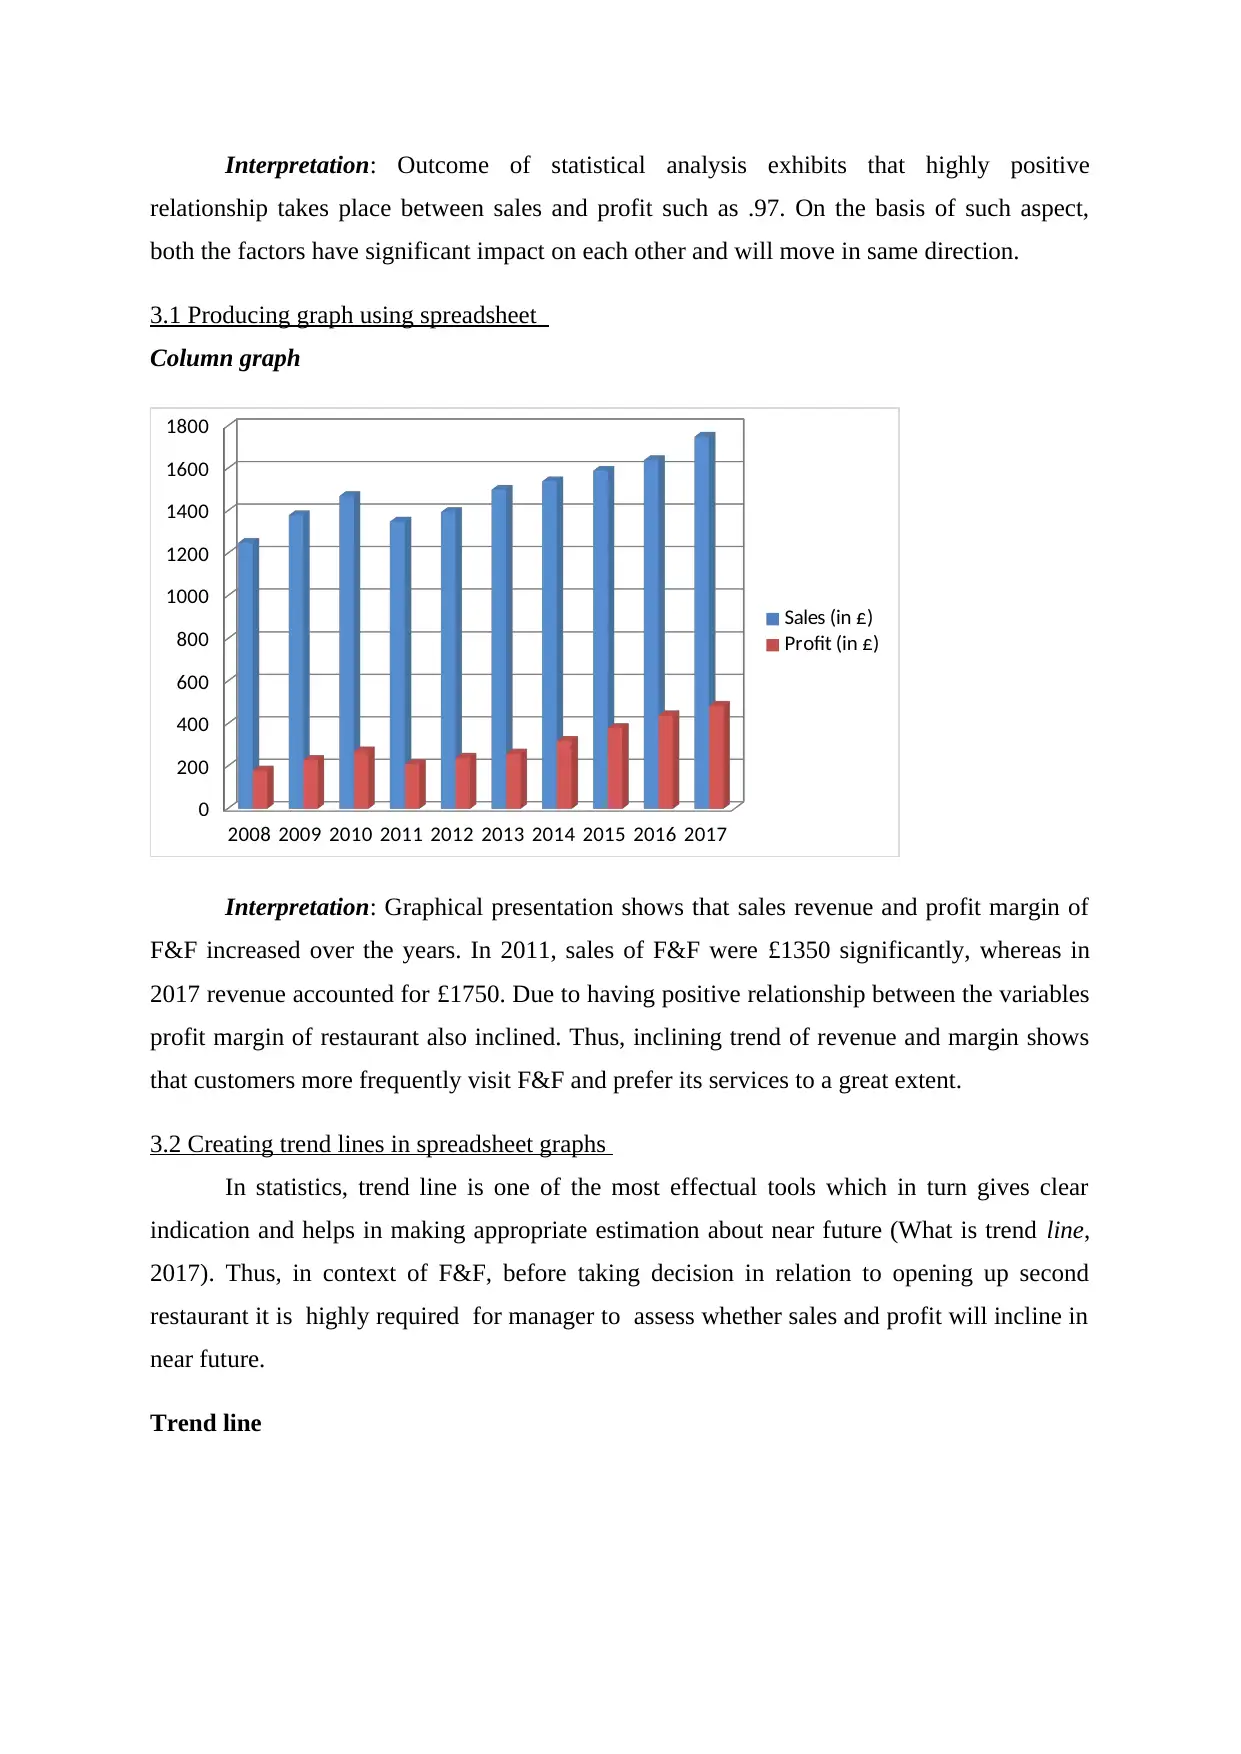
3.1 Producing graph using spreadsheet
Column graph
2008 2009 2010 2011 2012 2013 2014 2015 2016 2017
0
200
400
600
800
1000
1200
1400
1600
1800
Sales (in £)
Profit (in £)
Interpretation: Graphical presentation shows that sales revenue and profit margin of
F&F increased over the years. In 2011, sales of F&F were £1350 significantly, whereas in
2017 revenue accounted for £1750. Due to having positive relationship between the variables
profit margin of restaurant also inclined. Thus, inclining trend of revenue and margin shows
that customers more frequently visit F&F and prefer its services to a great extent.
3.2 Creating trend lines in spreadsheet graphs
In statistics, trend line is one of the most effectual tools which in turn gives clear
indication and helps in making appropriate estimation about near future (What is trend line,
2017). Thus, in context of F&F, before taking decision in relation to opening up second
restaurant it is highly required for manager to assess whether sales and profit will incline in
near future.
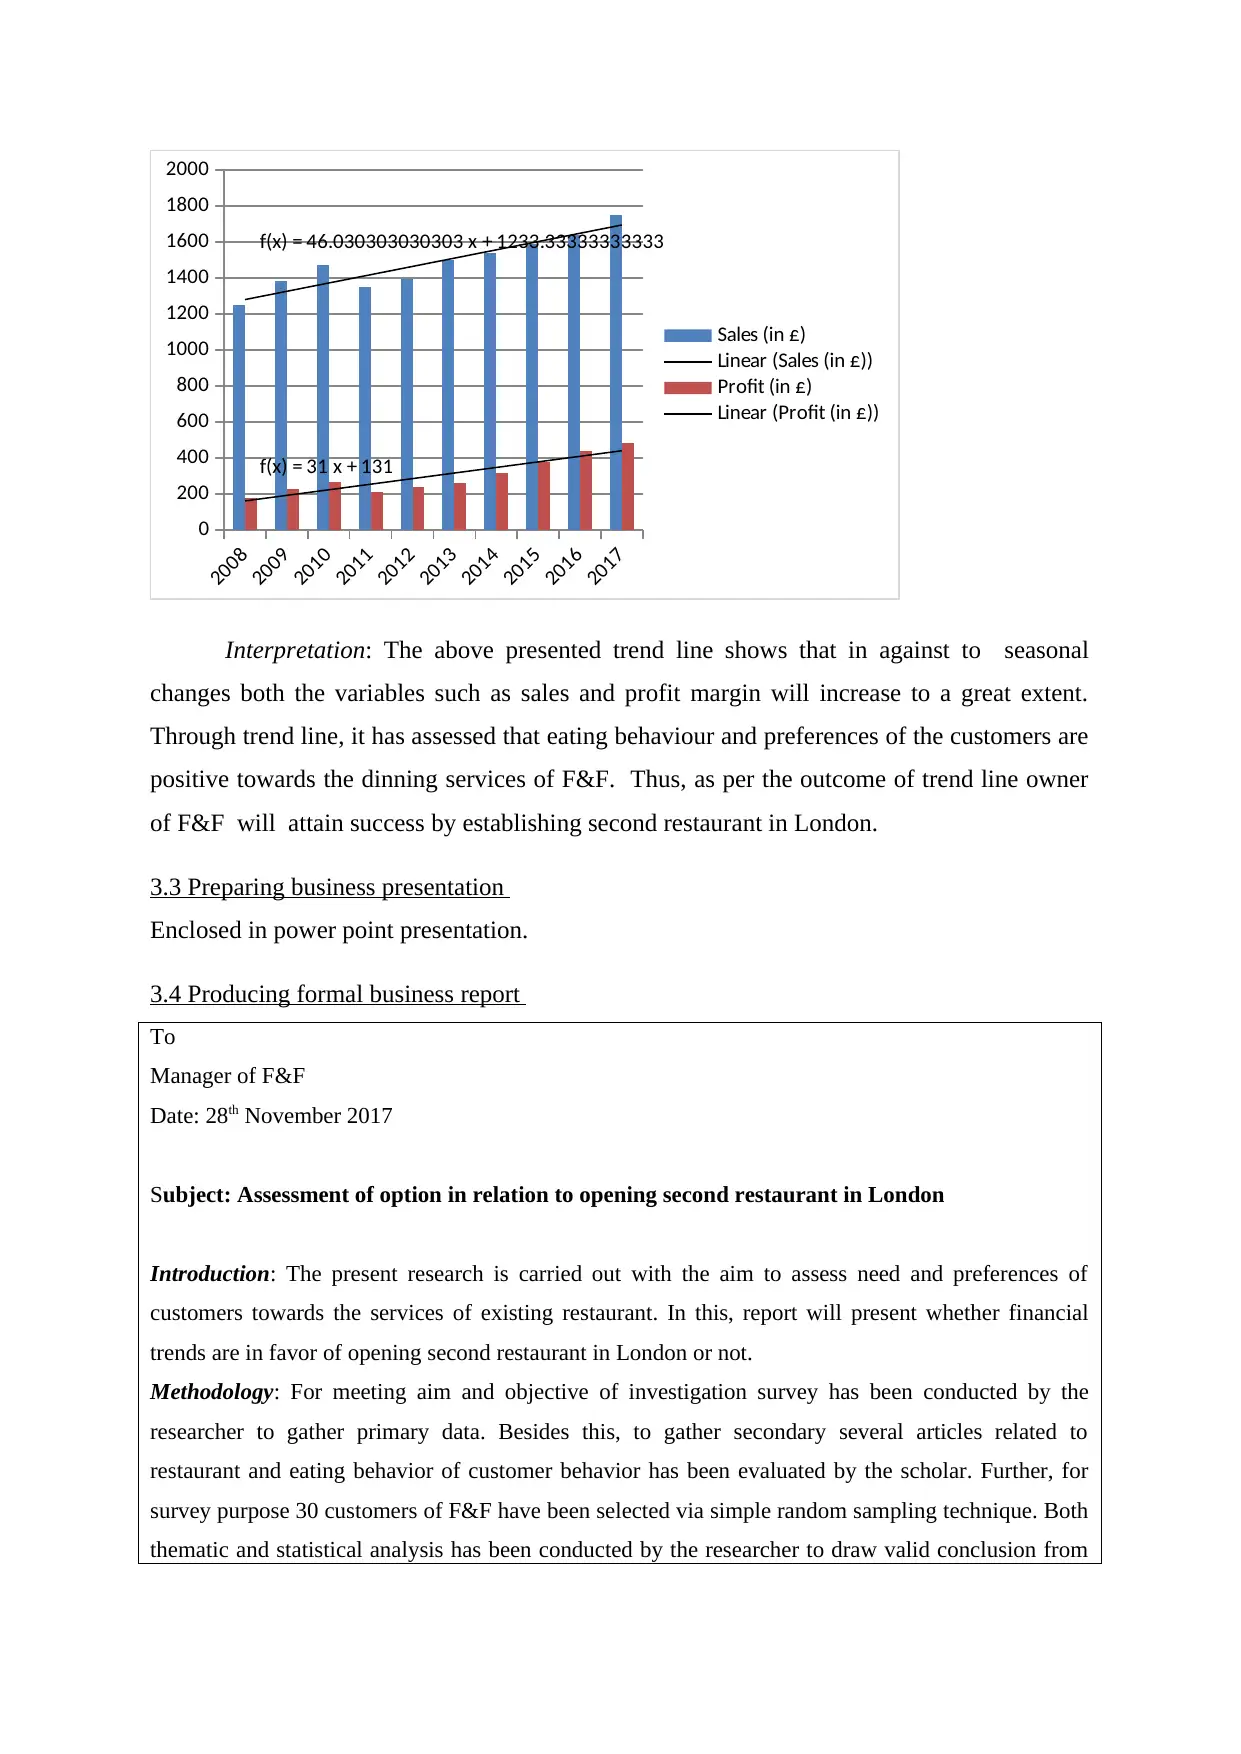
Trend line
relationship takes place between sales and profit such as .97. On the basis of such aspect,
both the factors have significant impact on each other and will move in same direction.
3.1 Producing graph using spreadsheet
Column graph
2008 2009 2010 2011 2012 2013 2014 2015 2016 2017
0
200
400
600
800
1000
1200
1400
1600
1800
Sales (in £)
Profit (in £)
Interpretation: Graphical presentation shows that sales revenue and profit margin of
F&F increased over the years. In 2011, sales of F&F were £1350 significantly, whereas in
2017 revenue accounted for £1750. Due to having positive relationship between the variables
profit margin of restaurant also inclined. Thus, inclining trend of revenue and margin shows
that customers more frequently visit F&F and prefer its services to a great extent.
3.2 Creating trend lines in spreadsheet graphs
In statistics, trend line is one of the most effectual tools which in turn gives clear
indication and helps in making appropriate estimation about near future (What is trend line,
2017). Thus, in context of F&F, before taking decision in relation to opening up second
restaurant it is highly required for manager to assess whether sales and profit will incline in
near future.
Trend line
2008
2009
2010
2011
2012
2013
2014
2015
2016
2017
0
200
400
600
800
1000
1200
1400
1600
1800
2000
f(x) = 46.030303030303 x + 1233.33333333333
f(x) = 31 x + 131
Sales (in £)
Linear (Sales (in £))
Profit (in £)
Linear (Profit (in £))
Interpretation: The above presented trend line shows that in against to seasonal
changes both the variables such as sales and profit margin will increase to a great extent.
Through trend line, it has assessed that eating behaviour and preferences of the customers are
positive towards the dinning services of F&F. Thus, as per the outcome of trend line owner
of F&F will attain success by establishing second restaurant in London.
3.3 Preparing business presentation
Enclosed in power point presentation.
3.4 Producing formal business report
To
Manager of F&F
Date: 28th November 2017
Subject: Assessment of option in relation to opening second restaurant in London
Introduction: The present research is carried out with the aim to assess need and preferences of
customers towards the services of existing restaurant. In this, report will present whether financial
trends are in favor of opening second restaurant in London or not.
Methodology: For meeting aim and objective of investigation survey has been conducted by the
researcher to gather primary data. Besides this, to gather secondary several articles related to
restaurant and eating behavior of customer behavior has been evaluated by the scholar. Further, for
survey purpose 30 customers of F&F have been selected via simple random sampling technique. Both
thematic and statistical analysis has been conducted by the researcher to draw valid conclusion from
⊘ This is a preview!⊘
Do you want full access?
Subscribe today to unlock all pages.
Trusted by 1+ million students worldwide
1 out of 16
Related Documents


Your All-in-One AI-Powered Toolkit for Academic Success.
+13062052269
info@desklib.com
Available 24*7 on WhatsApp / Email
![[object Object]](/_next/static/media/star-bottom.7253800d.svg)
Unlock your academic potential
Copyright © 2020–2026 A2Z Services. All Rights Reserved. Developed and managed by ZUCOL.