HND Business Decision-Making Report: Blackfriars Restaurant Analysis
VerifiedAdded on 2020/06/05
|25
|3737
|376
Report
AI Summary
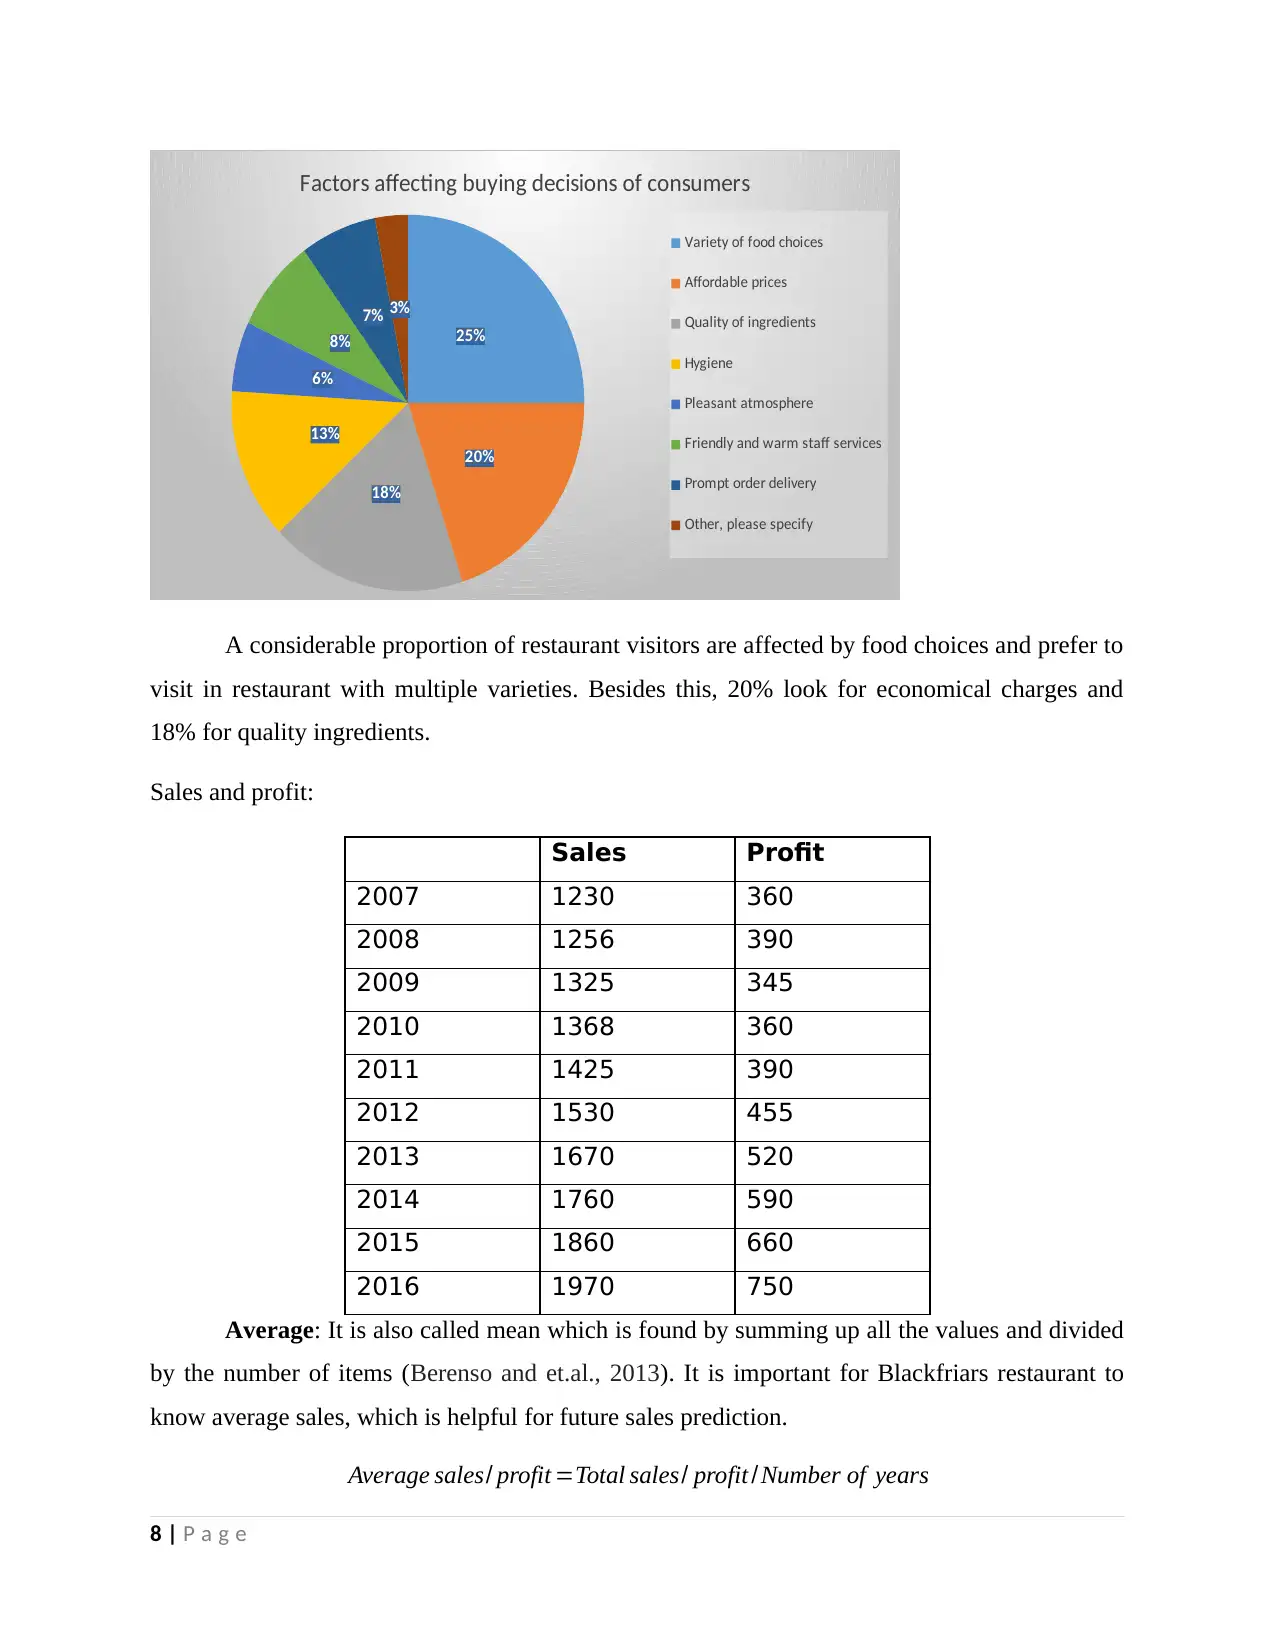
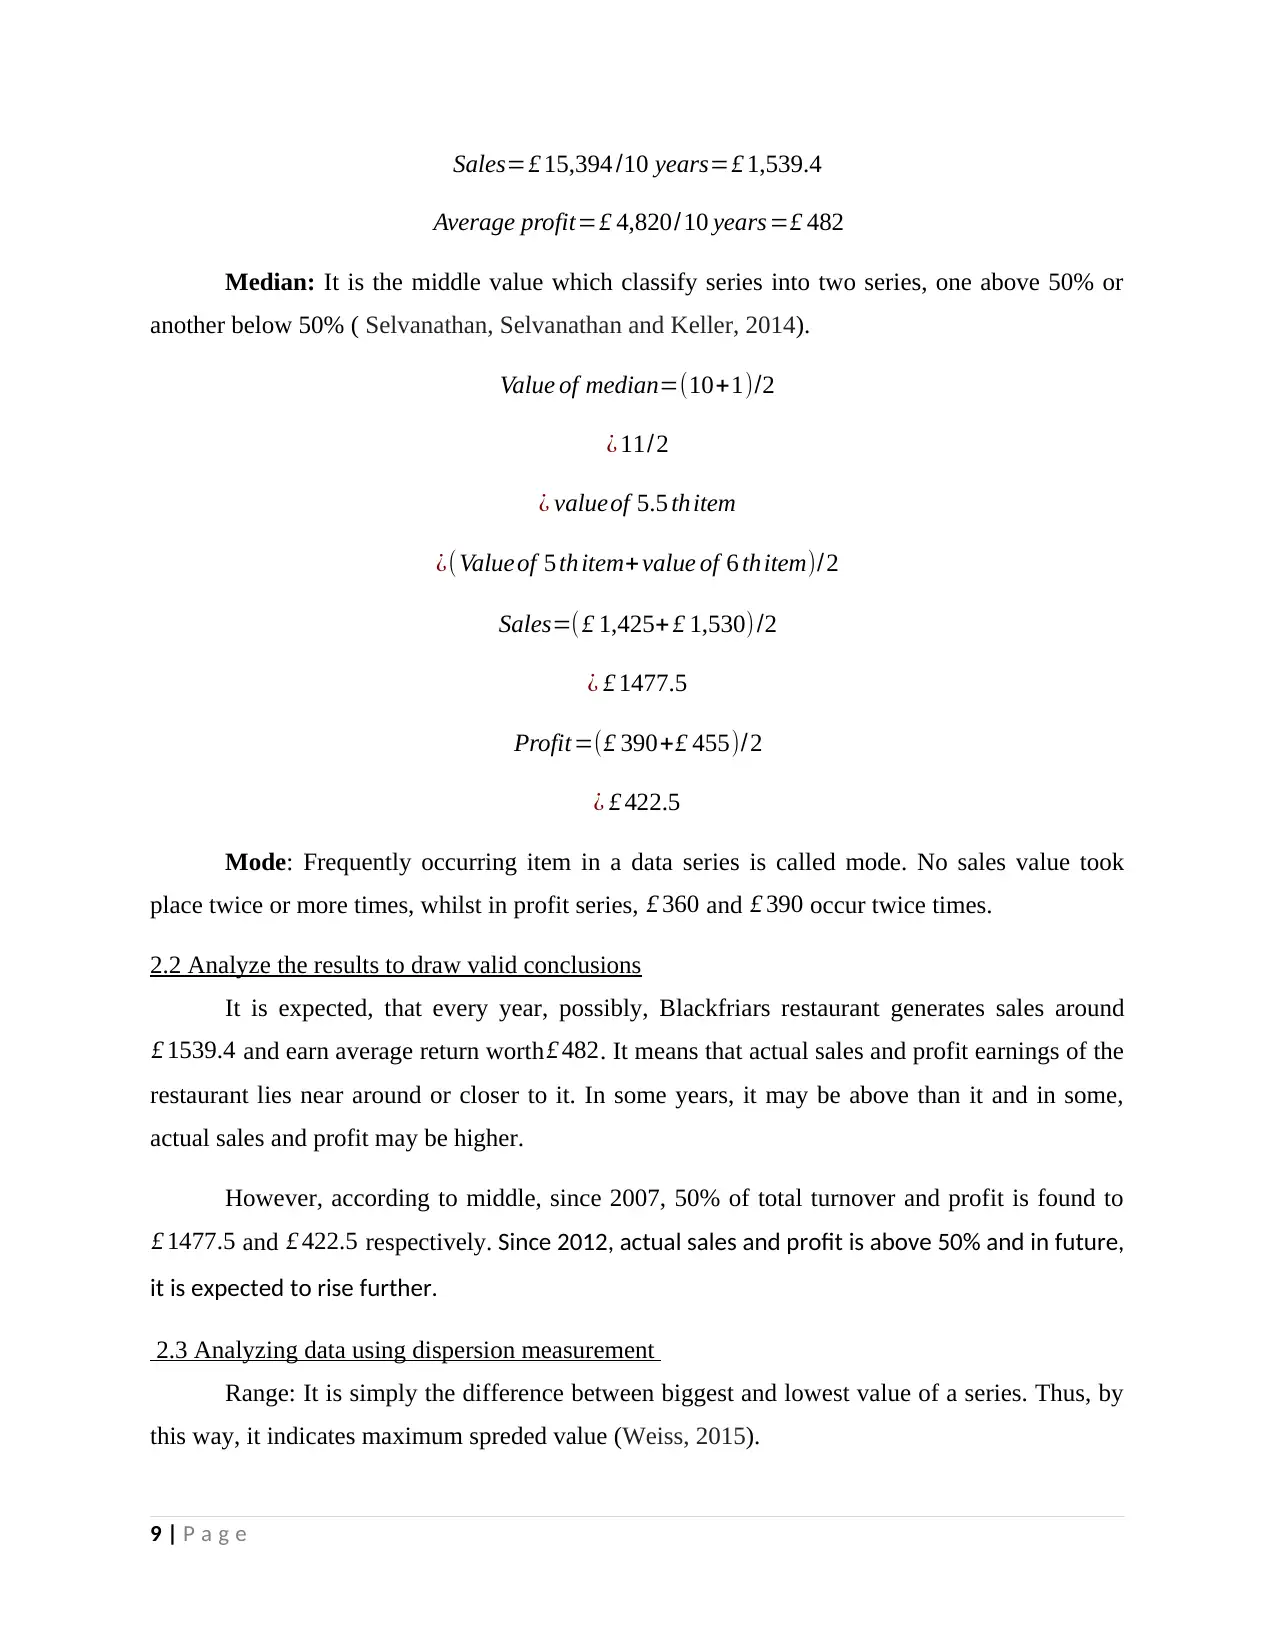
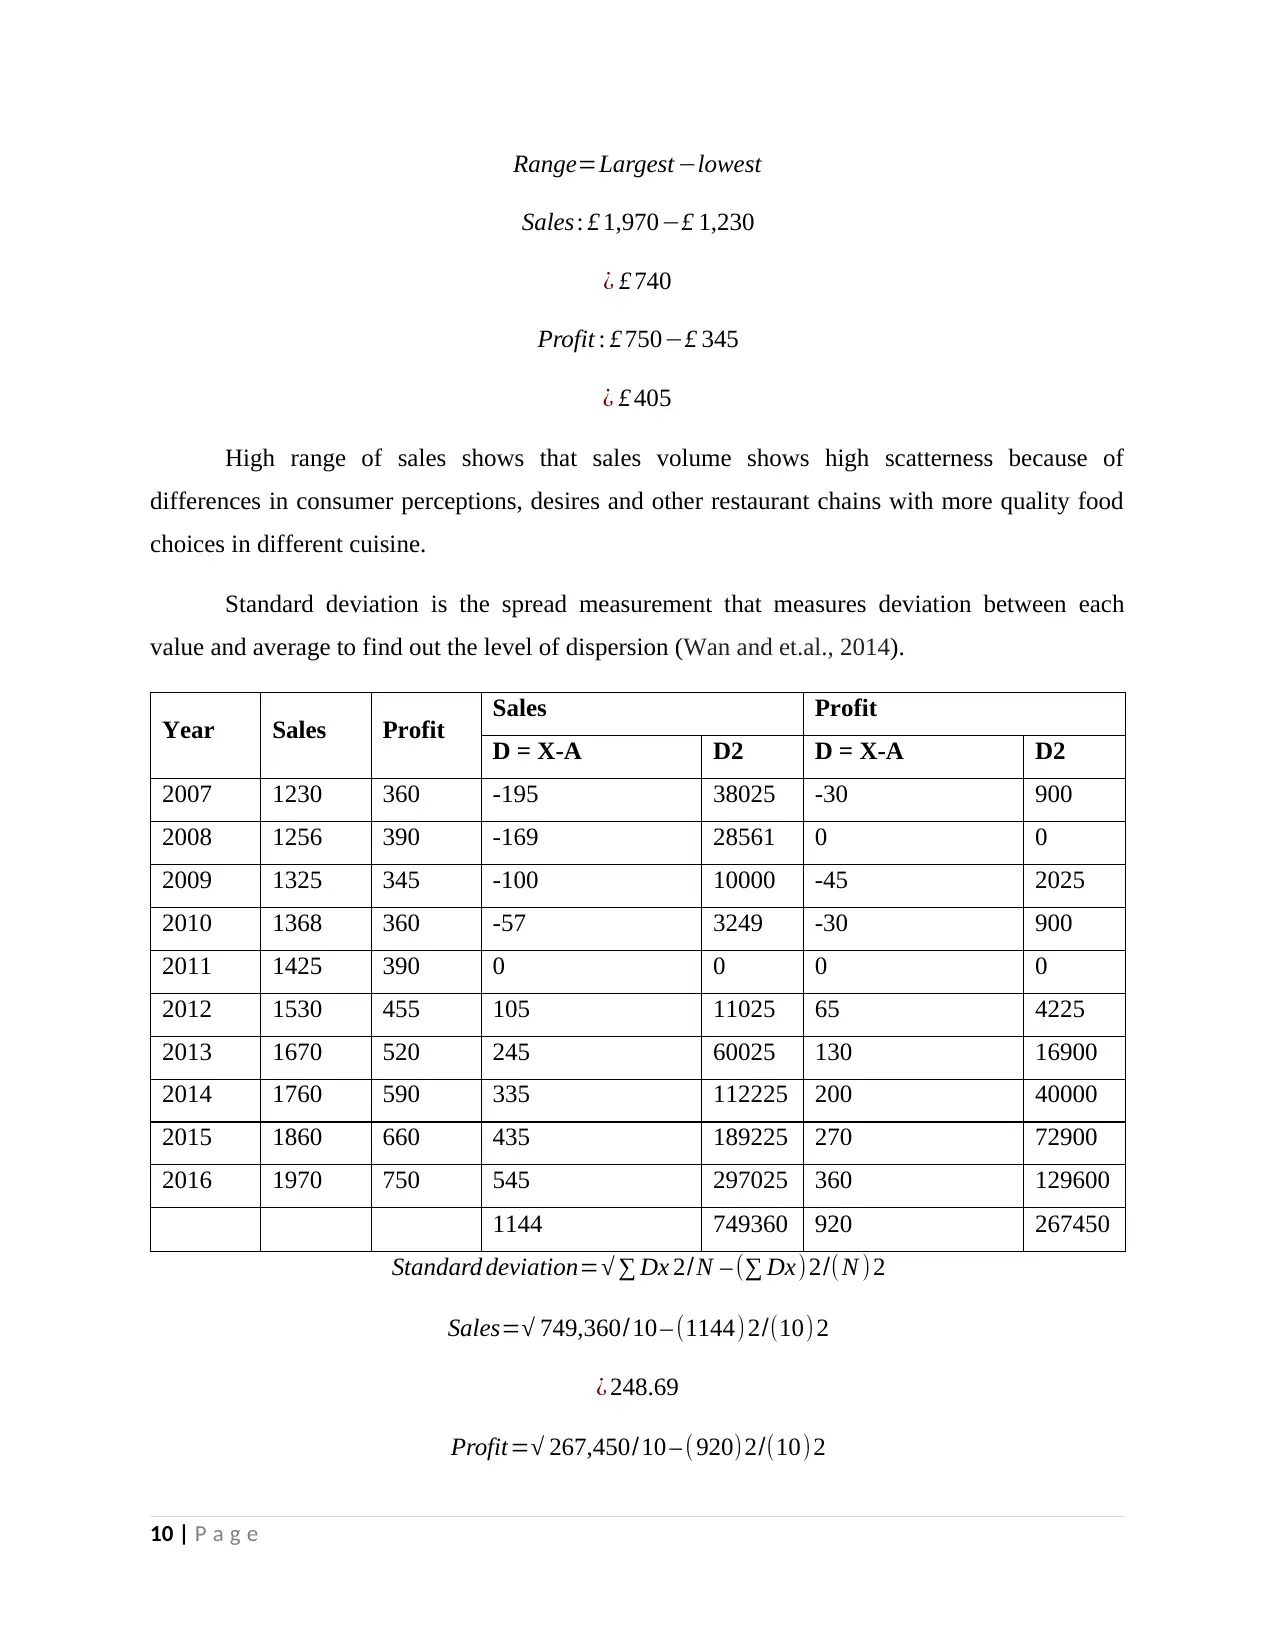
This report focuses on business decision-making within the context of the restaurant industry, specifically for Blackfriars restaurant, aiming to assess market growth and consumer perception for potential expansion. It details the collection of primary and secondary data, including a plan for data gathering, survey methodology, and the design of a questionnaire. The report employs various data analysis techniques, such as summarizing data using representative values (mean, median, mode), analyzing results to draw valid conclusions about consumer preferences, and using dispersion measurements like range and standard deviation. Furthermore, it explains the application of quartiles, percentiles, and correlation coefficients to understand the relationships between sales and profit. The analysis includes the creation of graphs using spreadsheets to derive conclusions and trend lines for forecasting. Finally, the report covers the preparation of a business presentation and a formal business report, alongside the use of project management tools and financial tools for informed decision-making, ultimately providing a comprehensive framework for strategic planning and business expansion within the competitive UK restaurant sector. The assignment includes the design of a questionnaire and statistical analysis of data to make business decisions.

BUSINESS DECISION-MAKING
Paraphrase This Document
Need a fresh take? Get an instant paraphrase of this document with our AI Paraphraser

Table of Contents
INTRODUCTION...........................................................................................................................1
TASK 1............................................................................................................................................1
1.1 Creating plan for collection of primary and secondary dataset.............................................1
1.2 Presenting survey methodology and sampling frame............................................................2
1.3 Designing a questionnaire for the chosen problem................................................................2
TASK 2............................................................................................................................................5
2.1 Summarizing data using representative values......................................................................5
Theme: 1......................................................................................................................................5
2.2 Analyze the results to draw valid conclusions.......................................................................9
2.3 Analyzing data using dispersion measurement......................................................................9
2.4 Explaining the use of quartile, percentile and correlation coefficient.................................11
TASK 3..........................................................................................................................................13
3.1 Producing graphs using spreadsheets to draw valid conclusions.........................................13
3.2 Creating trend line in spreadsheet to assist in forecasting...................................................16
3.3 Preparing a business presentation using suitable software to disseminate information......17
3.4 Producing a formal business report......................................................................................17
TASK 4..........................................................................................................................................17
4.1 Using appropriate tool of information processing...............................................................17
4.2 Prepare a project plan to determine the critical path............................................................18
4.3 Using financial tool for decision making.............................................................................19
CONCLUSION..............................................................................................................................21
REFERENCES..............................................................................................................................22

INTRODUCTION
UK is a leading nation in restaurant sector with strong growth underpinned by changing
consumer trends and demographics. People now prefers to eat out frequently and spending
increasing amount on eating out. Although the industry is growing rapidly, still, at the same time,
market environment for the restaurant operators become challenging. Blackfriars restaurant is
one of the pioneering British restaurant opened in 2001 by a couple, Sam Hook and Andy. With
the wonderful growth, it had planned to open a second branch in London. Thus, the report aims
at collecting necessary data source to assess market growth and consumer perception so that a
new unit can be established successfully. In addition, tools like spreadsheet, project management
and investment appraisal will be used for the analysis.
TASK 1
1.1 Creating plan for collection of primary and secondary dataset
Blackfriars restaurant is looking for expanding its geographical presence through opening
one more branch in London. Thus, restaurant owner needs to know consumer perceptions,
behavior and other important information by collecting needed data from different sources. Data
collection is a process whereby necessary information about essential or factors can be obtained.
Primary data: It is a method which generates data through an original research.
Questionnaire, online survey, social media, observation, survey via mobile apps are the popular
methods used for it (Gigerenzer and Gaissmaier, 2011). Looking to tough and competitive
challenges prevailing in UK restaurant sector, surveying people to know their preferences,
perception and behavior is the best way for Blackfriars restaurant.
Secondary data: Such information is already collected by a person other than the scholar
who is doing current study. It is indispensable for most of the real research studies. Books,
census data, case studies, governmental publications etc. are the most useful source of secondary
data collection. Although, it is an economical way of data collection, still, it may be biased. For
the given case, sales and profit figures of Blackfriars restaurant will be generated using
secondary survey methods.
1 | P a g e
⊘ This is a preview!⊘
Do you want full access?
Subscribe today to unlock all pages.

Trusted by 1+ million students worldwide

1.2 Presenting survey methodology and sampling frame
Blackfriars restaurant want to know the actual eating behavior, perception and feelings of
the consumers who prefers to take dinner out frequently. Therefore, all the people visiting
restaurants are the target audience. However, in London, there are a significant proportion of
people eating out. Therefore, a sample size of 100 people chosen randomly will be used for the
purpose of the current study. Random sampling is used to take out a sub set of 100 people from
the universe. Such randomly chosen sample will used to draw required source of material. The
reason behind selecting such method is, it is a biasfree method that does not discriminate
different units and every unit has a same possibility of being a part of the survey (Berenso and
et.al., 2013). It will be carry out via the use of questionnaire and in order to assure high response
rate as well as data authenticity, reliability and validity aspect, all the people selected for the
survey will be invited to take part in the survey voluntarily.
1.3 Designing a questionnaire for the chosen problem
This is a method wherein multiple of questions is asked from the target people keeping
into mind the key aim of the research to collect relevant data set and draw useful information
about the universe.
QUESTIONNAIRE
Name: ________________
Email address:__________
Demographic information
Q:1 What is your gender?
Male
Female
Q:2. What is your current age in years?
Less than 15 years
16 – 25 years
26 – 35 years
36 years – 45 years
Above 45 years
Q:3. What is your nationality?
2 | P a g e
Paraphrase This Document
Need a fresh take? Get an instant paraphrase of this document with our AI Paraphraser

Indian
British
Italian
Q: 4. How much do you earn per month?
____________
Restaurant-specific information
Q:1. Frequency of visiting in a restaurant for lunch and/or dinner?
Once a week
Once a fortnight
Once a month
Less than once a month
More than once a week
I don’t take meal out
Q:2 What is the key reason for visiting to restaurant?
To enjoy with friends, relatives and others
To eat quality food
To eat something unique food items
To celebrate special occasions
Unspecified situation i.e. office parties
Others, please specify
Q:3. With whom, you often go restaurant?
Friends
Alone
Family members
Colleagues
Business partner
No matters
Q:4. Which factor is most likely to attract you to visit a restaurant unit?
Variety of food choices
Affordable prices
Quality of ingredients
3 | P a g e

Hygiene
Pleasant atmosphere
Friendly and warm staff services
Prompt order delivery
Other, please specify
Q:5. How long you would be able to visit a new restaurant?
0 – 10 miles
11 – 20 miles
21 – 30 miles
31 – 40 miles
41 – 50 miles
More than 50 miles
Q:6. How well do you agree and disagree with the services offered by Blackfriars restaurant?
Food Quality Strongly
Disagree
Somewhat
disagree
Neutral Somewhat
agree
Strongly
agree
Food served is hot and fresh o o o o o
Menu offers a variety of
choices
o o o o o
Food quality offered by us is
excellent
o o o o o
Food served is flavorful,
healthier and tasty
o o o o o
Q:7. Do our staff are friendly and courteous?
Yes
No
Q:8. How much do you spend per visit on restaurant each person?
Below £15
£16 - £30
£31 - £45
£46 - £60
More than £60
4 | P a g e
⊘ This is a preview!⊘
Do you want full access?
Subscribe today to unlock all pages.

Trusted by 1+ million students worldwide

Q:9. How do you think about the value of the prices charged for the food menu?
Value Strongly
Disagree
Somewhat
disagree
Neutral Somewhat
agree
Strongly
agree
Food offered is a great value
for British pound
o o o o o
Prices charged are
competitive
o o o o o
Q:10. Suggest us how to serve you better?
____________________________________________________________________
TASK 2
2.1 Summarizing data using representative values
Theme: 1.
Number of respondents
Once a week 12
Once a fortnight 24
Once a month 36
Less than once a month 9
More than once a week 14
I don’t take meal out 5
100
5 | P a g e
Paraphrase This Document
Need a fresh take? Get an instant paraphrase of this document with our AI Paraphraser

12%
24%
36%
9%
14%
5%
Frequency of visiting to a restaurant
Once a week
Once a fortnight
Once a month
Less than once a month
More than once a week
I don’t take meal out
The result shows that (36%) consumers are extremely preferring visiting restaurant at-
least once a month. Moreover, a significant proportion of surveyed audience (12%) visit
restaurant once a fortnight means twice a month. However, 14% people visit frequently 2-3 times
a week, thus, the result clearly shows growing demand for restaurant industry.
Theme: 2.
Number of respondents
To enjoy with friends, relatives and others 22
To eat quality food 36
To eat something unique food items 15
To celebrate special occasions 12
Unspecified situation i.e. office parties 9
Others, please specify 6
100
6 | P a g e

22%
36%
15%
12%
9% 6%
Purpose of visiting to a restaurant
To enjoy with friends, relatives and
others
To eat quality food
To eat something unique food items
To celebrate special occasions
Unspecified situation i.e. office
parties
Others, please specify
Major proportion of people, in the survey, 36% visit restaurant to enjoy tastier, healthier
and quality food items and 22% visit to enjoy with others.
Theme: 3.
Number of respondents
Variety of food choices 25
Affordable prices 20
Quality of ingredients 18
Hygiene 13
Pleasant atmosphere 6
Friendly and warm staff services 8
Prompt order delivery 7
Other, please specify 3
100
7 | P a g e
⊘ This is a preview!⊘
Do you want full access?
Subscribe today to unlock all pages.

Trusted by 1+ million students worldwide

25%
20%
18%
13%
6%
8%
7% 3%
Factors affecting buying decisions of consumers
Variety of food choices
Affordable prices
Quality of ingredients
Hygiene
Pleasant atmosphere
Friendly and warm staff services
Prompt order delivery
Other, please specify
A considerable proportion of restaurant visitors are affected by food choices and prefer to
visit in restaurant with multiple varieties. Besides this, 20% look for economical charges and
18% for quality ingredients.
Sales and profit:
Sales Profit
2007 1230 360
2008 1256 390
2009 1325 345
2010 1368 360
2011 1425 390
2012 1530 455
2013 1670 520
2014 1760 590
2015 1860 660
2016 1970 750
Average: It is also called mean which is found by summing up all the values and divided
by the number of items (Berenso and et.al., 2013). It is important for Blackfriars restaurant to
know average sales, which is helpful for future sales prediction.
Average sales/ profit =Total sales/ profit /Number of years
8 | P a g e
Paraphrase This Document
Need a fresh take? Get an instant paraphrase of this document with our AI Paraphraser

Sales=£ 15,394 /10 years=£ 1,539.4
Average profit=£ 4,820/10 years=£ 482
Median: It is the middle value which classify series into two series, one above 50% or
another below 50% ( Selvanathan, Selvanathan and Keller, 2014).
Value of median=(10+1)/2
¿ 11/2
¿ valueof 5.5 thitem
¿( Valueof 5 th item+ value of 6 thitem)/2
Sales=(£ 1,425+ £ 1,530) /2
¿ £ 1477.5
Profit=(£ 390+£ 455)/2
¿ £ 422.5
Mode: Frequently occurring item in a data series is called mode. No sales value took
place twice or more times, whilst in profit series, £ 360 and £ 390 occur twice times.
2.2 Analyze the results to draw valid conclusions
It is expected, that every year, possibly, Blackfriars restaurant generates sales around
£ 1539.4 and earn average return worth £ 482. It means that actual sales and profit earnings of the
restaurant lies near around or closer to it. In some years, it may be above than it and in some,
actual sales and profit may be higher.
However, according to middle, since 2007, 50% of total turnover and profit is found to
£ 1477.5 and £ 422.5 respectively. Since 2012, actual sales and profit is above 50% and in future,
it is expected to rise further.
2.3 Analyzing data using dispersion measurement
Range: It is simply the difference between biggest and lowest value of a series. Thus, by
this way, it indicates maximum spreded value (Weiss, 2015).
9 | P a g e

Range=Largest −lowest
Sales: £ 1,970−£ 1,230
¿ £ 740
Profit : £ 750−£ 345
¿ £ 405
High range of sales shows that sales volume shows high scatterness because of
differences in consumer perceptions, desires and other restaurant chains with more quality food
choices in different cuisine.
Standard deviation is the spread measurement that measures deviation between each
value and average to find out the level of dispersion (Wan and et.al., 2014).
Year Sales Profit Sales Profit
D = X-A D2 D = X-A D2
2007 1230 360 -195 38025 -30 900
2008 1256 390 -169 28561 0 0
2009 1325 345 -100 10000 -45 2025
2010 1368 360 -57 3249 -30 900
2011 1425 390 0 0 0 0
2012 1530 455 105 11025 65 4225
2013 1670 520 245 60025 130 16900
2014 1760 590 335 112225 200 40000
2015 1860 660 435 189225 270 72900
2016 1970 750 545 297025 360 129600
1144 749360 920 267450
Standard deviation=√ ∑ Dx 2/N – (∑ Dx)2/( N ) 2
Sales=√ 749,360/10 – (1144) 2/(10) 2
¿ 248.69
Profit=√ 267,450/10 – ( 920)2/(10)2
10 | P a g e
⊘ This is a preview!⊘
Do you want full access?
Subscribe today to unlock all pages.

Trusted by 1+ million students worldwide
1 out of 25
Related Documents

Your All-in-One AI-Powered Toolkit for Academic Success.
+13062052269
info@desklib.com
Available 24*7 on WhatsApp / Email
Unlock your academic potential
Copyright © 2020–2025 A2Z Services. All Rights Reserved. Developed and managed by ZUCOL.