Business Decision-Making Report: Online Shopping Impact Analysis
VerifiedAdded on 2021/06/15
|38
|5876
|24
Report
AI Summary
This report analyzes the impact of online shopping on high street malls and shops. It begins with a survey plan, detailing data collection methods and questionnaire design. Task 2 focuses on data summarization and analysis, employing measures of central tendency, dispersion, and correlation to interpret survey results on customer preferences and behaviors. The analysis covers gender, age group, product preferences, and platform usage. Task 3 presents findings through graphs, trend lines, and a formal report. Finally, Task 4 explores software-generated information, including management systems (TPS, MIS, DSS), network diagrams, critical paths, and financial tools like NPV and IRR to support business decision-making. The report aims to provide insights for retail businesses to adapt to the changing landscape of online shopping.
Running head: BUSINESS DECISION-MAKING
Business Decision-Making
Name of the Student:
Name of the University:
Author’s Note:
Course ID:
Business Decision-Making
Name of the Student:
Name of the University:
Author’s Note:
Course ID:
Paraphrase This Document
Need a fresh take? Get an instant paraphrase of this document with our AI Paraphraser
1BUSINESS DECISION-MAKING
Table of Contents
Introduction:....................................................................................................................................3
Task 1: Planning the survey.............................................................................................................4
a) Data collection plan:................................................................................................................4
b) Survey methodology and sampling frame used:.....................................................................5
c) Questionnaire for data collection:............................................................................................6
Task 2: Summarisation and analysis of data....................................................................................9
a) Analysis using measures of central tendency:.........................................................................9
b) Analysis of the survey results:...............................................................................................10
c) Analysis using measures of dispersion:.................................................................................16
d) Use of percentiles, quartiles and correlation coefficient to draw useful conclusion:............17
Task 3: Presentation and reporting of findings..............................................................................18
a) Use of graphs for making valid survey conclusion:..............................................................18
b) Trend lines in spreadsheet graphs for showing the level of impact over three-year period:.21
c) Poster presentation:................................................................................................................23
d) Formal report for publication:...............................................................................................24
Task 4: Software-generated information to make business decisions...........................................24
a) Characteristics and role of various management systems in a business:...............................24
i/ Transaction processing systems (TPS):..............................................................................24
2BUSINESS DECISION-MAKING
ii. Management information systems (MIS):.........................................................................25
iii. Decision support systems (DSS):.....................................................................................26
b) Network diagram and critical path:.......................................................................................27
c) Financial tools for decision-making:.....................................................................................29
d) Net present value (NPV) of the project:................................................................................29
e) Internal rate of return (IRR) of the project:...........................................................................30
Conclusion:....................................................................................................................................30
References:....................................................................................................................................32
⊘ This is a preview!⊘
Do you want full access?
Subscribe today to unlock all pages.
Trusted by 1+ million students worldwide
3BUSINESS DECISION-MAKING
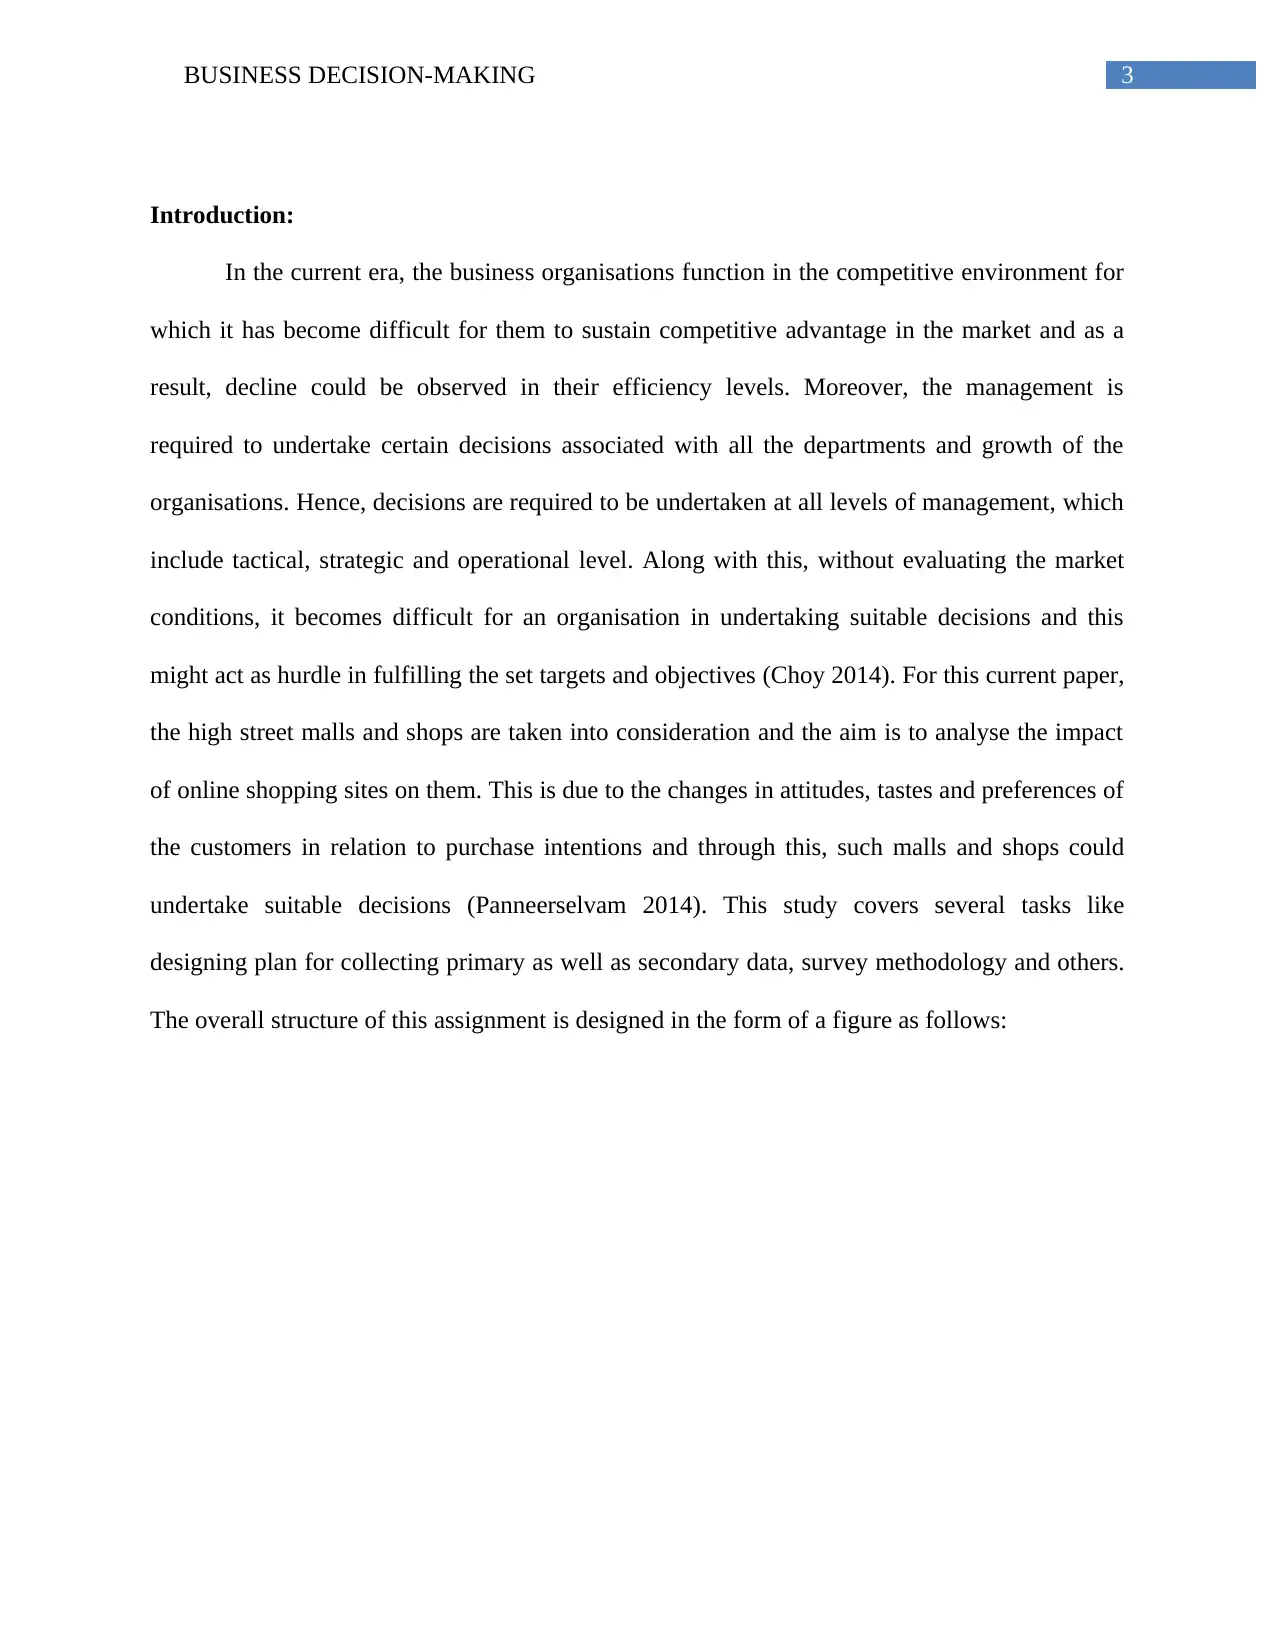
Introduction:
In the current era, the business organisations function in the competitive environment for
which it has become difficult for them to sustain competitive advantage in the market and as a
result, decline could be observed in their efficiency levels. Moreover, the management is
required to undertake certain decisions associated with all the departments and growth of the
organisations. Hence, decisions are required to be undertaken at all levels of management, which
include tactical, strategic and operational level. Along with this, without evaluating the market
conditions, it becomes difficult for an organisation in undertaking suitable decisions and this
might act as hurdle in fulfilling the set targets and objectives (Choy 2014). For this current paper,
the high street malls and shops are taken into consideration and the aim is to analyse the impact
of online shopping sites on them. This is due to the changes in attitudes, tastes and preferences of
the customers in relation to purchase intentions and through this, such malls and shops could
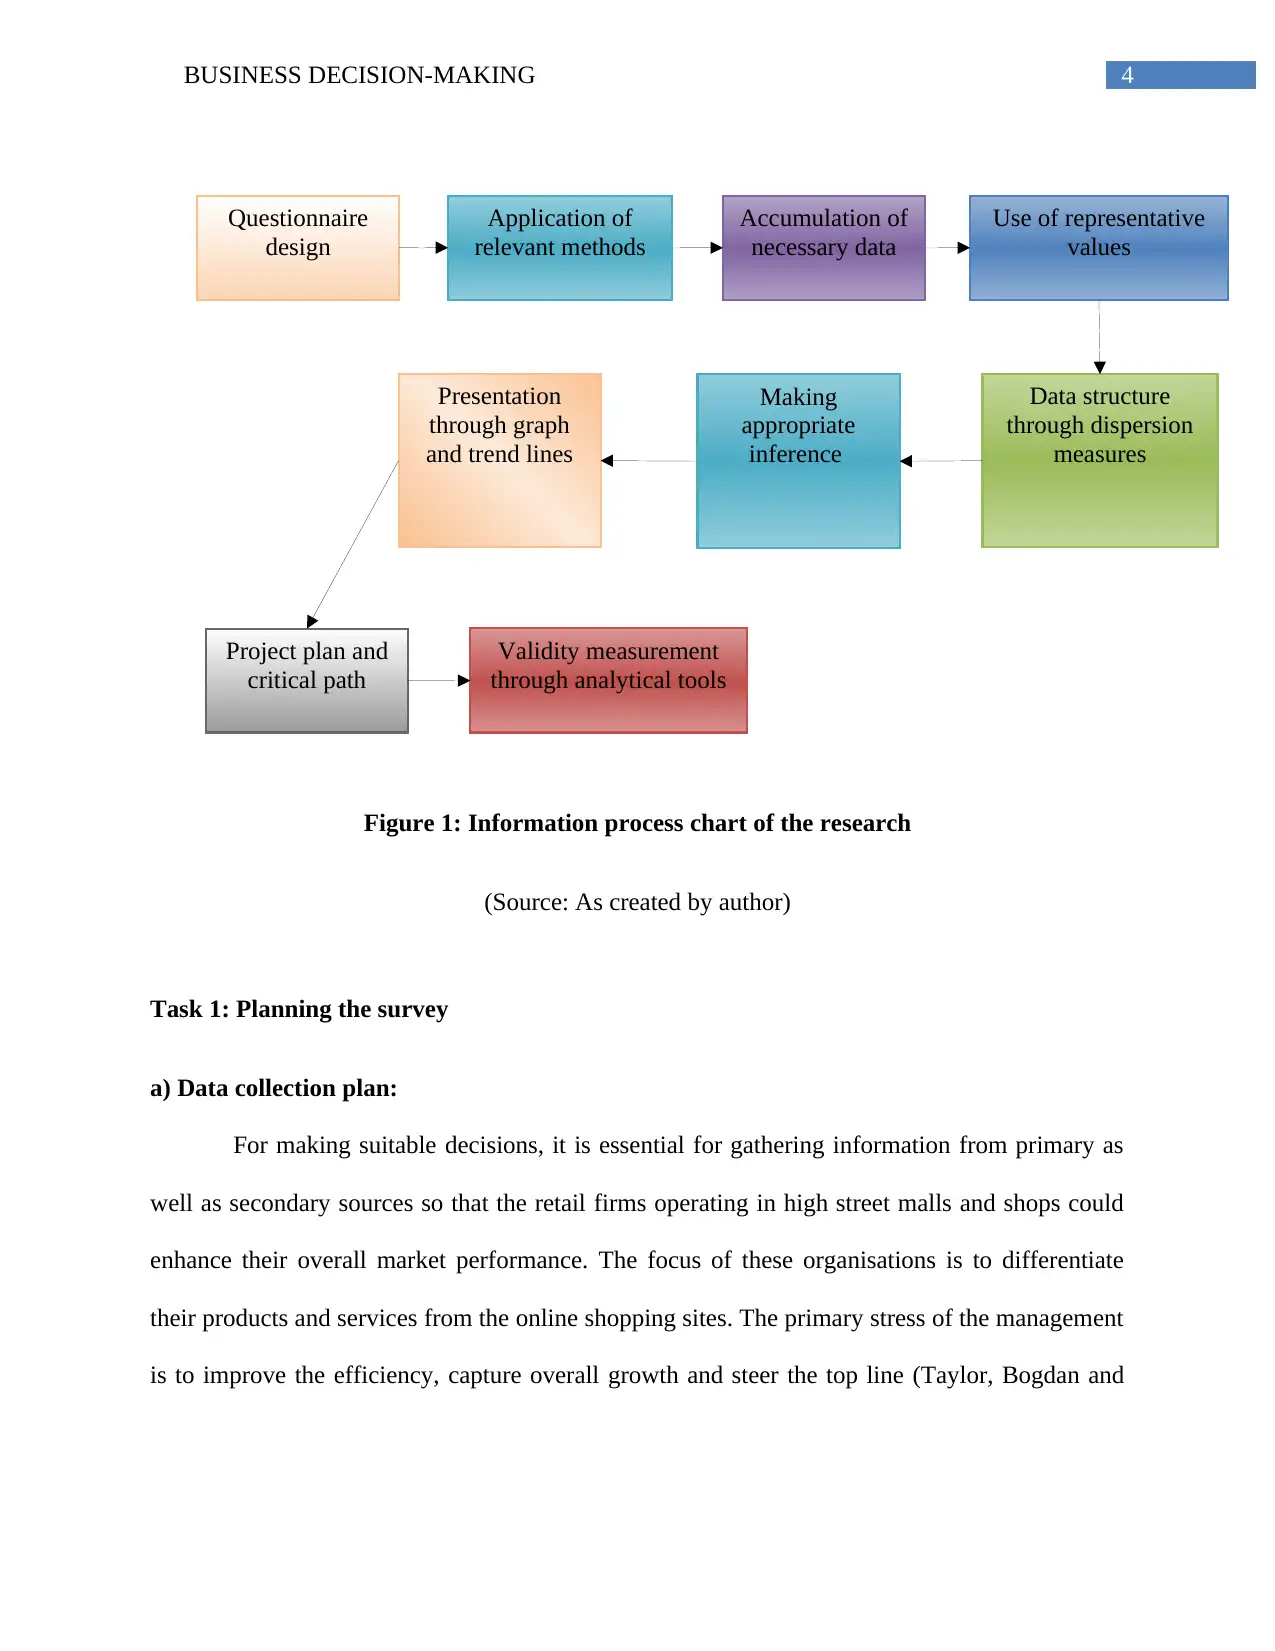
undertake suitable decisions (Panneerselvam 2014). This study covers several tasks like
designing plan for collecting primary as well as secondary data, survey methodology and others.
The overall structure of this assignment is designed in the form of a figure as follows:
Introduction:
In the current era, the business organisations function in the competitive environment for
which it has become difficult for them to sustain competitive advantage in the market and as a
result, decline could be observed in their efficiency levels. Moreover, the management is
required to undertake certain decisions associated with all the departments and growth of the
organisations. Hence, decisions are required to be undertaken at all levels of management, which
include tactical, strategic and operational level. Along with this, without evaluating the market
conditions, it becomes difficult for an organisation in undertaking suitable decisions and this
might act as hurdle in fulfilling the set targets and objectives (Choy 2014). For this current paper,
the high street malls and shops are taken into consideration and the aim is to analyse the impact
of online shopping sites on them. This is due to the changes in attitudes, tastes and preferences of
the customers in relation to purchase intentions and through this, such malls and shops could
undertake suitable decisions (Panneerselvam 2014). This study covers several tasks like
designing plan for collecting primary as well as secondary data, survey methodology and others.
The overall structure of this assignment is designed in the form of a figure as follows:
Paraphrase This Document
Need a fresh take? Get an instant paraphrase of this document with our AI Paraphraser
Questionnaire
design
Application of
relevant methods
Accumulation of
necessary data
Use of representative
values
Presentation
through graph
and trend lines
Making
appropriate
inference
Data structure
through dispersion
measures
Project plan and
critical path
Validity measurement
through analytical tools
4BUSINESS DECISION-MAKING
Figure 1: Information process chart of the research
(Source: As created by author)
Task 1: Planning the survey
a) Data collection plan:
For making suitable decisions, it is essential for gathering information from primary as
well as secondary sources so that the retail firms operating in high street malls and shops could
enhance their overall market performance. The focus of these organisations is to differentiate
their products and services from the online shopping sites. The primary stress of the management
is to improve the efficiency, capture overall growth and steer the top line (Taylor, Bogdan and
5BUSINESS DECISION-MAKING
DeVault 2015). Hence, by considering primary as well as secondary data, the organisations could
understand the customer perceptions regarding their shopping behaviours.
Plan for collection of primary data:
In order to gather primary data, the online survey technique has been taken into account
and well-structured and close-ended questionnaire has been designed. This would help in
understanding the attitudes and tastes of the customers towards their purchasing intentions from
the online platforms. The researcher has framed 10 questions including age and gender group of
the participants and Likert scale has been used for conducting the overall research. Due to all
these primary reasons, the accumulation of primary data is considered highly effective and this
would lead to the achievement of intended objectives and targets (Mackey and Gass 2015).
Plan for collection of secondary data:
In order to gather secondary information, references are made from the published books,
journals and statistical websites. Moreover, the industry reports are taken into consideration as
well to identify the trends of the customers towards online shopping (Flick 2015). All such
information accumulated would help the retail stores to undertake effective decisions so that
their sales revenues are increased in the market.
b) Survey methodology and sampling frame used:
Survey methodology:
In order to carry out the survey effectively, the campus students from various colleges
and universities of UK are taken into consideration. The primary goal of conducting this survey
is to ascertain the attitudes, behaviours and preferences of the customers towards online shopping
⊘ This is a preview!⊘
Do you want full access?
Subscribe today to unlock all pages.
Trusted by 1+ million students worldwide
6BUSINESS DECISION-MAKING
in contrast to the retail shops operating in UK (Silverman 2016). Along with this, in order to
carry out online survey, the students of UK are contacted via e-mail with the designed set of
questions. Hence, with the help of this survey methodology, it is possible to collect suitable
primary information which could support in meeting the objective of the research as well
(Vaioleti 2016).
Sampling frame:
Sampling frame is related to choosing the sample size from which the data needs to be
accumulated. In order to collect information, probability sampling in the form of simple random
sampling has been used, in which every student has the equal opportunity of being chosen in
order to provide information regarding their choice of platforms for purchasing products
(Ledford and Gast 2018). The sample size of 30 students has been chosen irrespective of all ages.
Hence, by considering the students of various campuses in UK, exact and up-to-date information
could be gathered through which suitable business decisions could be undertaken (Humphries
2017).
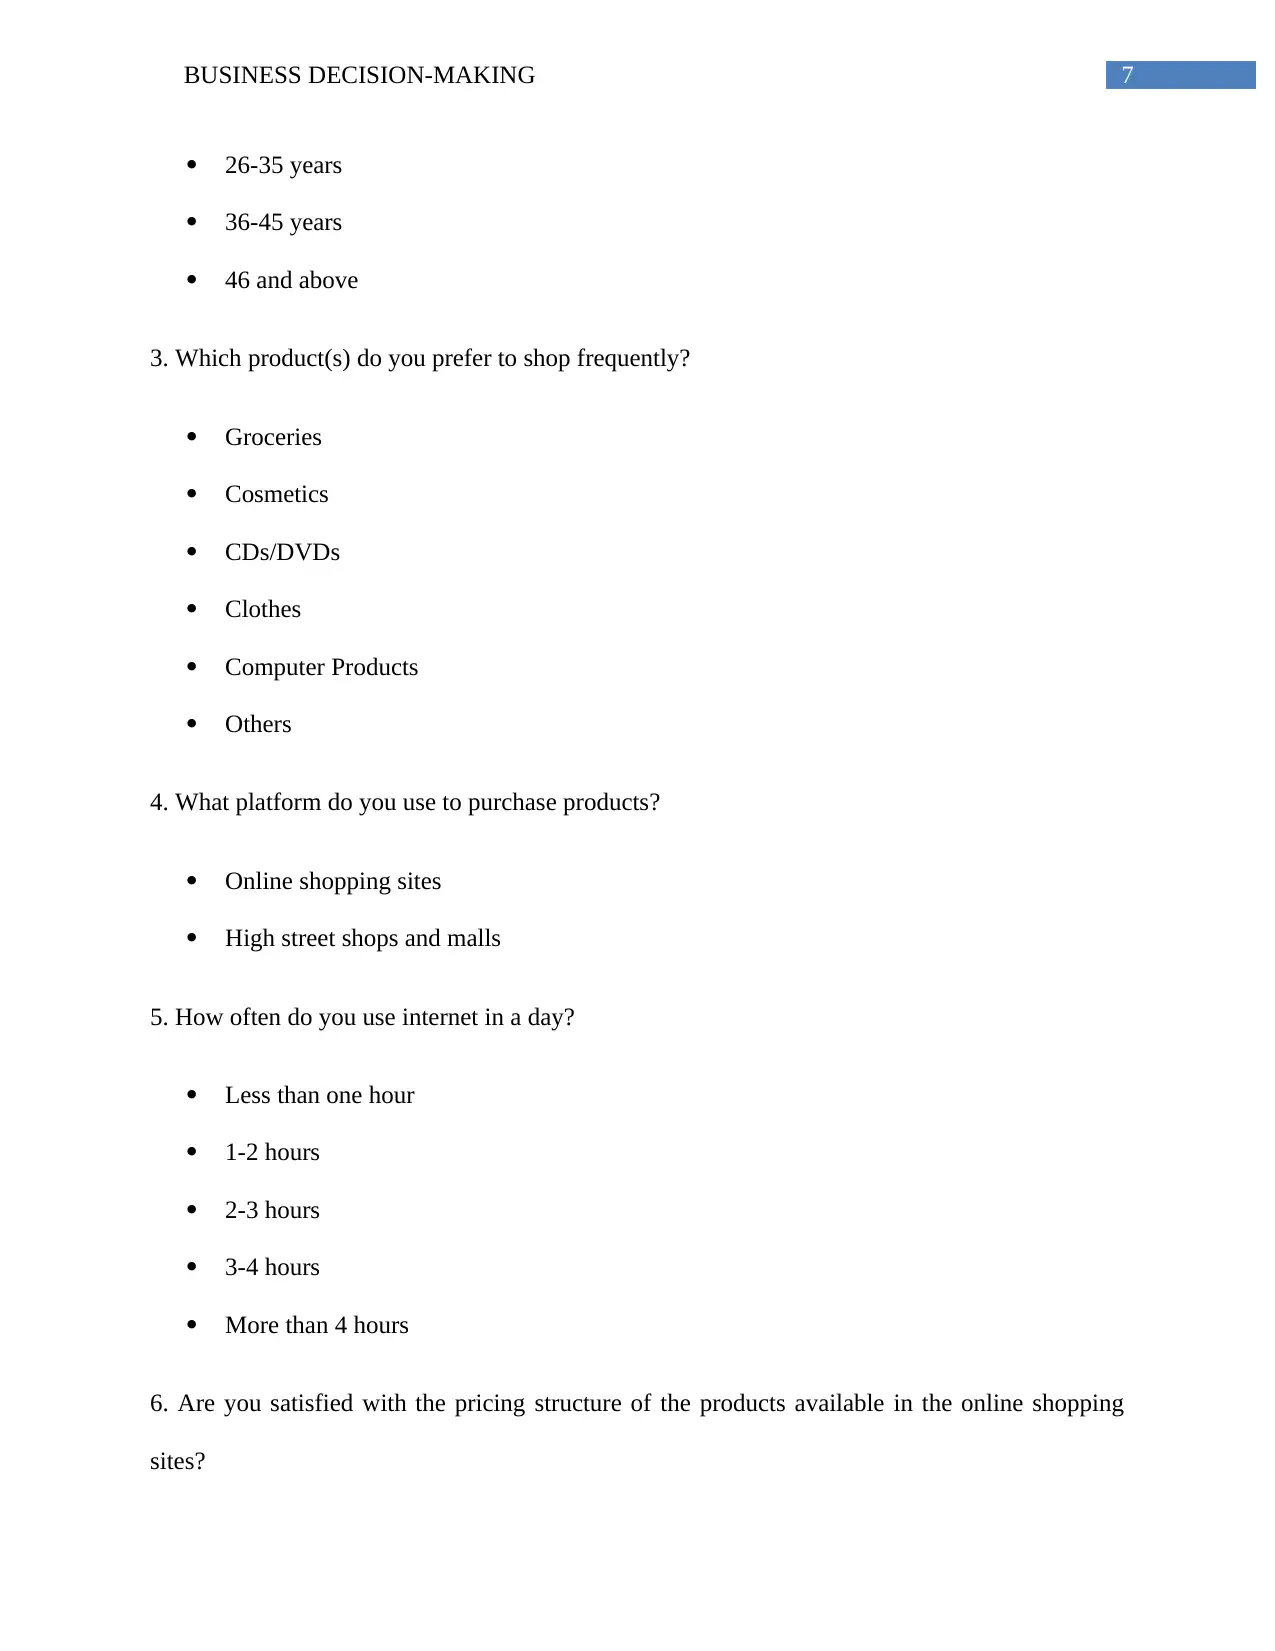
c) Questionnaire for data collection:
1. Tick your gender:
Male
Female
2. Tick your age group:
Less than 18 years
18-25 years
in contrast to the retail shops operating in UK (Silverman 2016). Along with this, in order to
carry out online survey, the students of UK are contacted via e-mail with the designed set of
questions. Hence, with the help of this survey methodology, it is possible to collect suitable
primary information which could support in meeting the objective of the research as well
(Vaioleti 2016).
Sampling frame:
Sampling frame is related to choosing the sample size from which the data needs to be
accumulated. In order to collect information, probability sampling in the form of simple random
sampling has been used, in which every student has the equal opportunity of being chosen in
order to provide information regarding their choice of platforms for purchasing products
(Ledford and Gast 2018). The sample size of 30 students has been chosen irrespective of all ages.
Hence, by considering the students of various campuses in UK, exact and up-to-date information
could be gathered through which suitable business decisions could be undertaken (Humphries
2017).
c) Questionnaire for data collection:
1. Tick your gender:
Male
Female
2. Tick your age group:
Less than 18 years
18-25 years
Paraphrase This Document
Need a fresh take? Get an instant paraphrase of this document with our AI Paraphraser
7BUSINESS DECISION-MAKING
26-35 years
36-45 years
46 and above
3. Which product(s) do you prefer to shop frequently?
Groceries
Cosmetics
CDs/DVDs
Clothes
Computer Products
Others
4. What platform do you use to purchase products?
Online shopping sites
High street shops and malls
5. How often do you use internet in a day?
Less than one hour
1-2 hours
2-3 hours
3-4 hours
More than 4 hours
6. Are you satisfied with the pricing structure of the products available in the online shopping
sites?
8BUSINESS DECISION-MAKING
Strongly Agree
Agree
Neutral
Disagree
Strongly Disagree
7. Are you contented with the quality of the products and services provided to you by the online
shopping sites?
Strongly Agree
Agree
Neutral
Disagree
Strongly Disagree
8. Do you receive any discount offers more than the retail stores in online shopping sites?
Strongly Agree
Agree
Neutral
Disagree
Strongly Disagree
9. Do you think that the product lines offered by the online shopping sites are diversified in
contrast to the traditional retail stores?
Strongly Agree
Strongly Agree
Agree
Neutral
Disagree
Strongly Disagree
7. Are you contented with the quality of the products and services provided to you by the online
shopping sites?
Strongly Agree
Agree
Neutral
Disagree
Strongly Disagree
8. Do you receive any discount offers more than the retail stores in online shopping sites?
Strongly Agree
Agree
Neutral
Disagree
Strongly Disagree
9. Do you think that the product lines offered by the online shopping sites are diversified in
contrast to the traditional retail stores?
Strongly Agree
⊘ This is a preview!⊘
Do you want full access?
Subscribe today to unlock all pages.
Trusted by 1+ million students worldwide
9BUSINESS DECISION-MAKING
Agree
Neutral
Disagree
Strongly Disagree
10. What factors have motivated you to engage in frequent online purchases?
Availability of diversified range of products
Product quality
Pricing structure
Service delivery
All of the above
Task 2: Summarisation and analysis of data
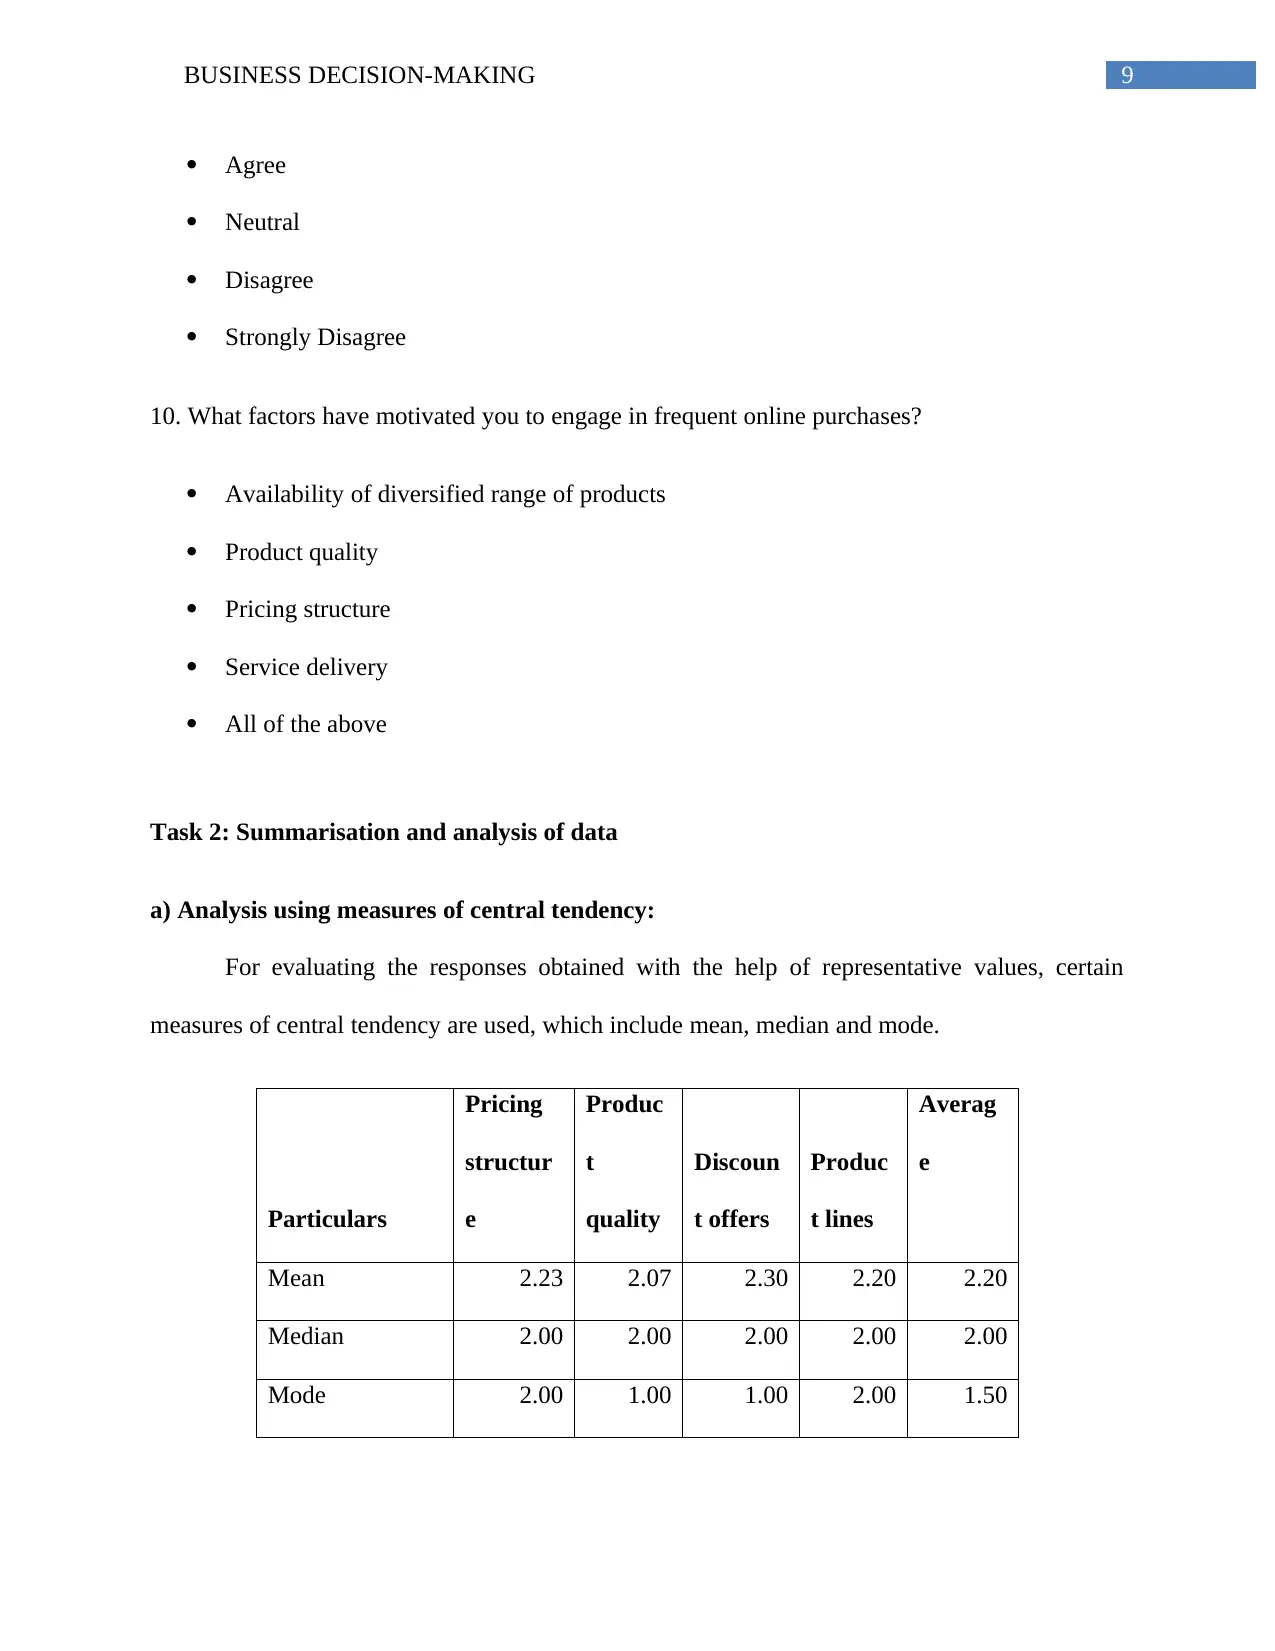
a) Analysis using measures of central tendency:
For evaluating the responses obtained with the help of representative values, certain
measures of central tendency are used, which include mean, median and mode.
Particulars
Pricing
structur
e
Produc
t
quality
Discoun
t offers
Produc
t lines
Averag
e
Mean 2.23 2.07 2.30 2.20 2.20
Median 2.00 2.00 2.00 2.00 2.00
Mode 2.00 1.00 1.00 2.00 1.50
Agree
Neutral
Disagree
Strongly Disagree
10. What factors have motivated you to engage in frequent online purchases?
Availability of diversified range of products
Product quality
Pricing structure
Service delivery
All of the above
Task 2: Summarisation and analysis of data
a) Analysis using measures of central tendency:
For evaluating the responses obtained with the help of representative values, certain
measures of central tendency are used, which include mean, median and mode.
Particulars
Pricing
structur
e
Produc
t
quality
Discoun
t offers
Produc
t lines
Averag
e
Mean 2.23 2.07 2.30 2.20 2.20
Median 2.00 2.00 2.00 2.00 2.00
Mode 2.00 1.00 1.00 2.00 1.50
Paraphrase This Document
Need a fresh take? Get an instant paraphrase of this document with our AI Paraphraser
10BUSINESS DECISION-MAKING
Table 1: Data analysis using measures of central tendency
(Source: As created by author)
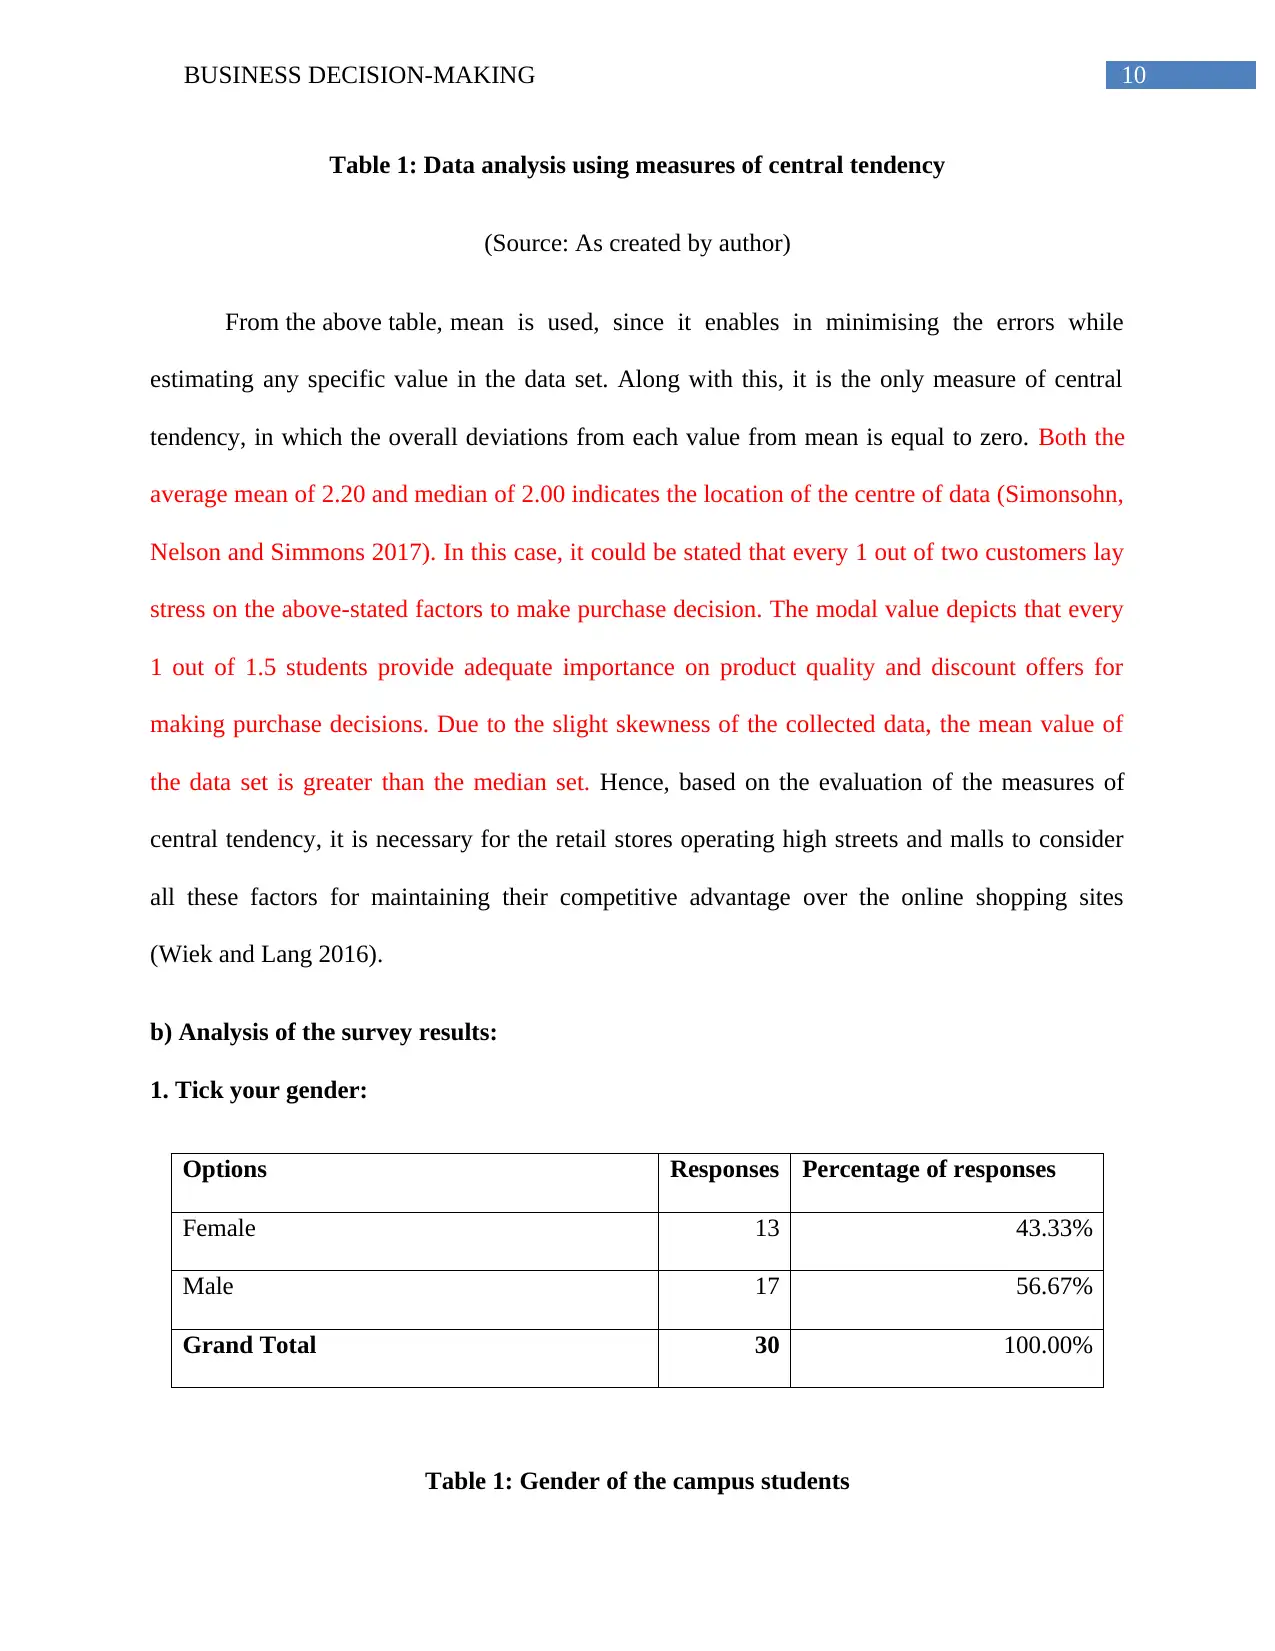
From the above table, mean is used, since it enables in minimising the errors while
estimating any specific value in the data set. Along with this, it is the only measure of central
tendency, in which the overall deviations from each value from mean is equal to zero. Both the
average mean of 2.20 and median of 2.00 indicates the location of the centre of data (Simonsohn,
Nelson and Simmons 2017). In this case, it could be stated that every 1 out of two customers lay
stress on the above-stated factors to make purchase decision. The modal value depicts that every
1 out of 1.5 students provide adequate importance on product quality and discount offers for
making purchase decisions. Due to the slight skewness of the collected data, the mean value of
the data set is greater than the median set. Hence, based on the evaluation of the measures of
central tendency, it is necessary for the retail stores operating high streets and malls to consider
all these factors for maintaining their competitive advantage over the online shopping sites
(Wiek and Lang 2016).
b) Analysis of the survey results:
1. Tick your gender:
Options Responses Percentage of responses
Female 13 43.33%
Male 17 56.67%
Grand Total 30 100.00%
Table 1: Gender of the campus students
Table 1: Data analysis using measures of central tendency
(Source: As created by author)
From the above table, mean is used, since it enables in minimising the errors while
estimating any specific value in the data set. Along with this, it is the only measure of central
tendency, in which the overall deviations from each value from mean is equal to zero. Both the
average mean of 2.20 and median of 2.00 indicates the location of the centre of data (Simonsohn,
Nelson and Simmons 2017). In this case, it could be stated that every 1 out of two customers lay
stress on the above-stated factors to make purchase decision. The modal value depicts that every
1 out of 1.5 students provide adequate importance on product quality and discount offers for
making purchase decisions. Due to the slight skewness of the collected data, the mean value of
the data set is greater than the median set. Hence, based on the evaluation of the measures of
central tendency, it is necessary for the retail stores operating high streets and malls to consider
all these factors for maintaining their competitive advantage over the online shopping sites
(Wiek and Lang 2016).
b) Analysis of the survey results:
1. Tick your gender:
Options Responses Percentage of responses
Female 13 43.33%
Male 17 56.67%
Grand Total 30 100.00%
Table 1: Gender of the campus students
11BUSINESS DECISION-MAKING
(Source: As created by author)
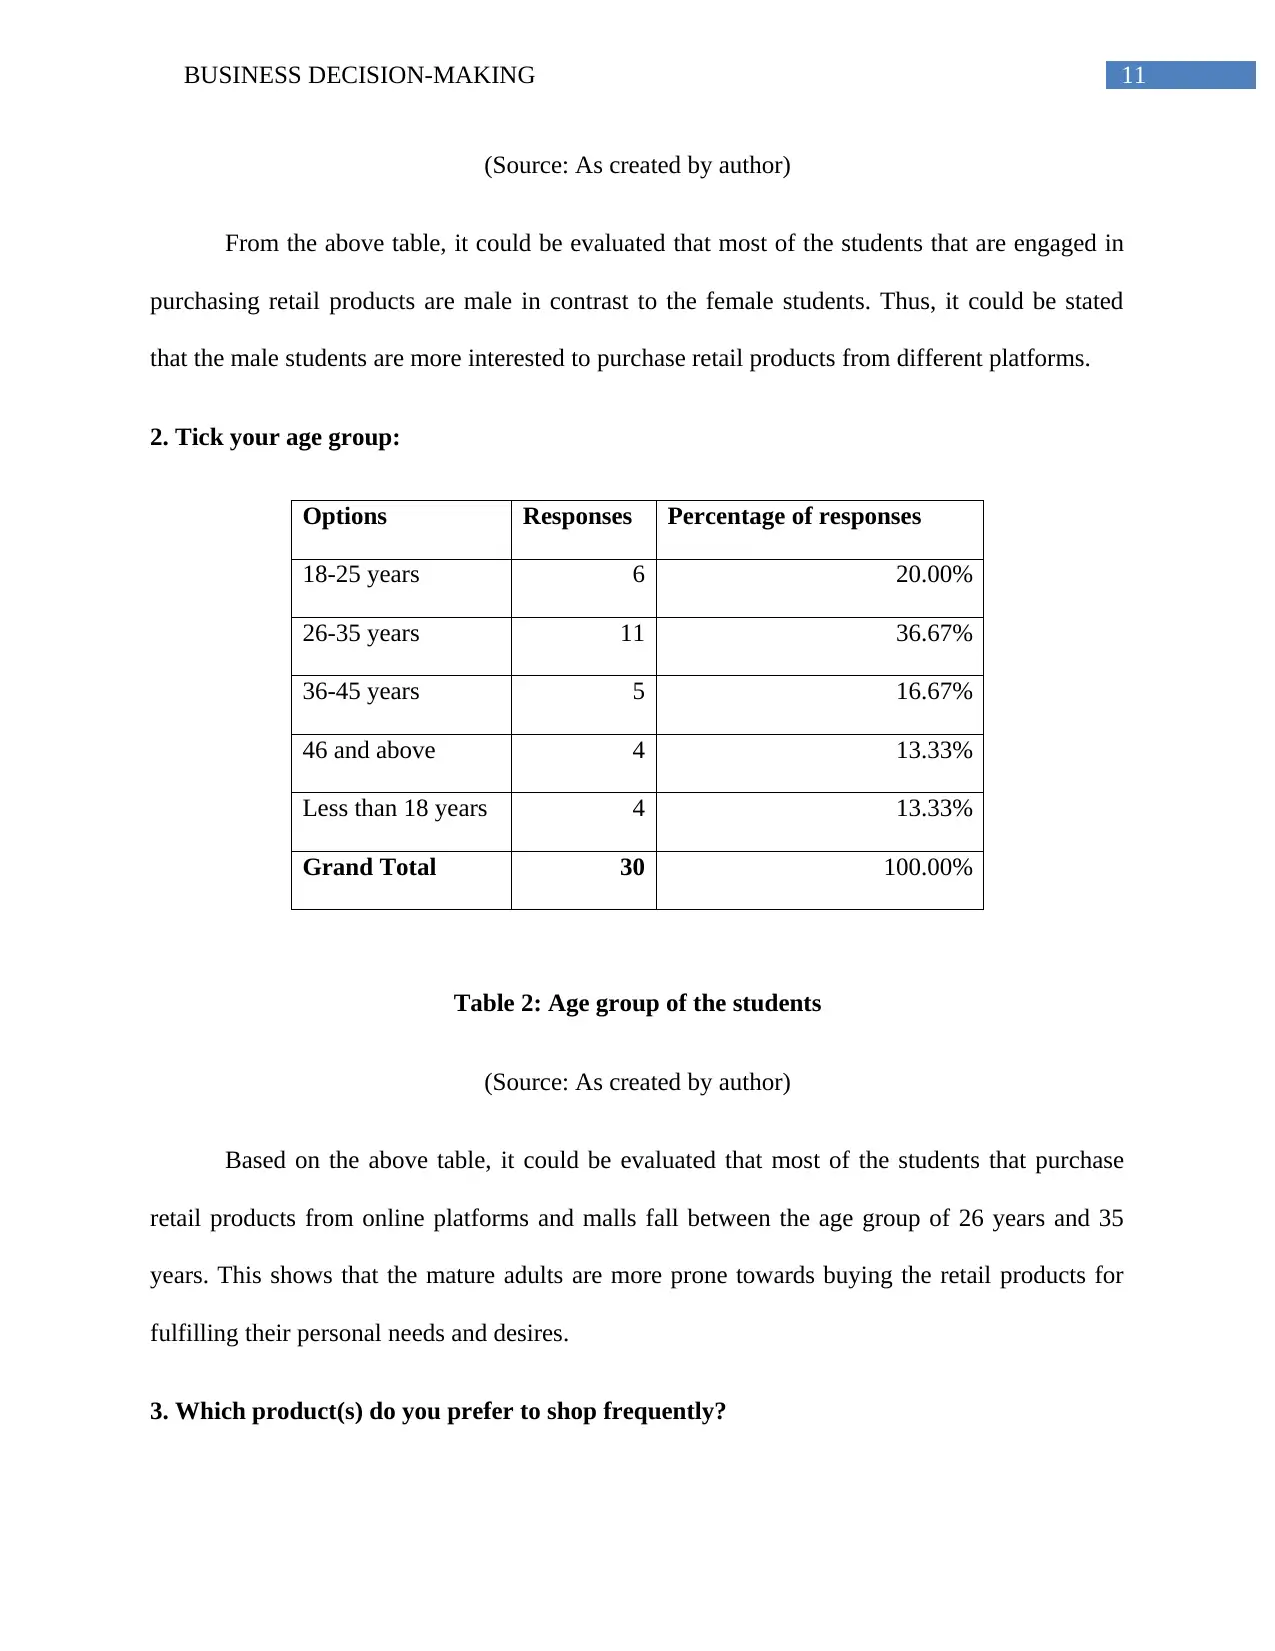
From the above table, it could be evaluated that most of the students that are engaged in
purchasing retail products are male in contrast to the female students. Thus, it could be stated
that the male students are more interested to purchase retail products from different platforms.
2. Tick your age group:
Options Responses Percentage of responses
18-25 years 6 20.00%
26-35 years 11 36.67%
36-45 years 5 16.67%
46 and above 4 13.33%
Less than 18 years 4 13.33%
Grand Total 30 100.00%
Table 2: Age group of the students
(Source: As created by author)
Based on the above table, it could be evaluated that most of the students that purchase
retail products from online platforms and malls fall between the age group of 26 years and 35
years. This shows that the mature adults are more prone towards buying the retail products for
fulfilling their personal needs and desires.
3. Which product(s) do you prefer to shop frequently?
(Source: As created by author)
From the above table, it could be evaluated that most of the students that are engaged in
purchasing retail products are male in contrast to the female students. Thus, it could be stated
that the male students are more interested to purchase retail products from different platforms.
2. Tick your age group:
Options Responses Percentage of responses
18-25 years 6 20.00%
26-35 years 11 36.67%
36-45 years 5 16.67%
46 and above 4 13.33%
Less than 18 years 4 13.33%
Grand Total 30 100.00%
Table 2: Age group of the students
(Source: As created by author)
Based on the above table, it could be evaluated that most of the students that purchase
retail products from online platforms and malls fall between the age group of 26 years and 35
years. This shows that the mature adults are more prone towards buying the retail products for
fulfilling their personal needs and desires.
3. Which product(s) do you prefer to shop frequently?
⊘ This is a preview!⊘
Do you want full access?
Subscribe today to unlock all pages.
Trusted by 1+ million students worldwide
1 out of 38
Related Documents


Your All-in-One AI-Powered Toolkit for Academic Success.
+13062052269
info@desklib.com
Available 24*7 on WhatsApp / Email
![[object Object]](/_next/static/media/star-bottom.7253800d.svg)
Unlock your academic potential
Copyright © 2020–2026 A2Z Services. All Rights Reserved. Developed and managed by ZUCOL.