SEM I Business Decision Making 3.1: Graphical Presentation Report
VerifiedAdded on 2023/04/10
|14
|595
|410
Report
AI Summary
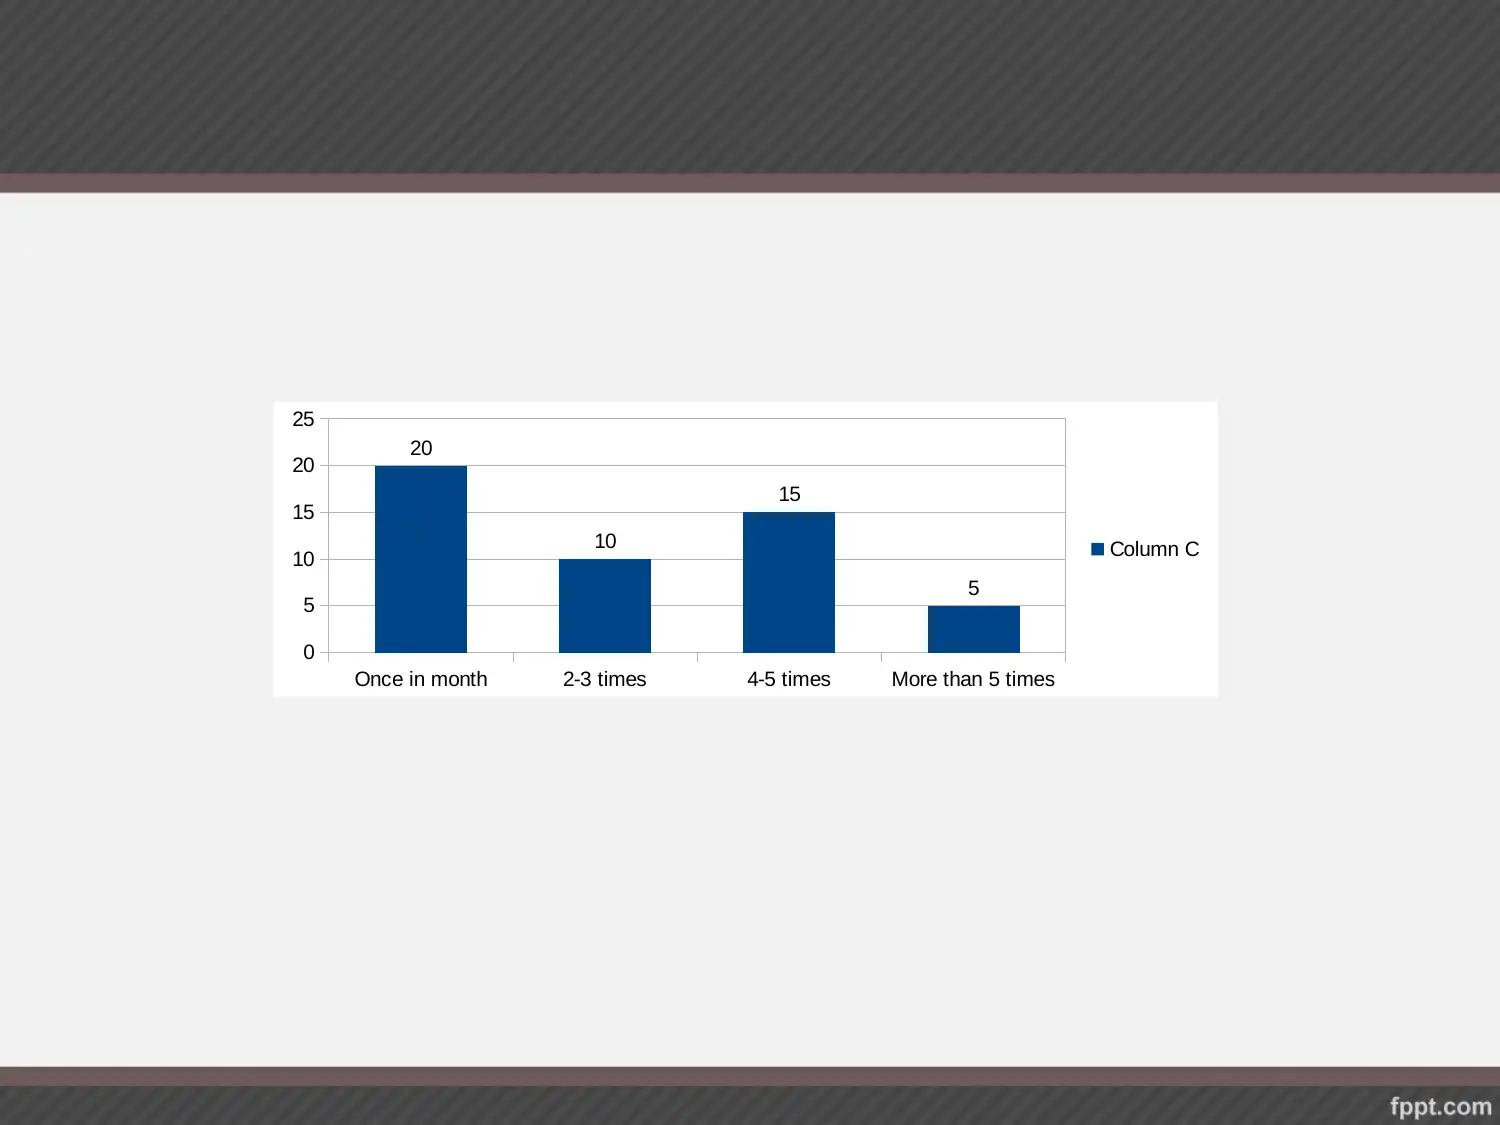
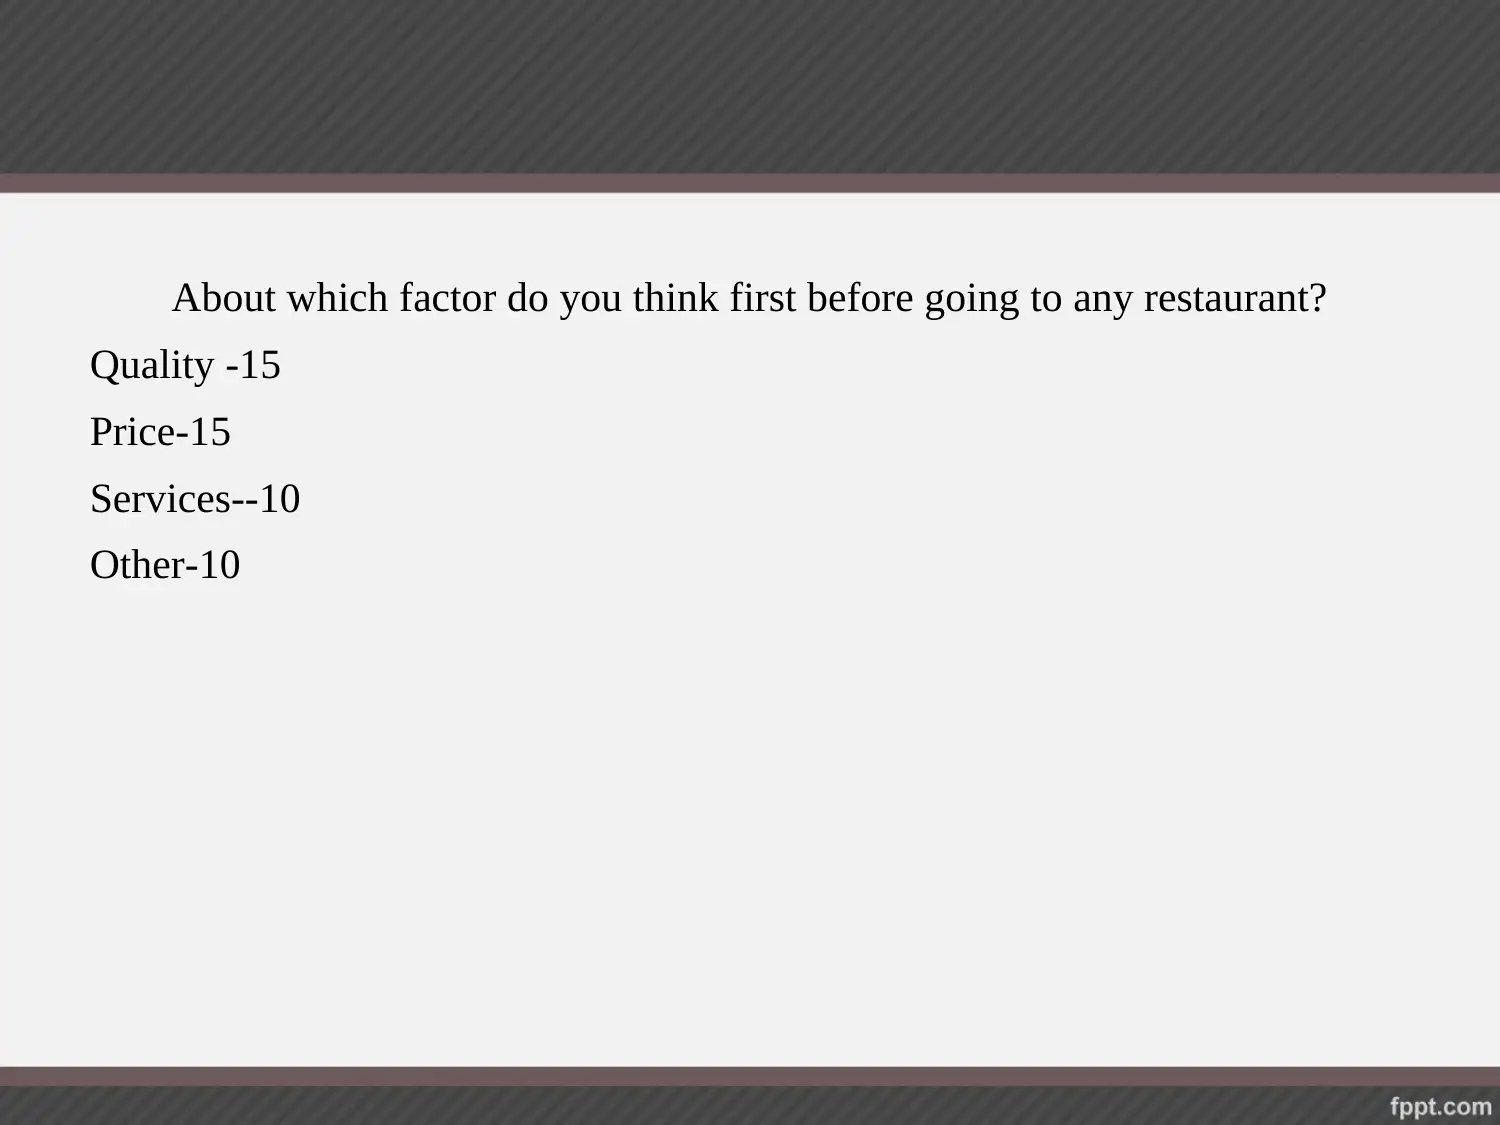
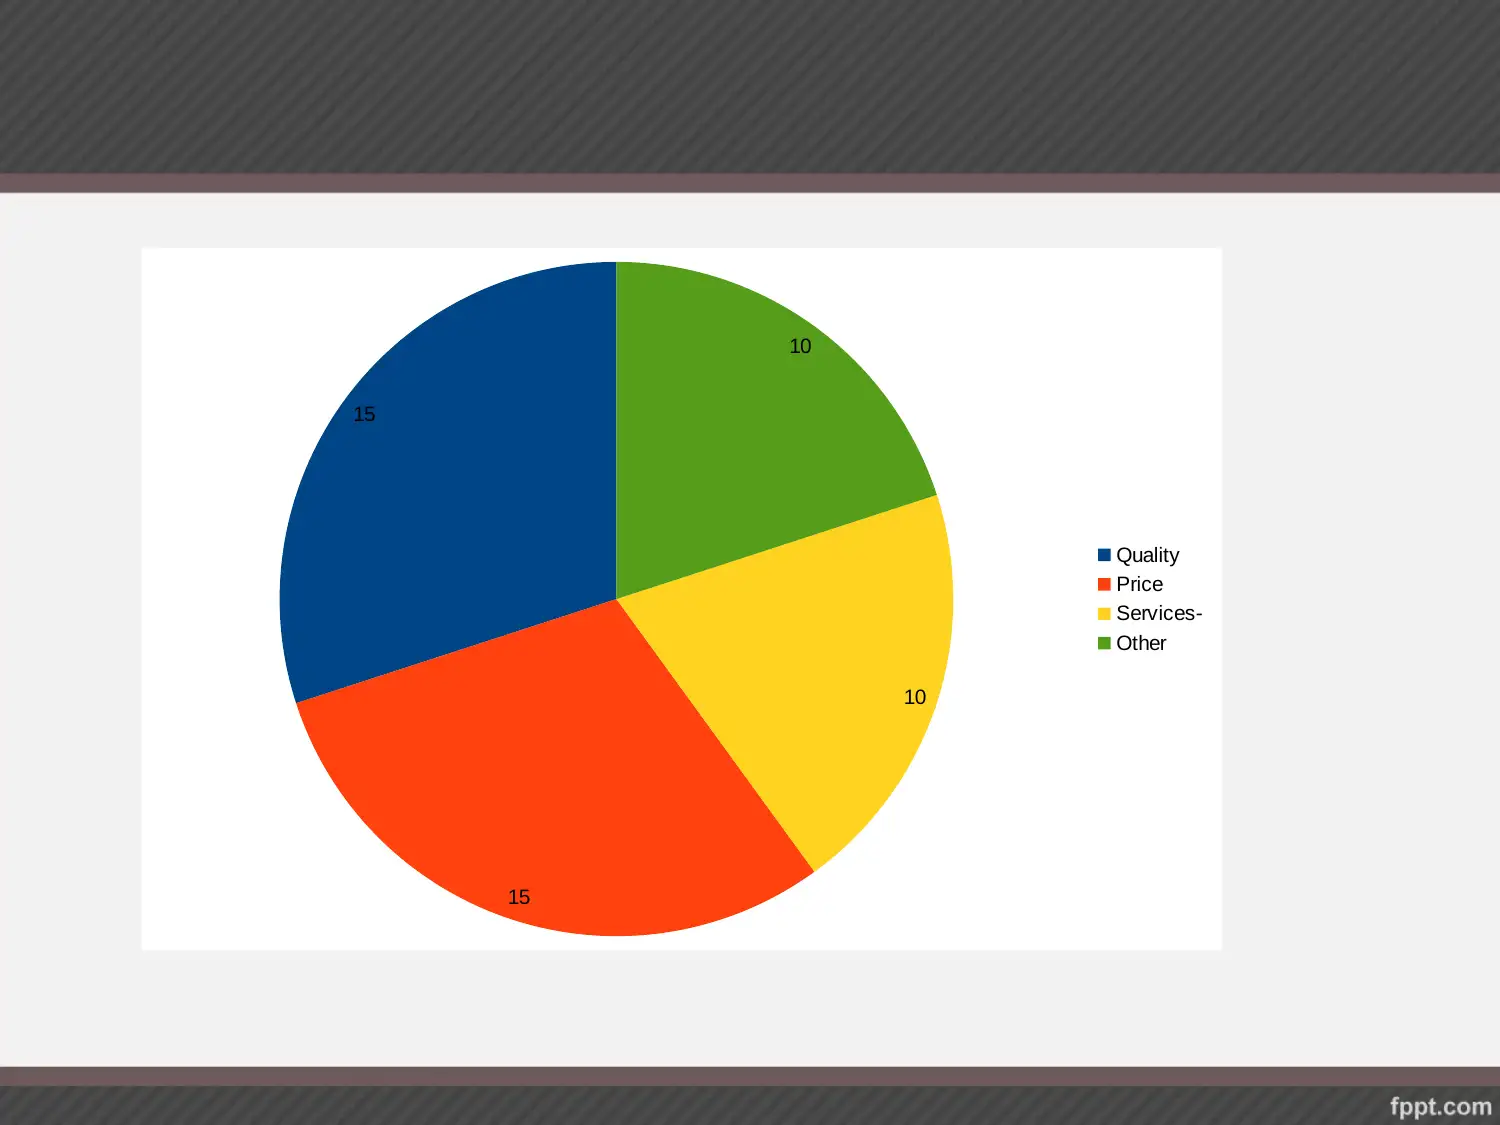
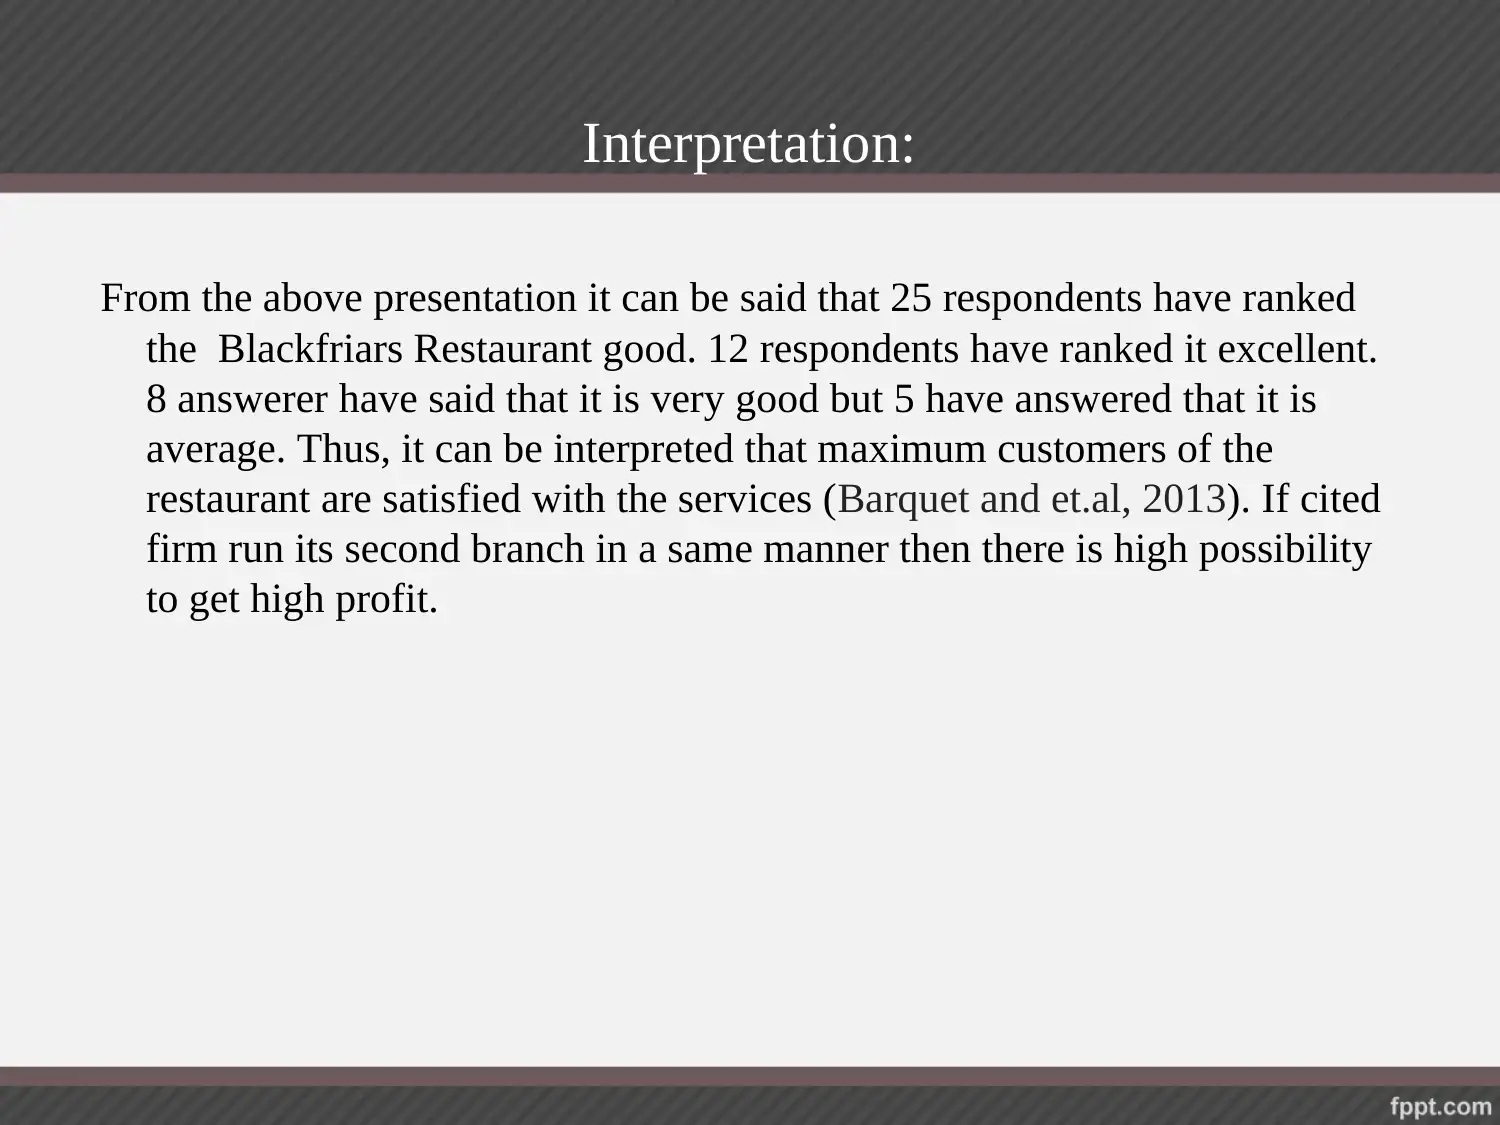
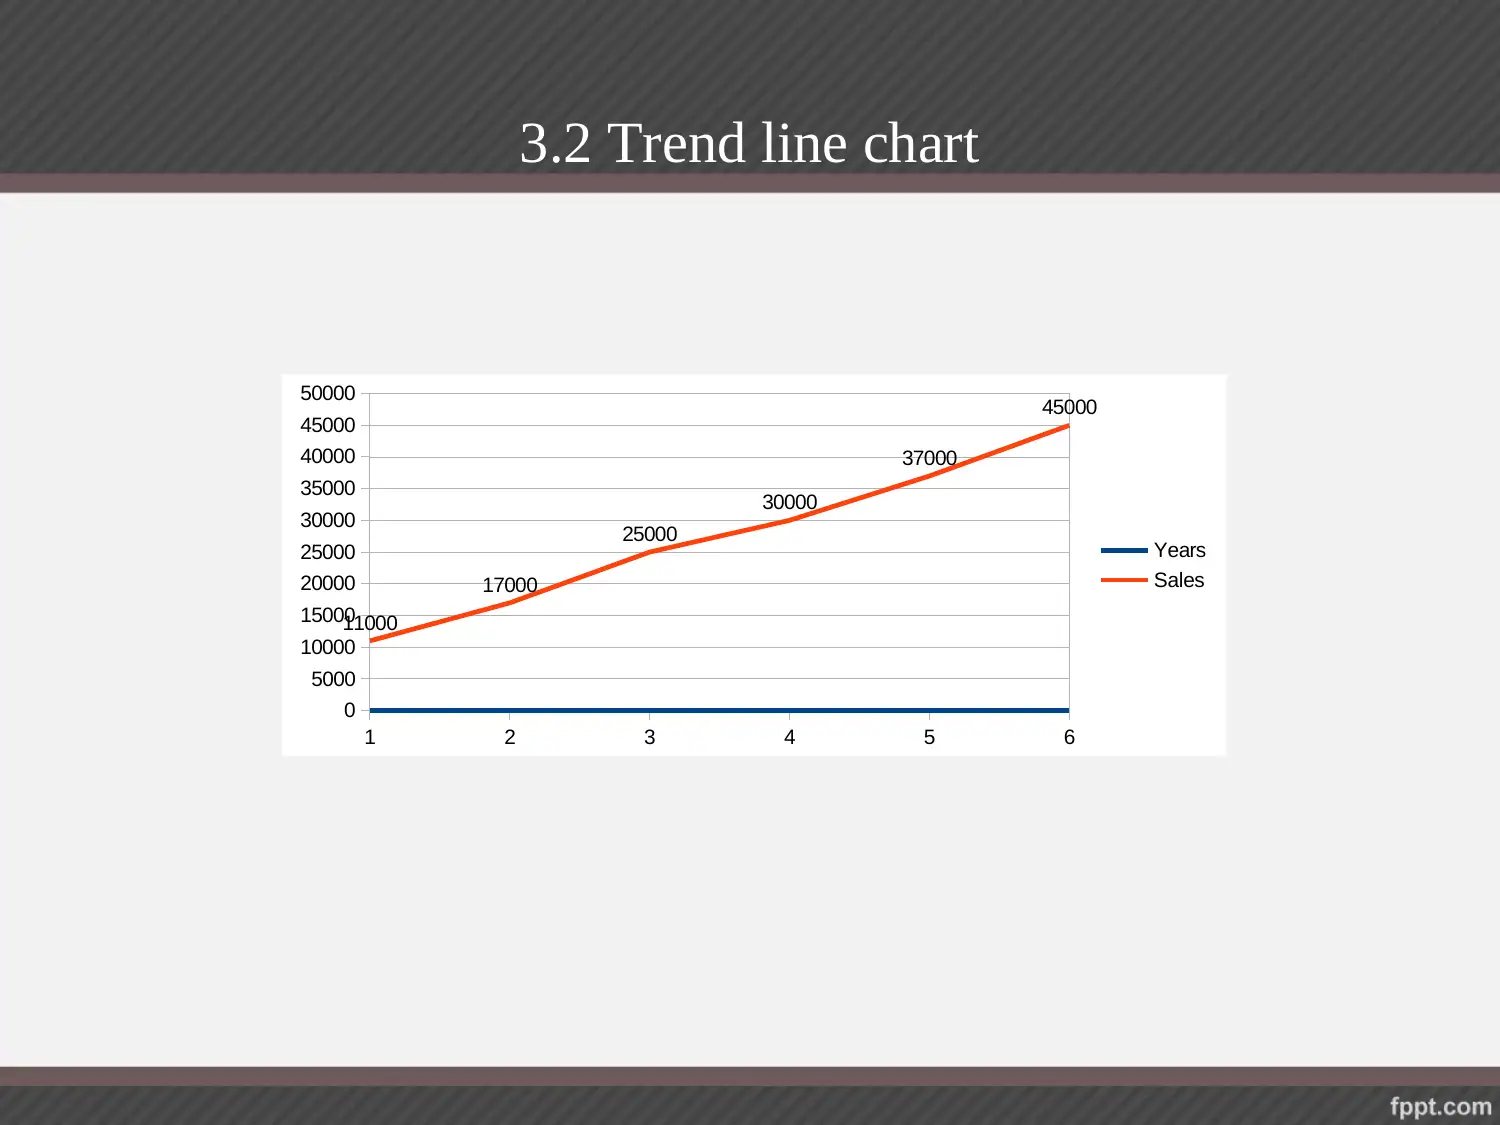
This report analyzes the business decision-making process of Blackfriars Restaurant, focusing on customer behavior and sales trends. The report uses graphical presentations to illustrate customer visit frequency, factors influencing restaurant choice (quality, price, and services), and customer satisfaction levels. Trend line charts are used to analyze sales data over time, showing a continuous increase in sales, indicating potential success for a second restaurant branch. The analysis includes interpretations of the data and suggests strategies to increase demand, such as attractive discount offers and quality services. The report also mentions the use of Excel functions like RAND and NORMDIST for business growth analysis and provides a list of relevant references.

1 out of 14
Related Documents


Your All-in-One AI-Powered Toolkit for Academic Success.
+13062052269
info@desklib.com
Available 24*7 on WhatsApp / Email
![[object Object]](/_next/static/media/star-bottom.7253800d.svg)
Copyright © 2020–2026 A2Z Services. All Rights Reserved. Developed and managed by ZUCOL.