Business Decision Making: Balti Palace Branch Performance Analysis

Verified

Added on  2023/03/23

|10
|372
|45
Report
AI Summary
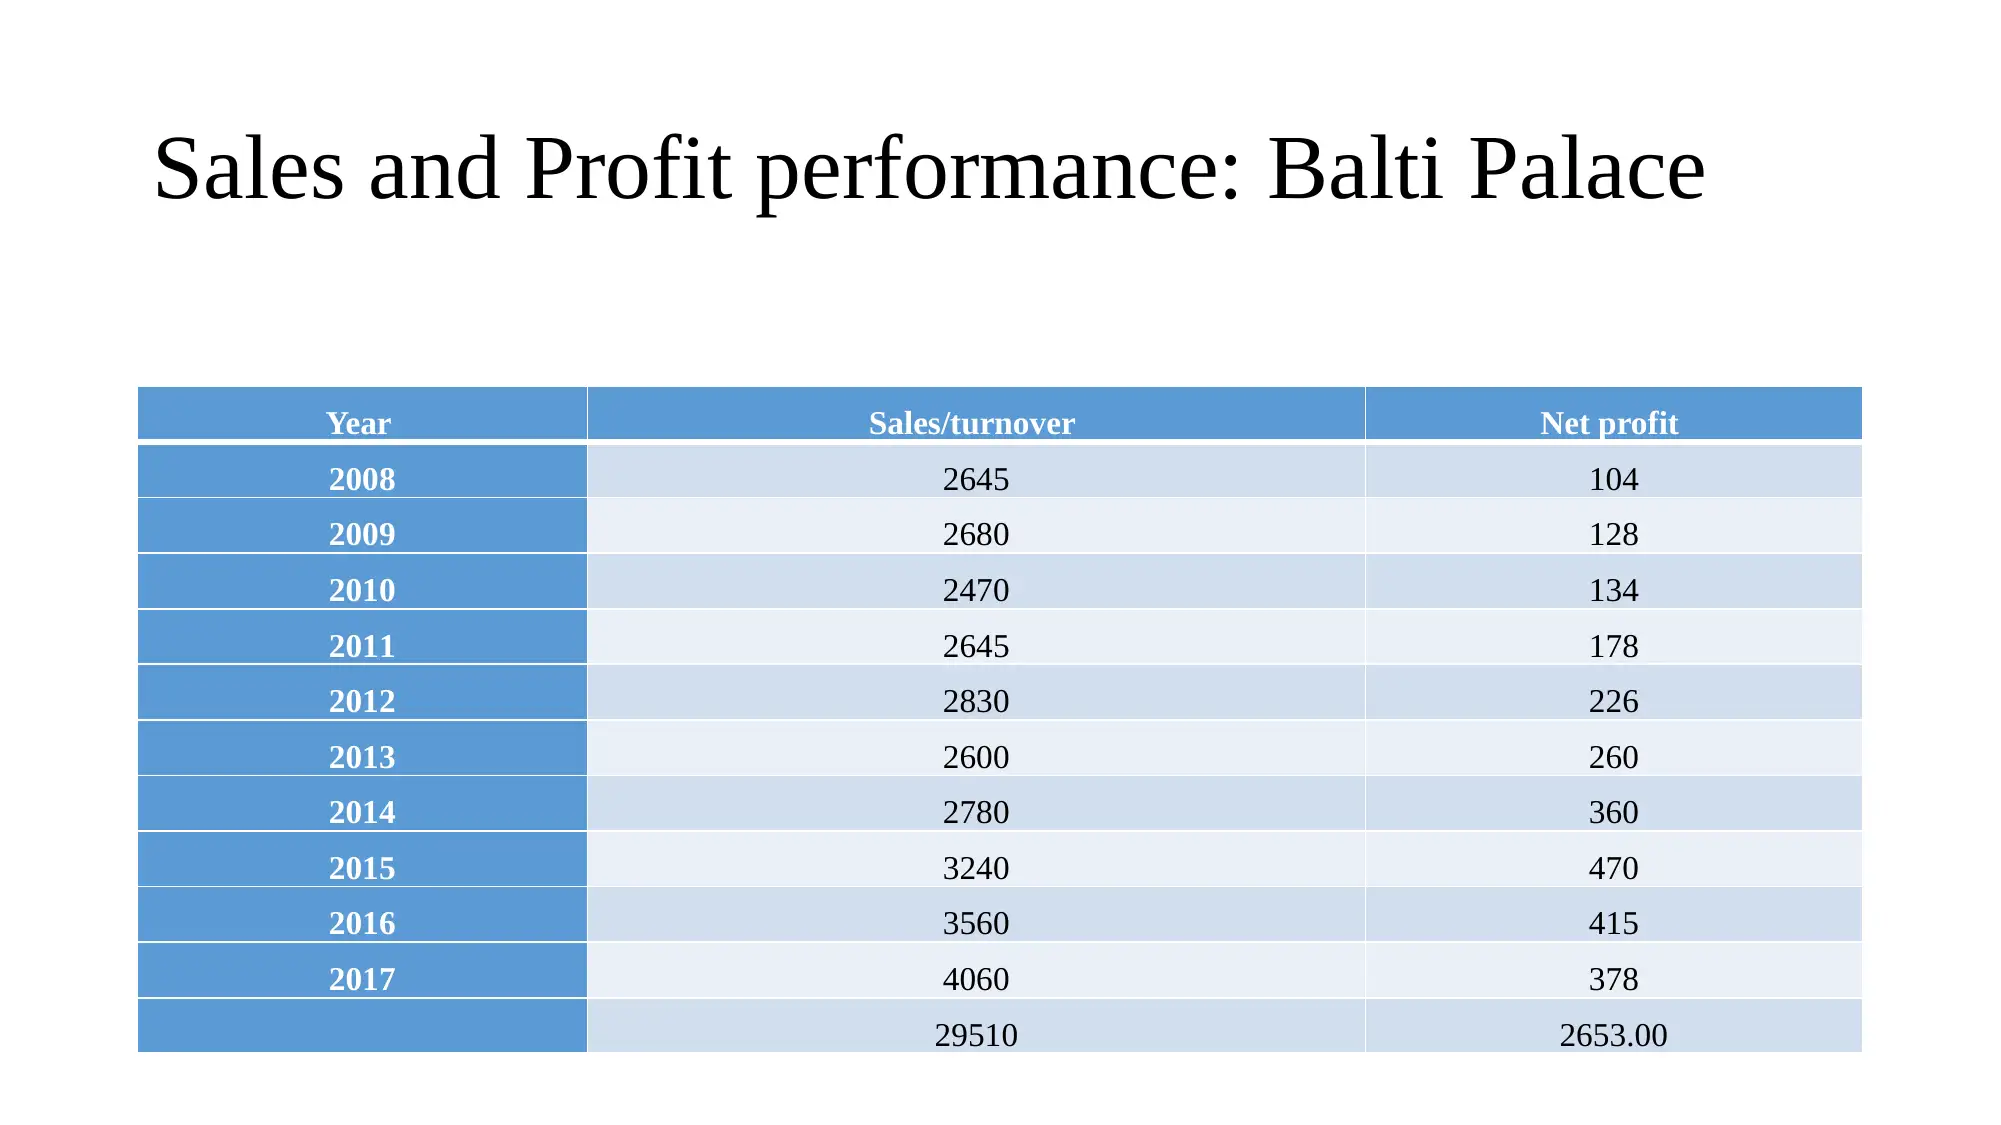
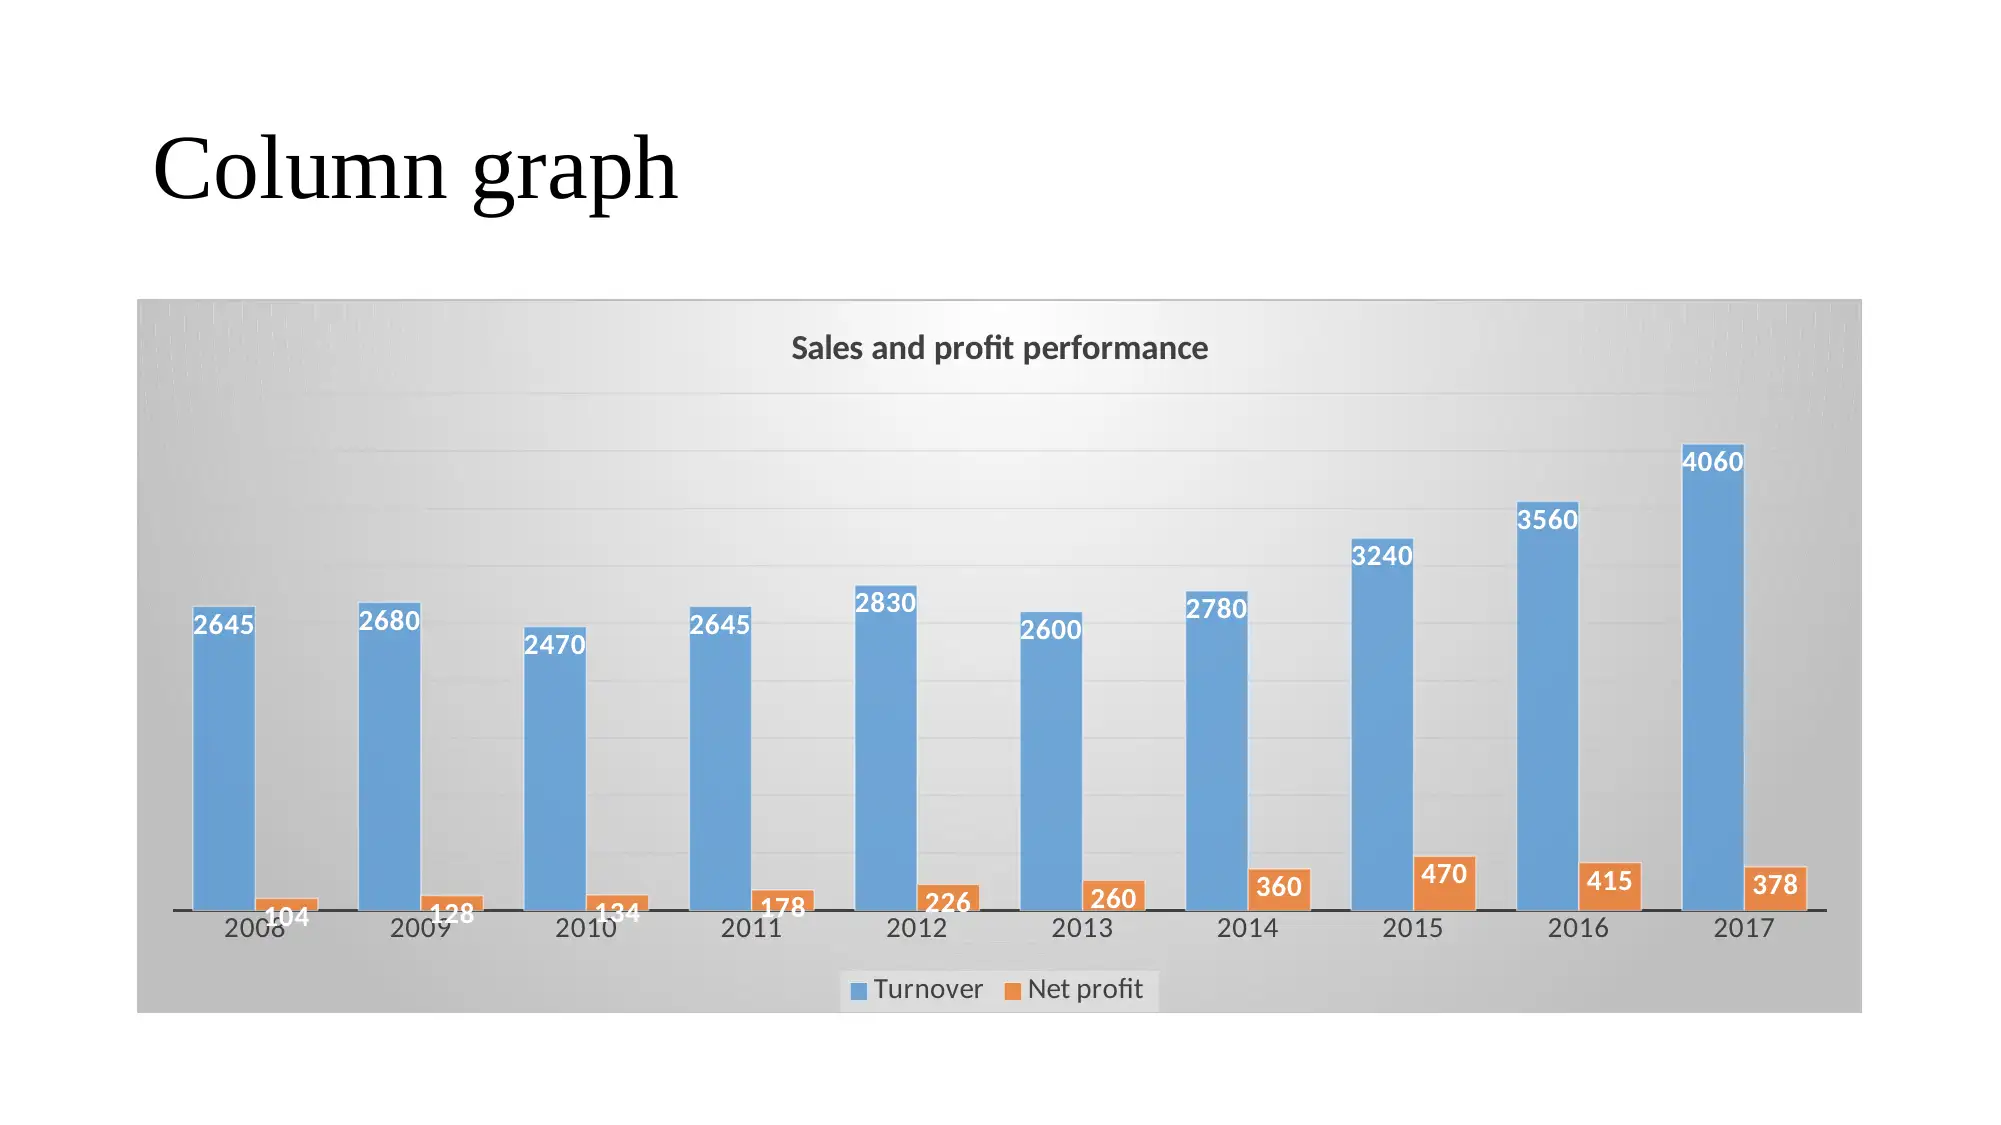
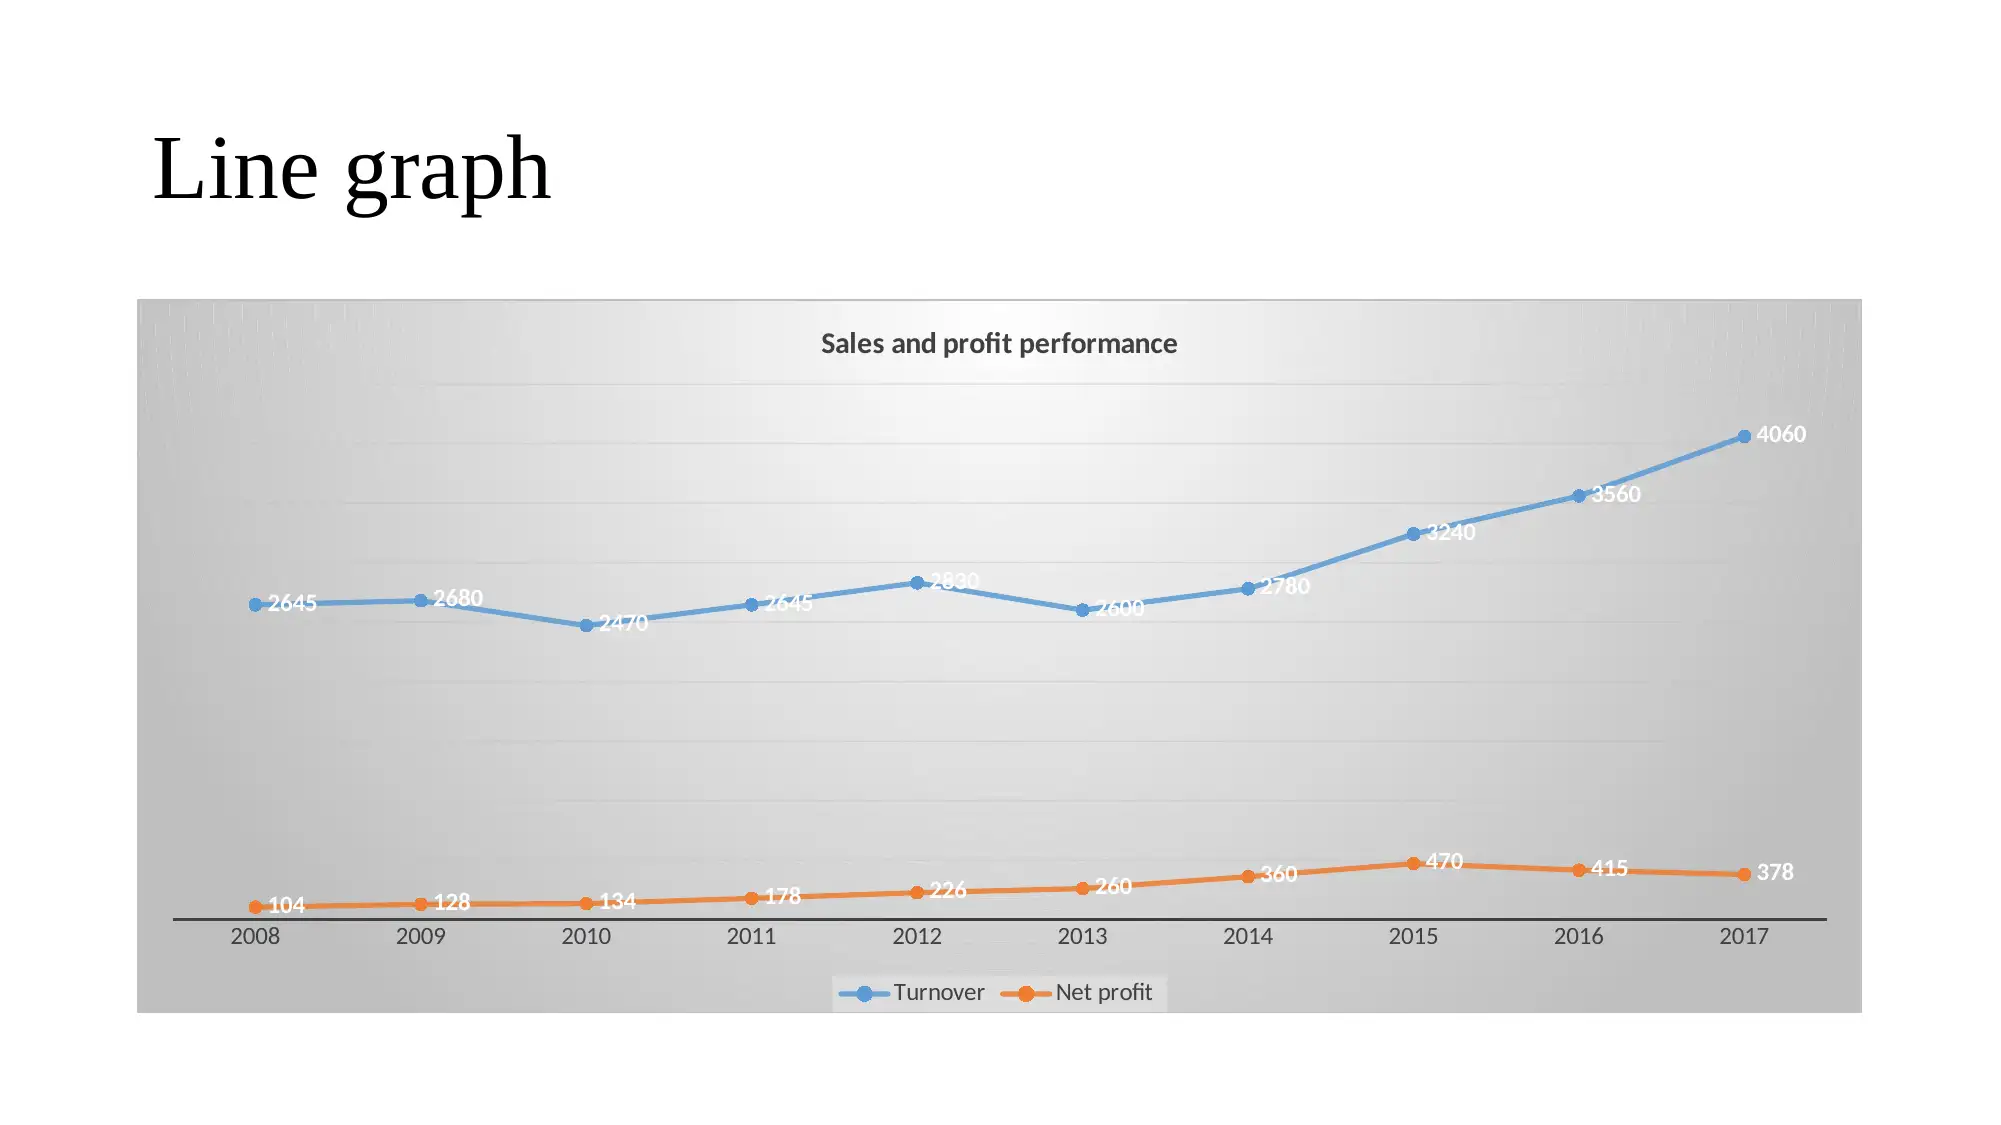
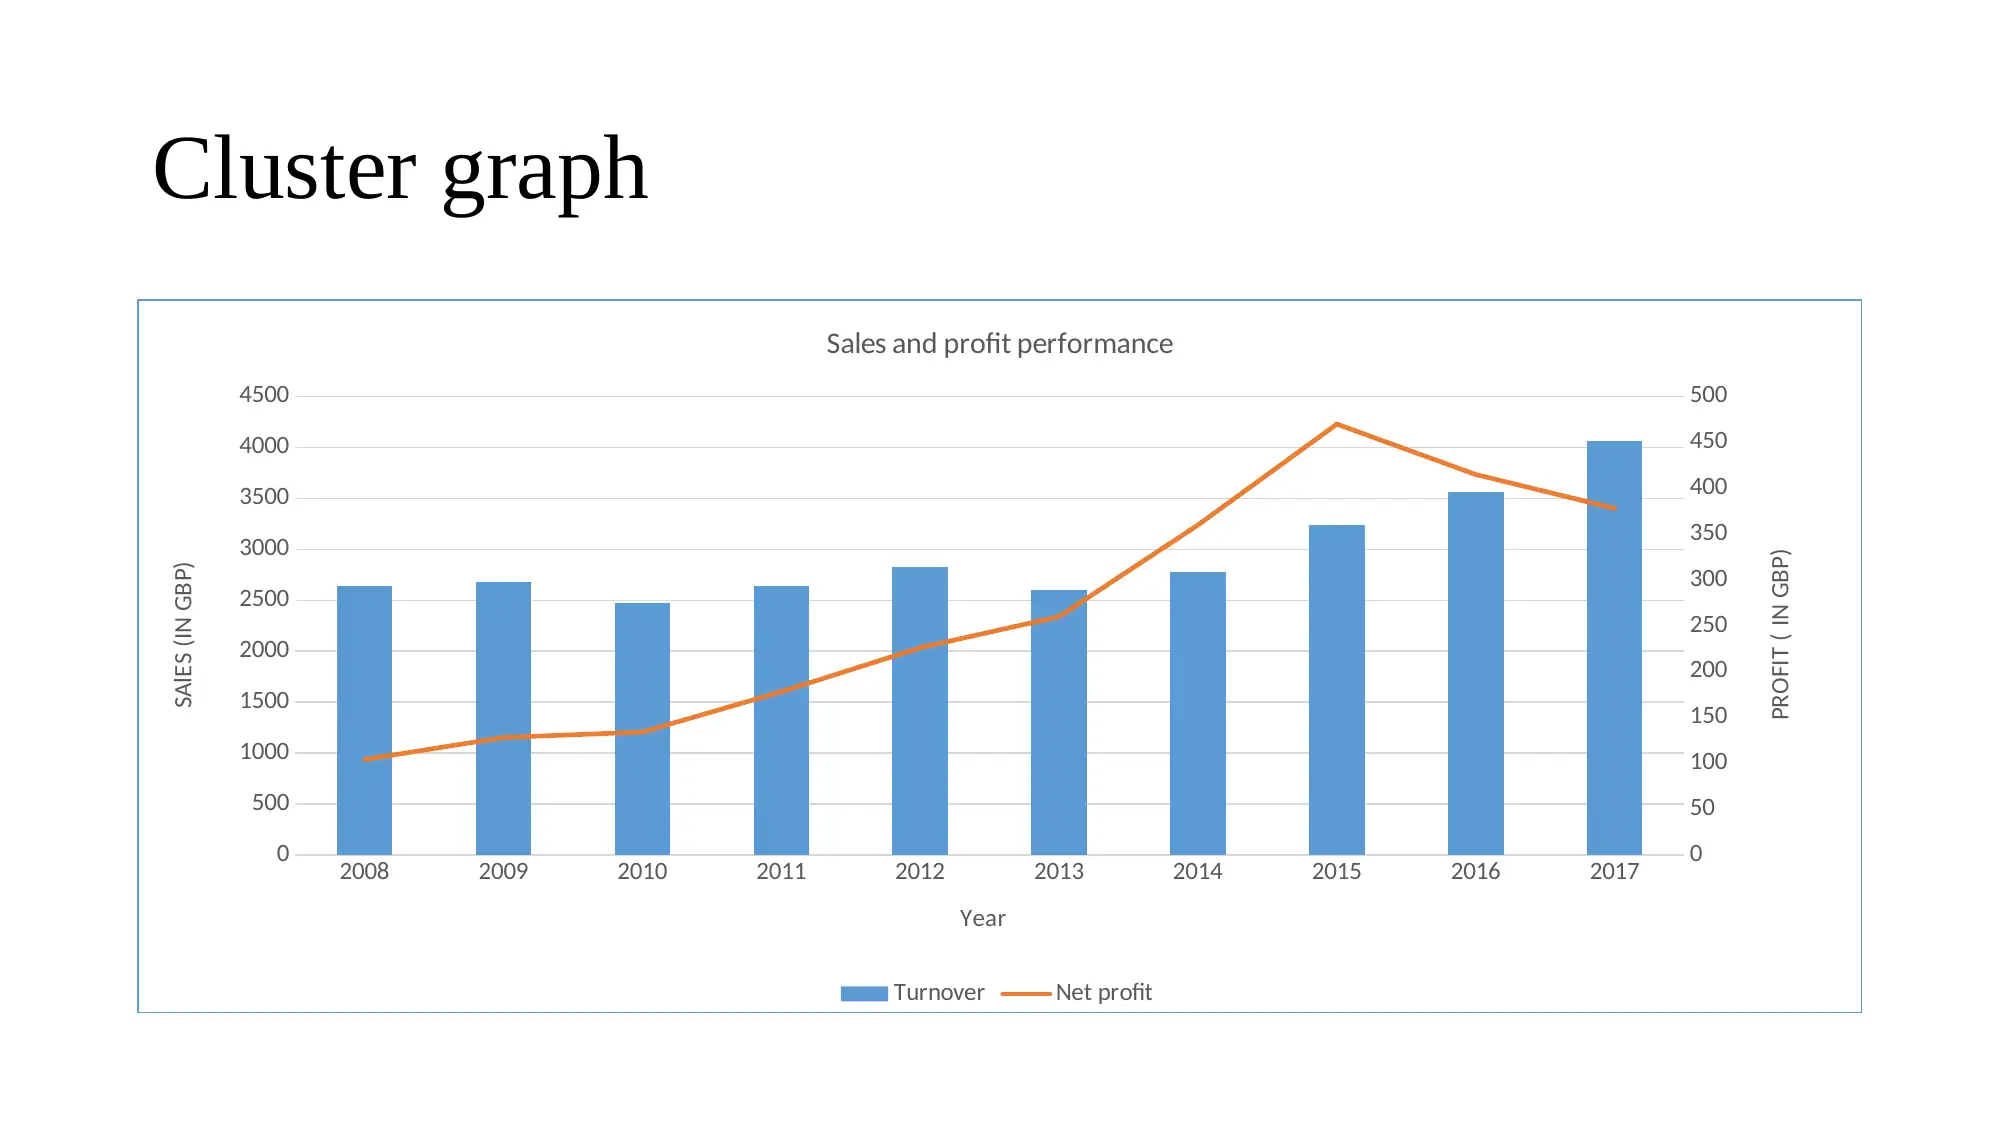
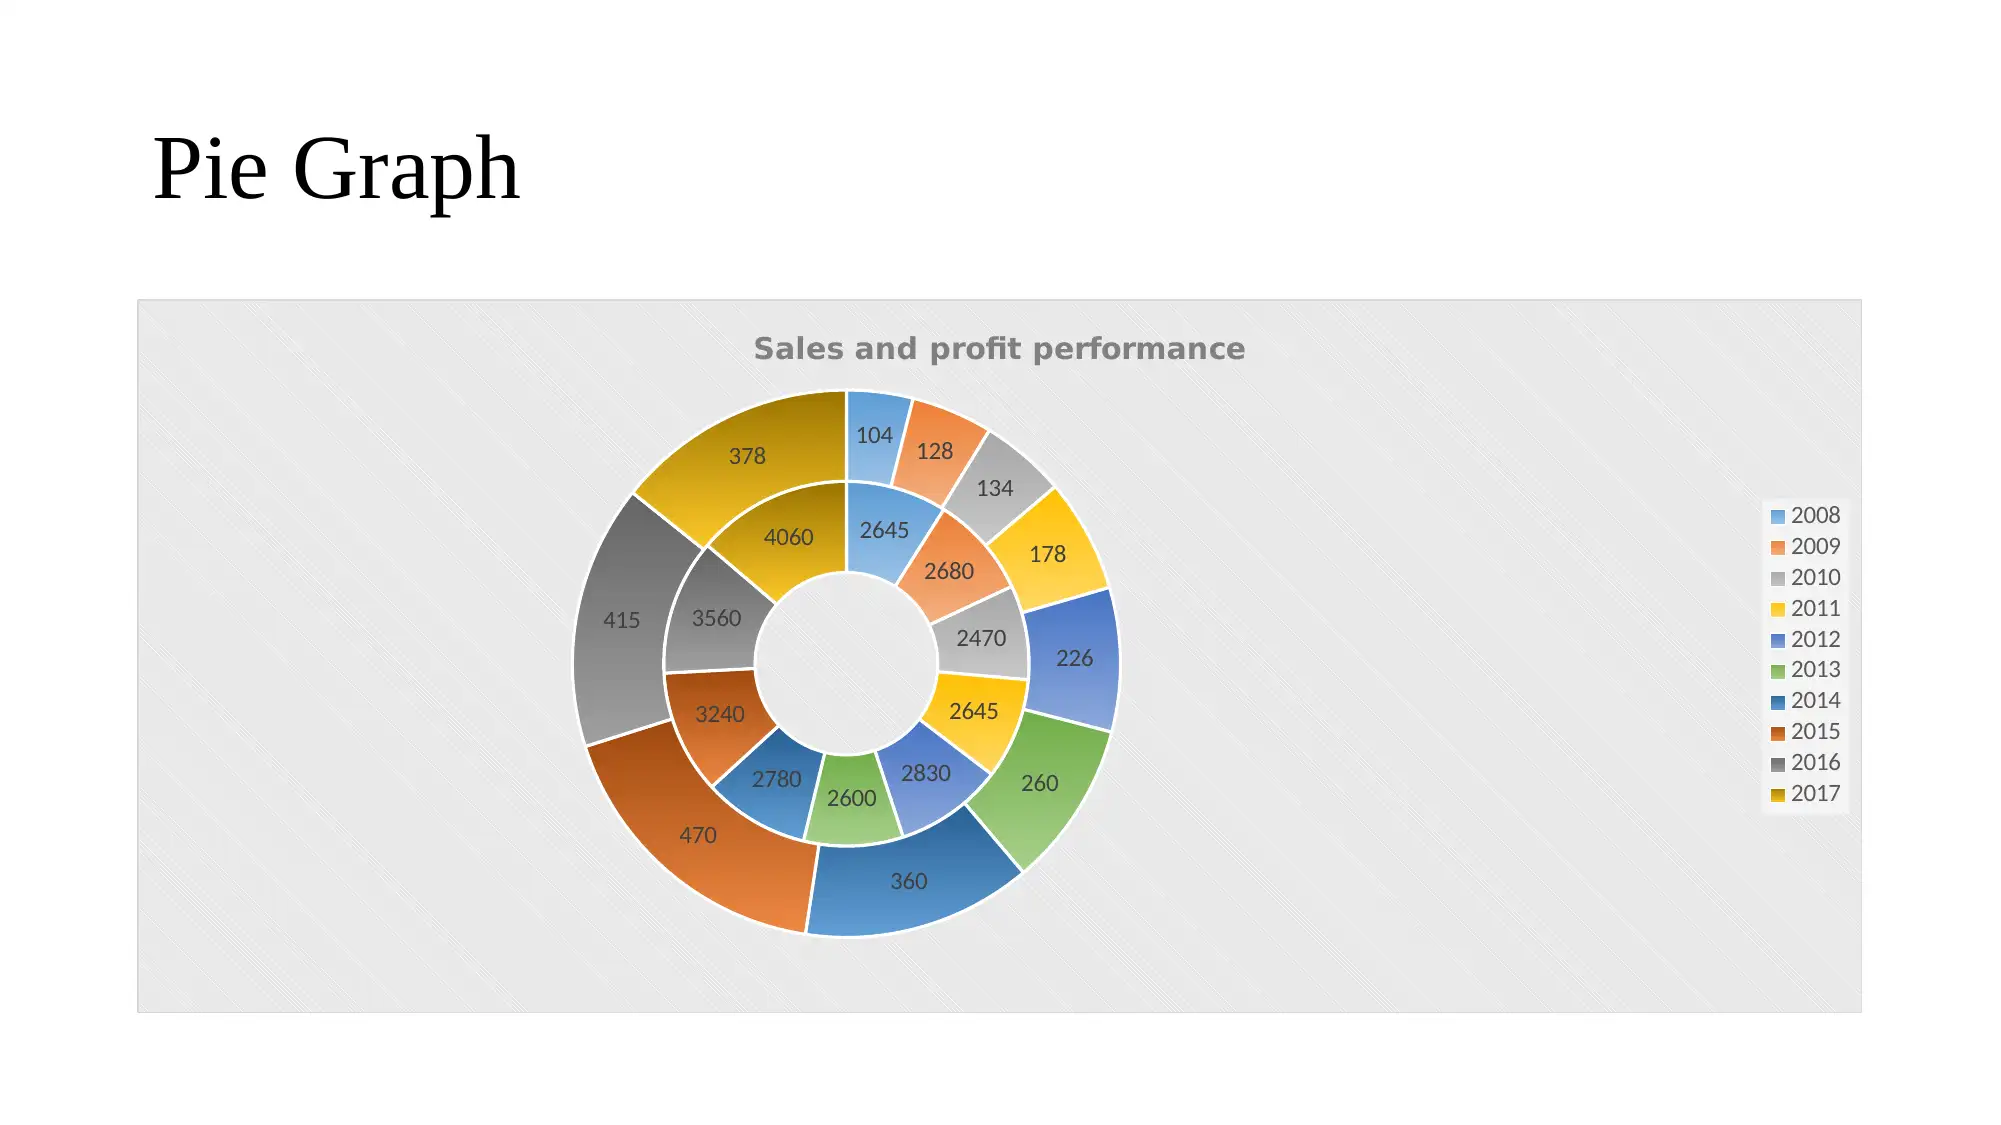
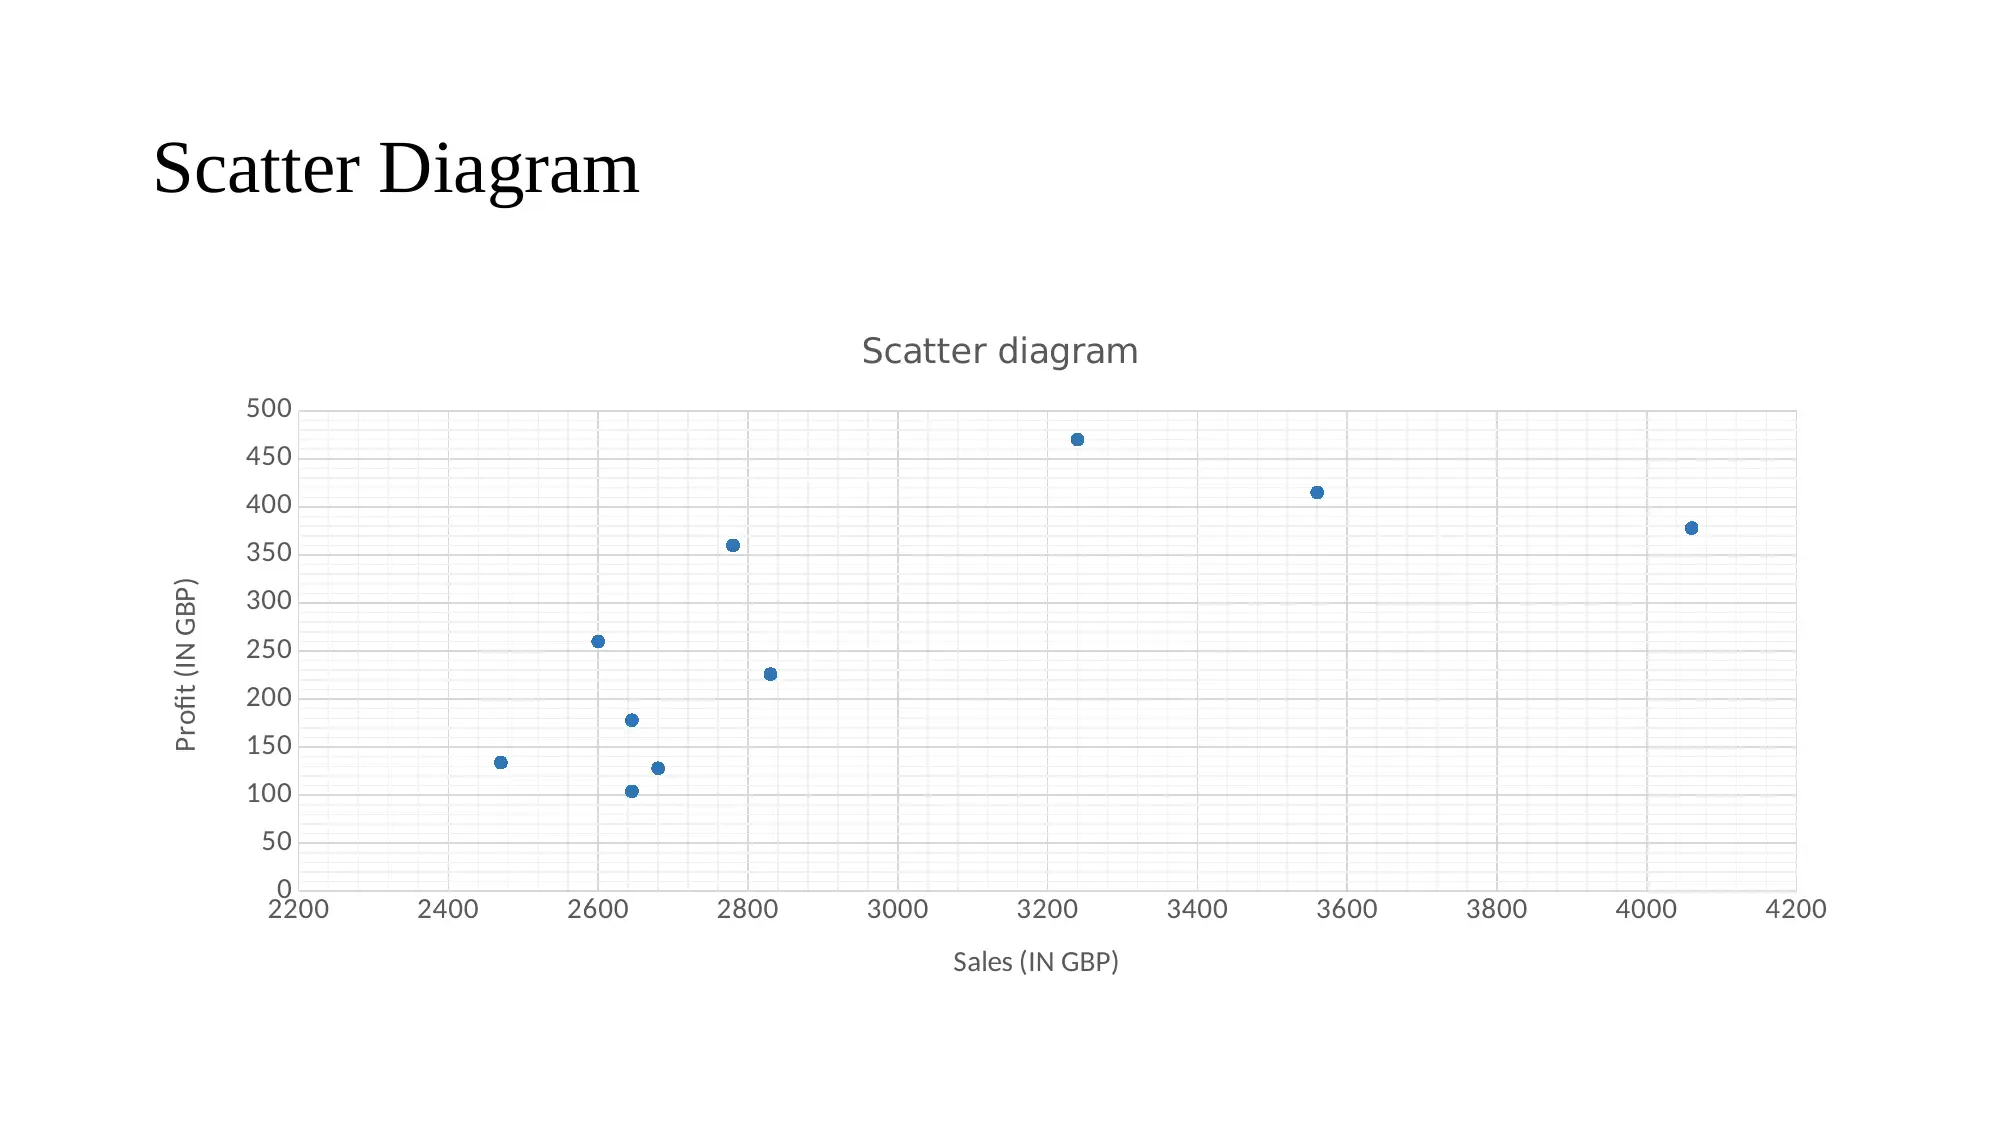
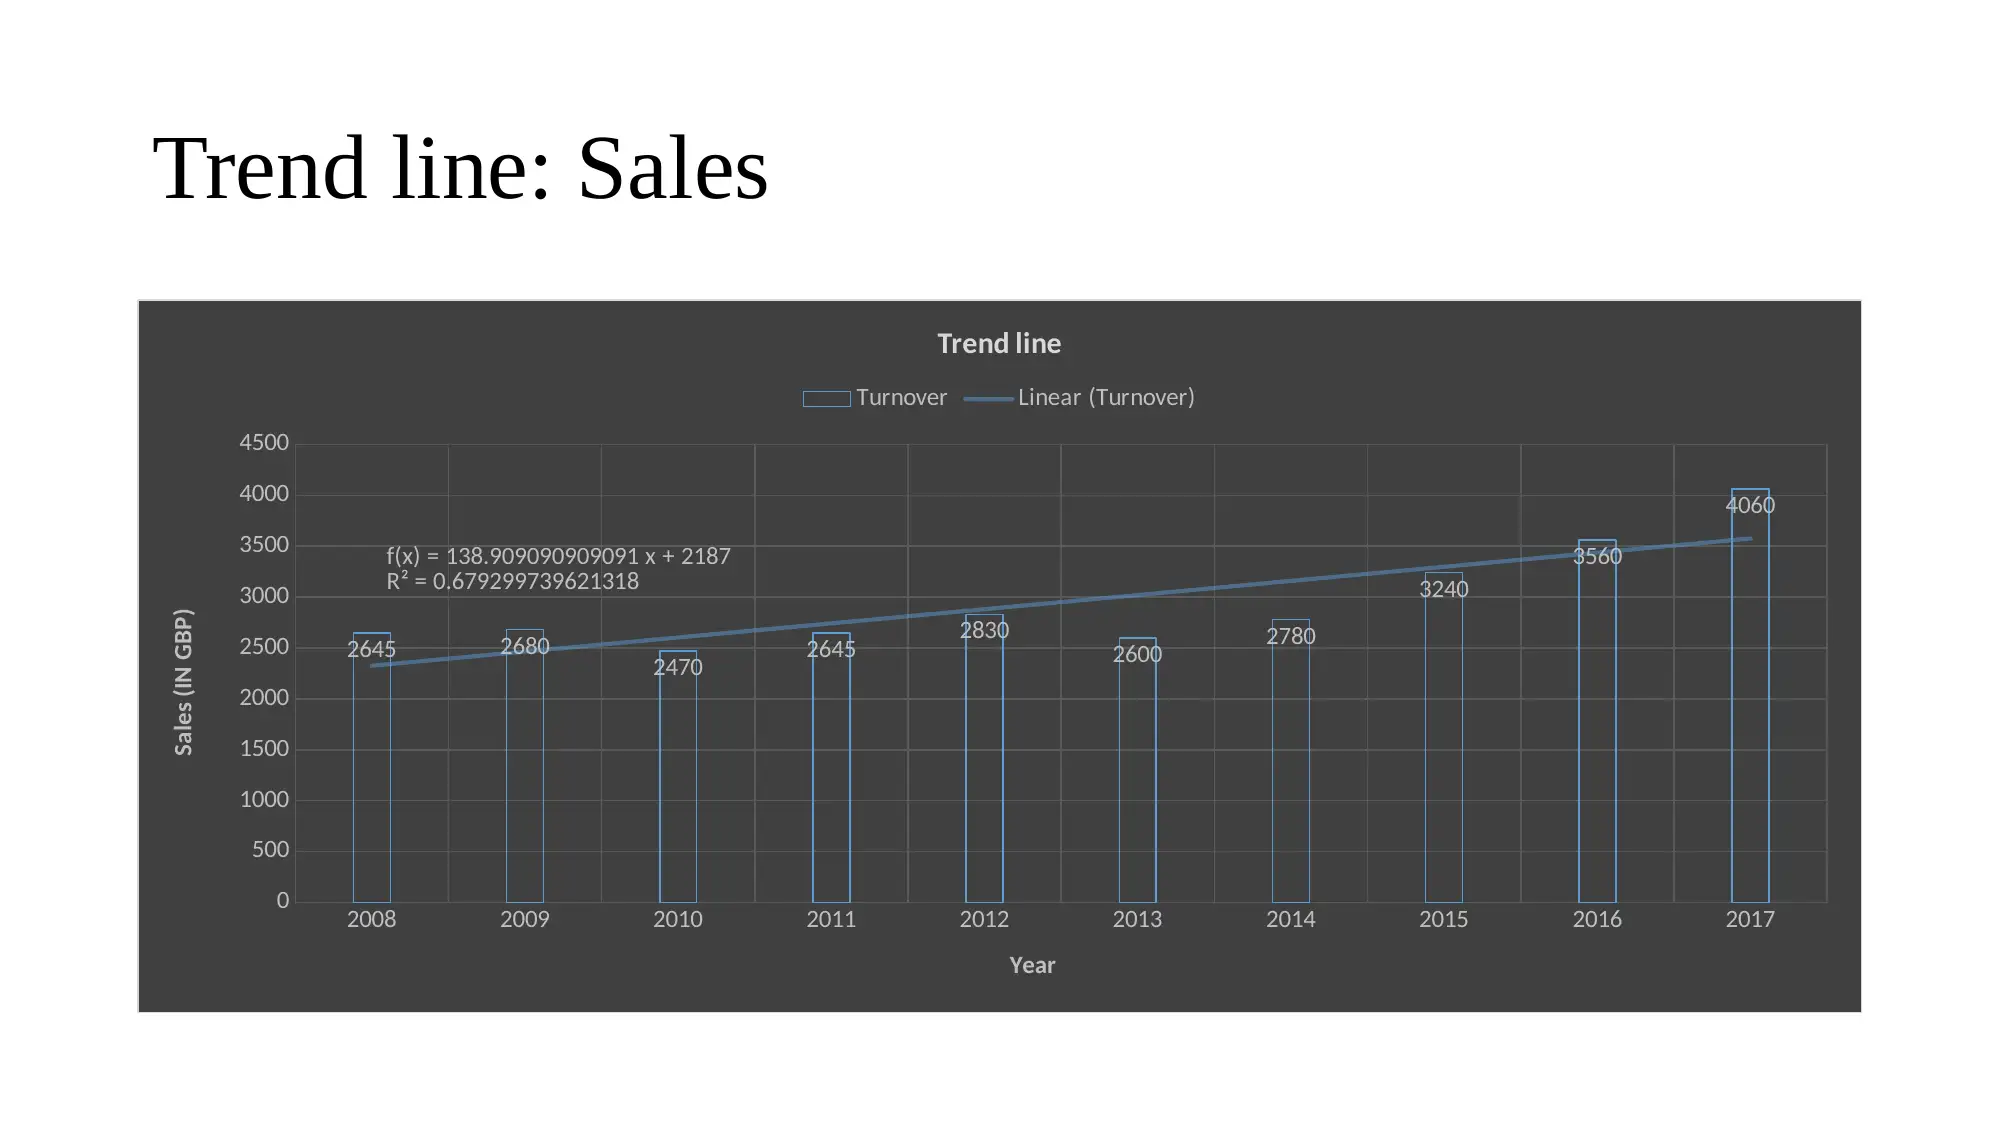
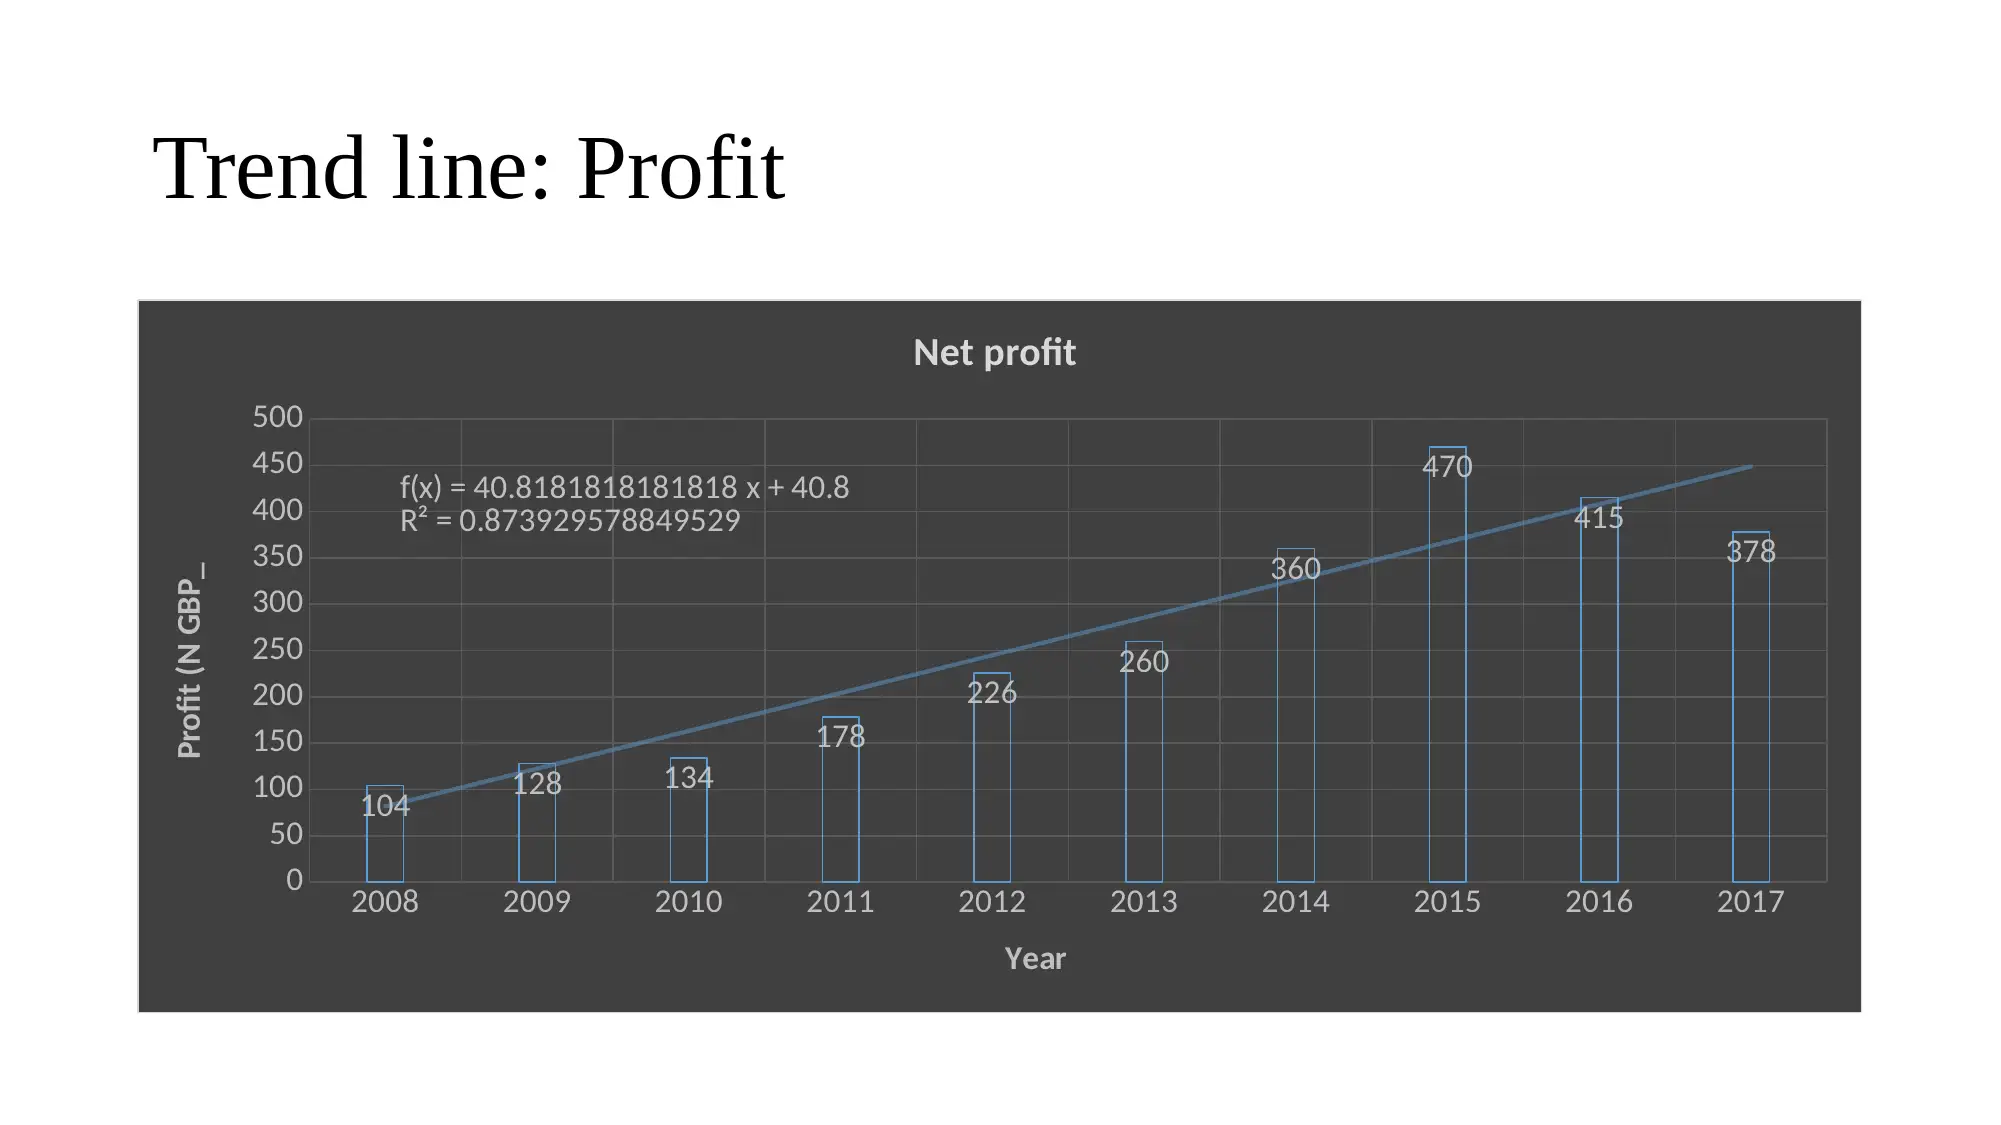
This report provides a comprehensive analysis of the sales and profit performance of Balti Palace from 2008 to 2017. It includes raw sales and net profit data, presented in various graphical formats such as column, line, cluster, pie, and scatter diagrams. The report also incorporates trend lines to illustrate sales and profit trends over the years. The analysis aims to facilitate business decision-making by summarizing data, drawing conclusions, and using measures of dispersion to inform business strategies. The data is used to create information for decision making and is supported by the assignment brief which outlines the requirements of data collection, analysis and interpretation. This assignment provides a practical application of data analysis techniques in a business context, aiding in understanding business performance and trends.
Document Page
Business Decision Making
(Balti Palace: New branch in London)
tabler-icon-diamond-filled.svg

Paraphrase This Document

Need a fresh take? Get an instant paraphrase of this document with our AI Paraphraser
Document Page
Sales and Profit performance: Balti Palace
Year Sales/turnover Net profit
2008 2645 104
2009 2680 128
2010 2470 134
2011 2645 178
2012 2830 226
2013 2600 260
2014 2780 360
2015 3240 470
2016 3560 415
2017 4060 378
29510 2653.00
Document Page
Column graph
2008 2009 2010 2011 2012 2013 2014 2015 2016 2017
2645 2680 2470 2645 2830 2600 2780
3240
3560
4060
104 128 134 178 226 260 360 470 415 378
Sales and profit performance
Turnover Net profit
Document Page
Line graph
2008 2009 2010 2011 2012 2013 2014 2015 2016 2017
2645 2680
2470 2645 2830
2600 2780
3240
3560
4060
104 128 134 178 226 260 360 470 415 378
Sales and profit performance
Turnover Net profit
tabler-icon-diamond-filled.svg

Paraphrase This Document

Need a fresh take? Get an instant paraphrase of this document with our AI Paraphraser
Document Page
Cluster graph
2008 2009 2010 2011 2012 2013 2014 2015 2016 2017
0
500
1000
1500
2000
2500
3000
3500
4000
4500
0
50
100
150
200
250
300
350
400
450
500
Sales and profit performance
Turnover Net profit
Year
SAlES (IN GBP)
PROFIT ( IN GBP)
Document Page
Pie Graph
2645
2680
2470
2645
2830
2600
2780
3240
3560
4060
104 128
134
178
226
260
360
470
415
378
Sales and profit performance
2008
2009
2010
2011
2012
2013
2014
2015
2016
2017
Document Page
Scatter Diagram
2200 2400 2600 2800 3000 3200 3400 3600 3800 4000 4200
0
50
100
150
200
250
300
350
400
450
500
Scatter diagram
Sales (IN GBP)
Profit (IN GBP)
tabler-icon-diamond-filled.svg

Paraphrase This Document

Need a fresh take? Get an instant paraphrase of this document with our AI Paraphraser
Document Page
Trend line: Sales
2008 2009 2010 2011 2012 2013 2014 2015 2016 2017
0
500
1000
1500
2000
2500
3000
3500
4000
4500
2645 2680 2470 2645 2830 2600 2780
3240
3560
4060
f(x) = 138.909090909091 x + 2187
R² = 0.679299739621318
Trend line
Turnover Linear (Turnover)
Year
Sales (IN GBP)
Document Page
Trend line: Profit
2008 2009 2010 2011 2012 2013 2014 2015 2016 2017
0
50
100
150
200
250
300
350
400
450
500
104 128 134
178
226 260
360
470
415
378
f(x) = 40.8181818181818 x + 40.8
R² = 0.873929578849529
Net profit
Year
Profit (N GBP_
Document Page
Thank You!
chevron_up_icon
1 out of 10
circle_padding
hide_on_mobile
zoom_out_icon
[object Object]