HND Business Decision Making Report: Analysis of Food for Friends

Verified

Added on  2023/03/22

|12
|426
|48
Report
AI Summary
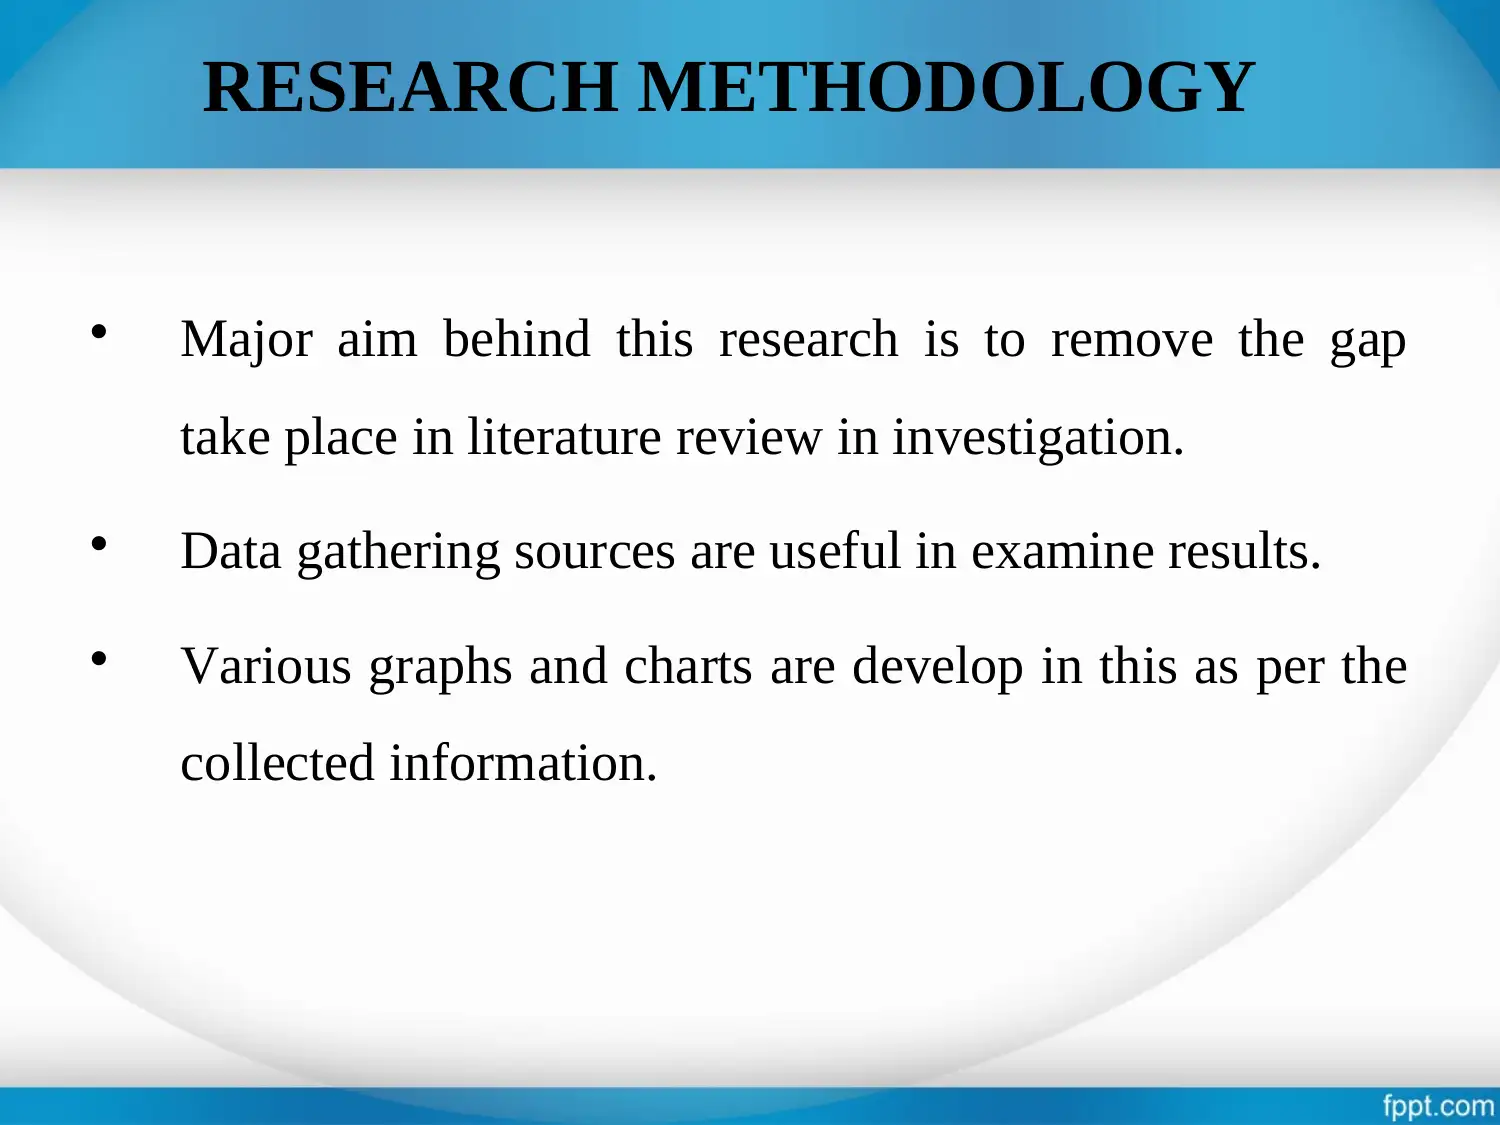
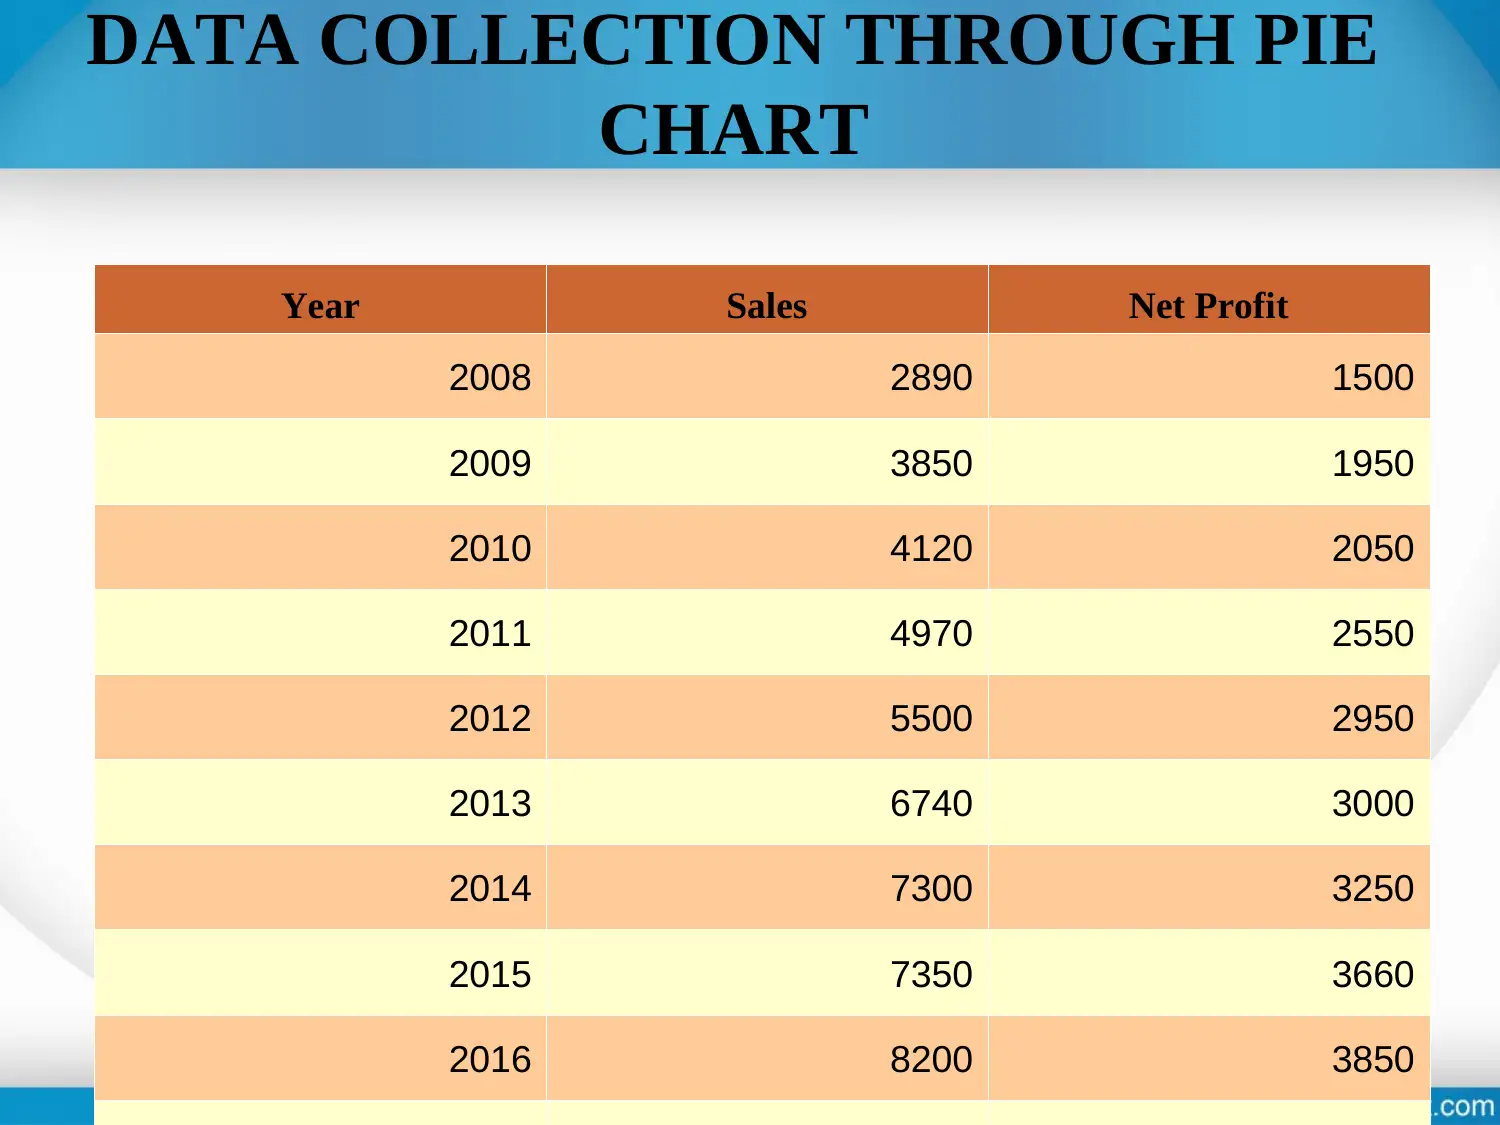
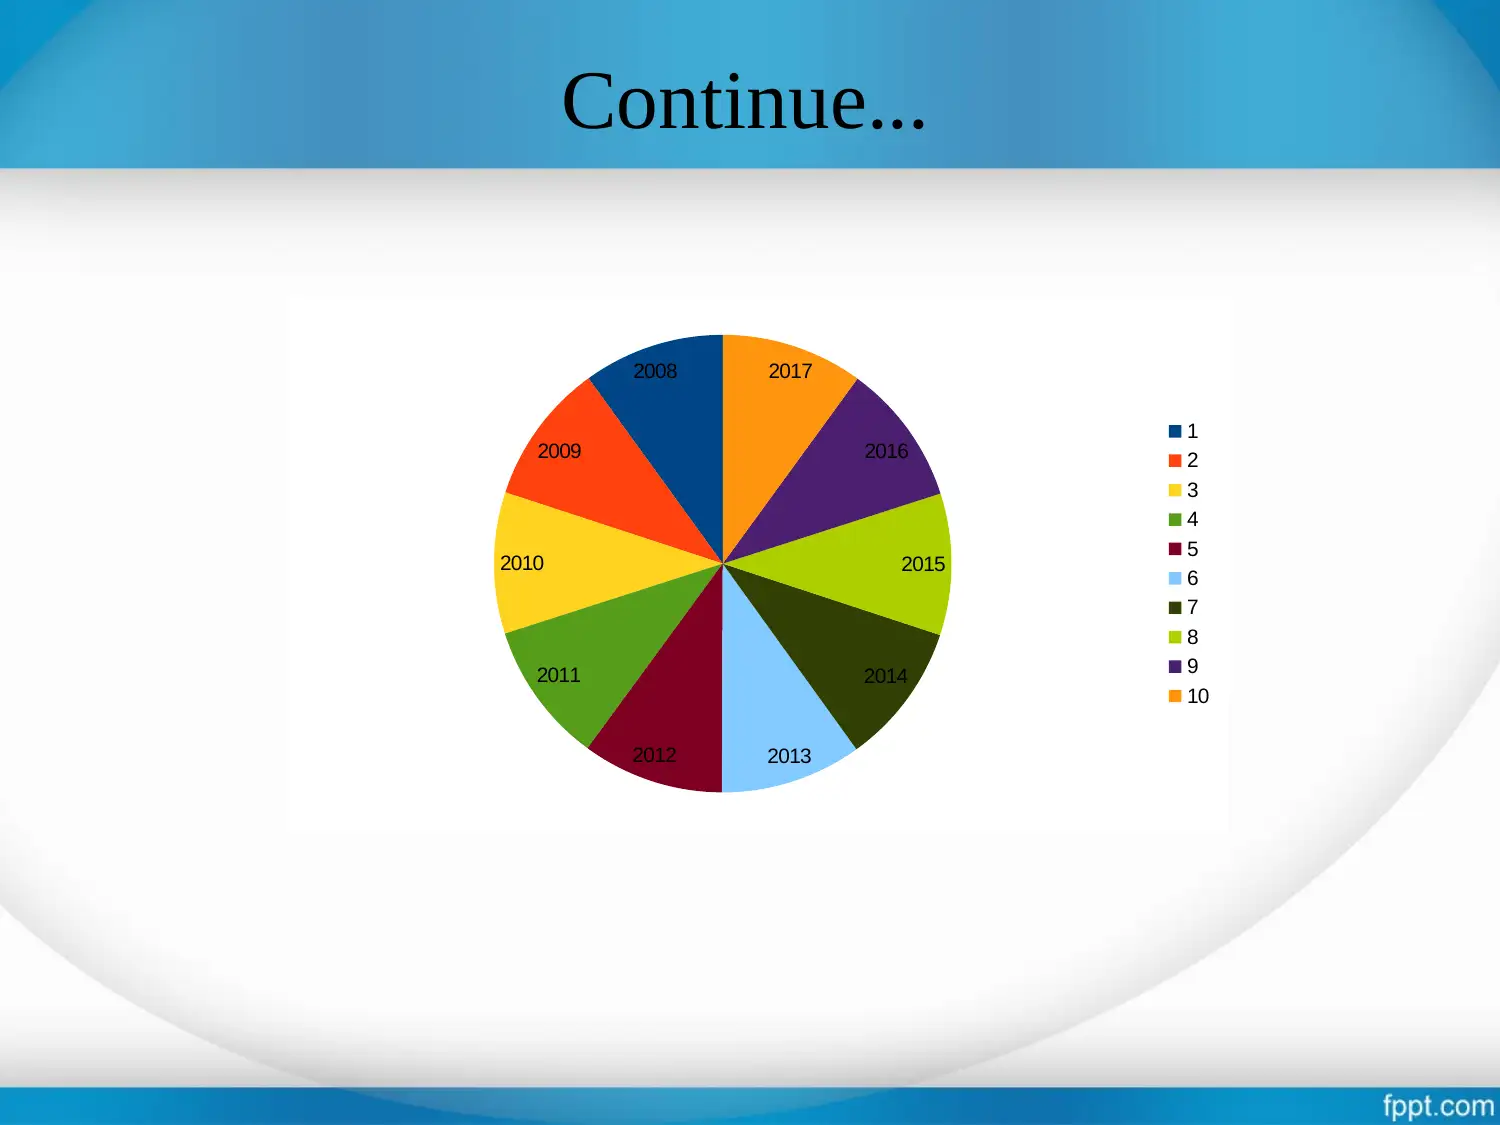
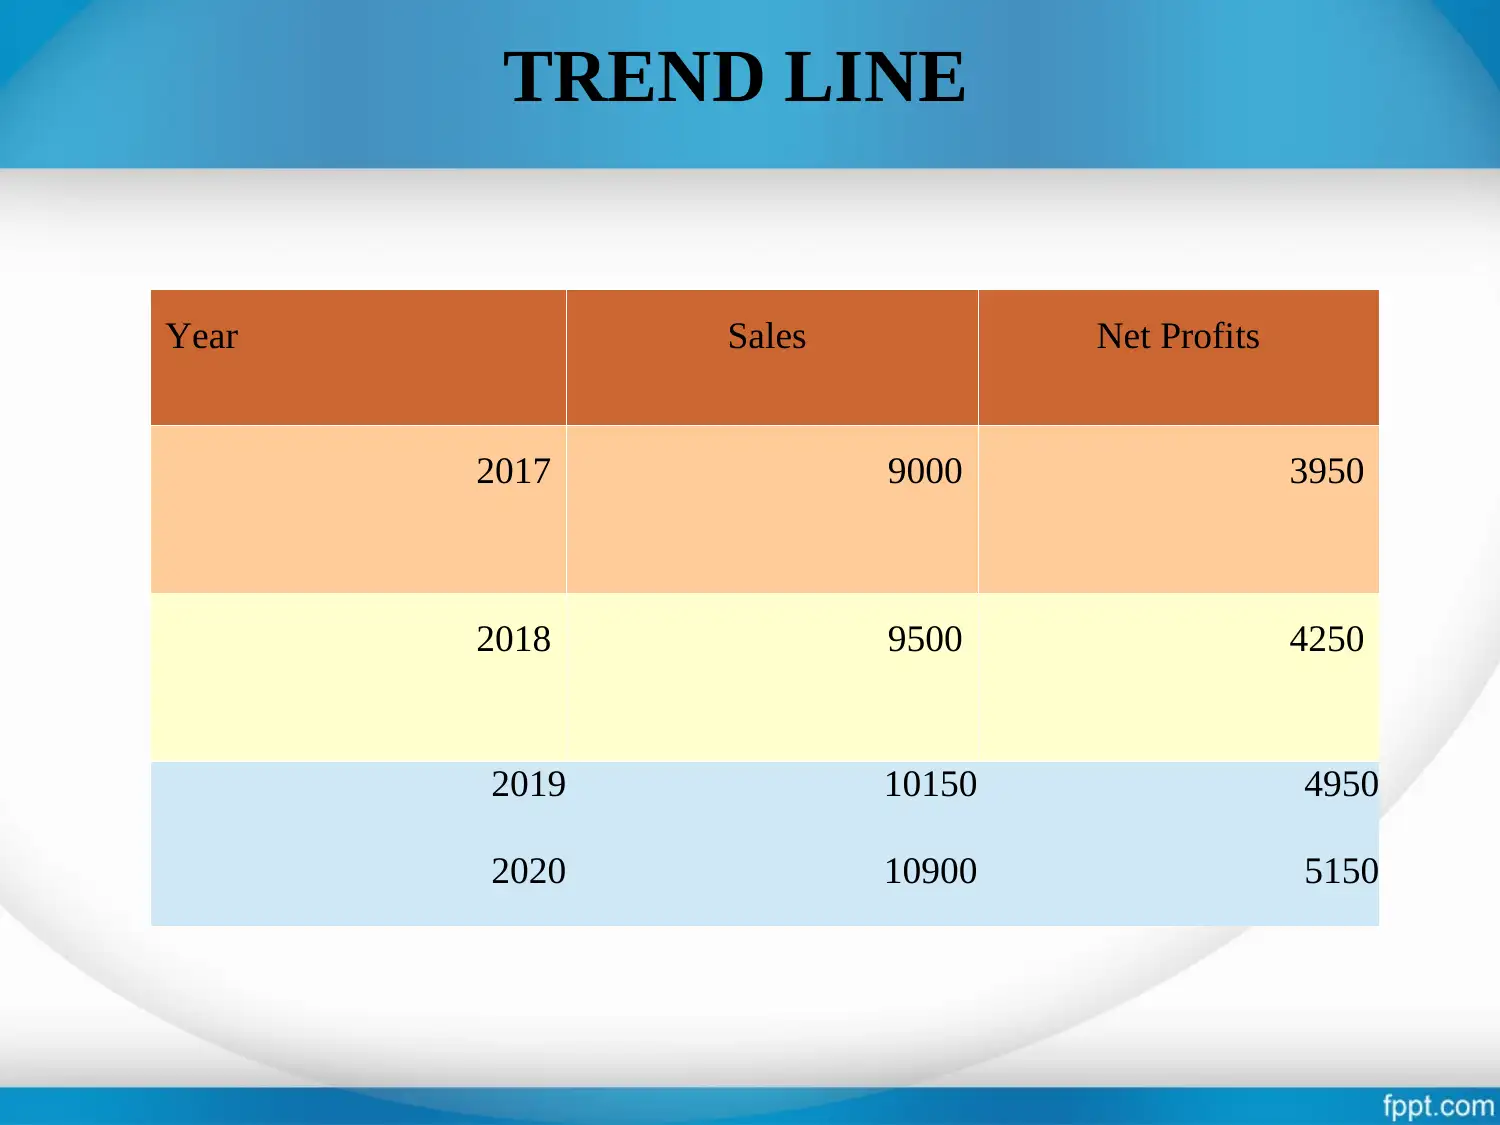
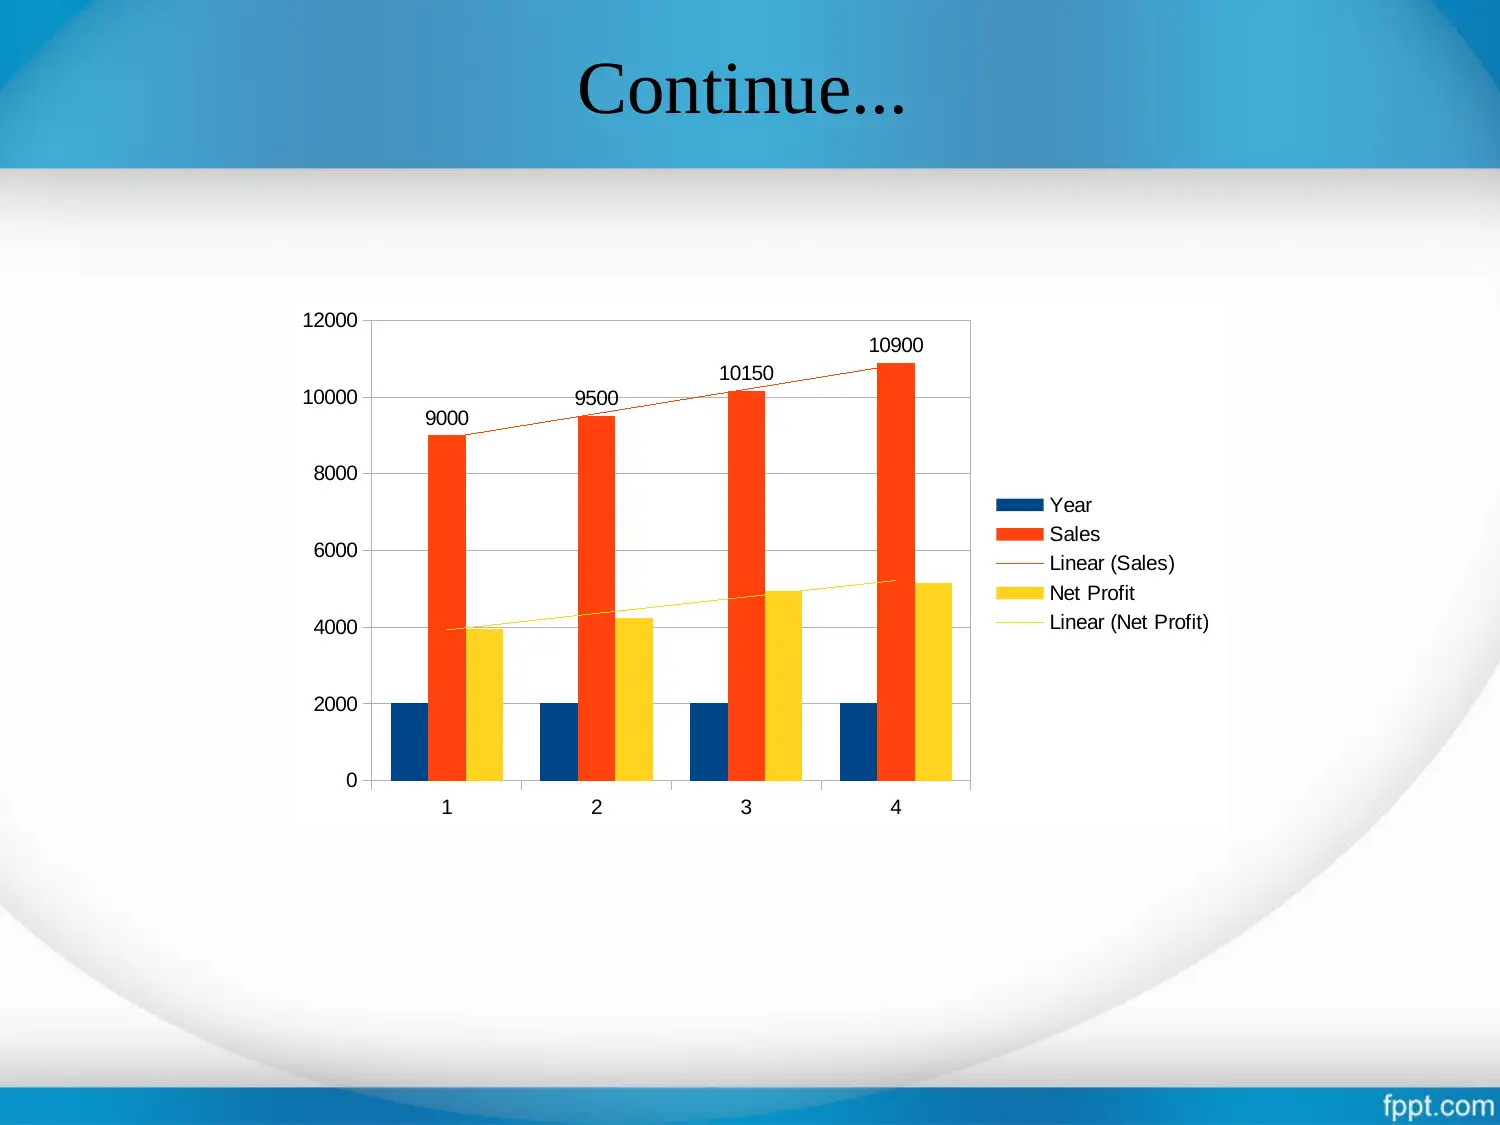
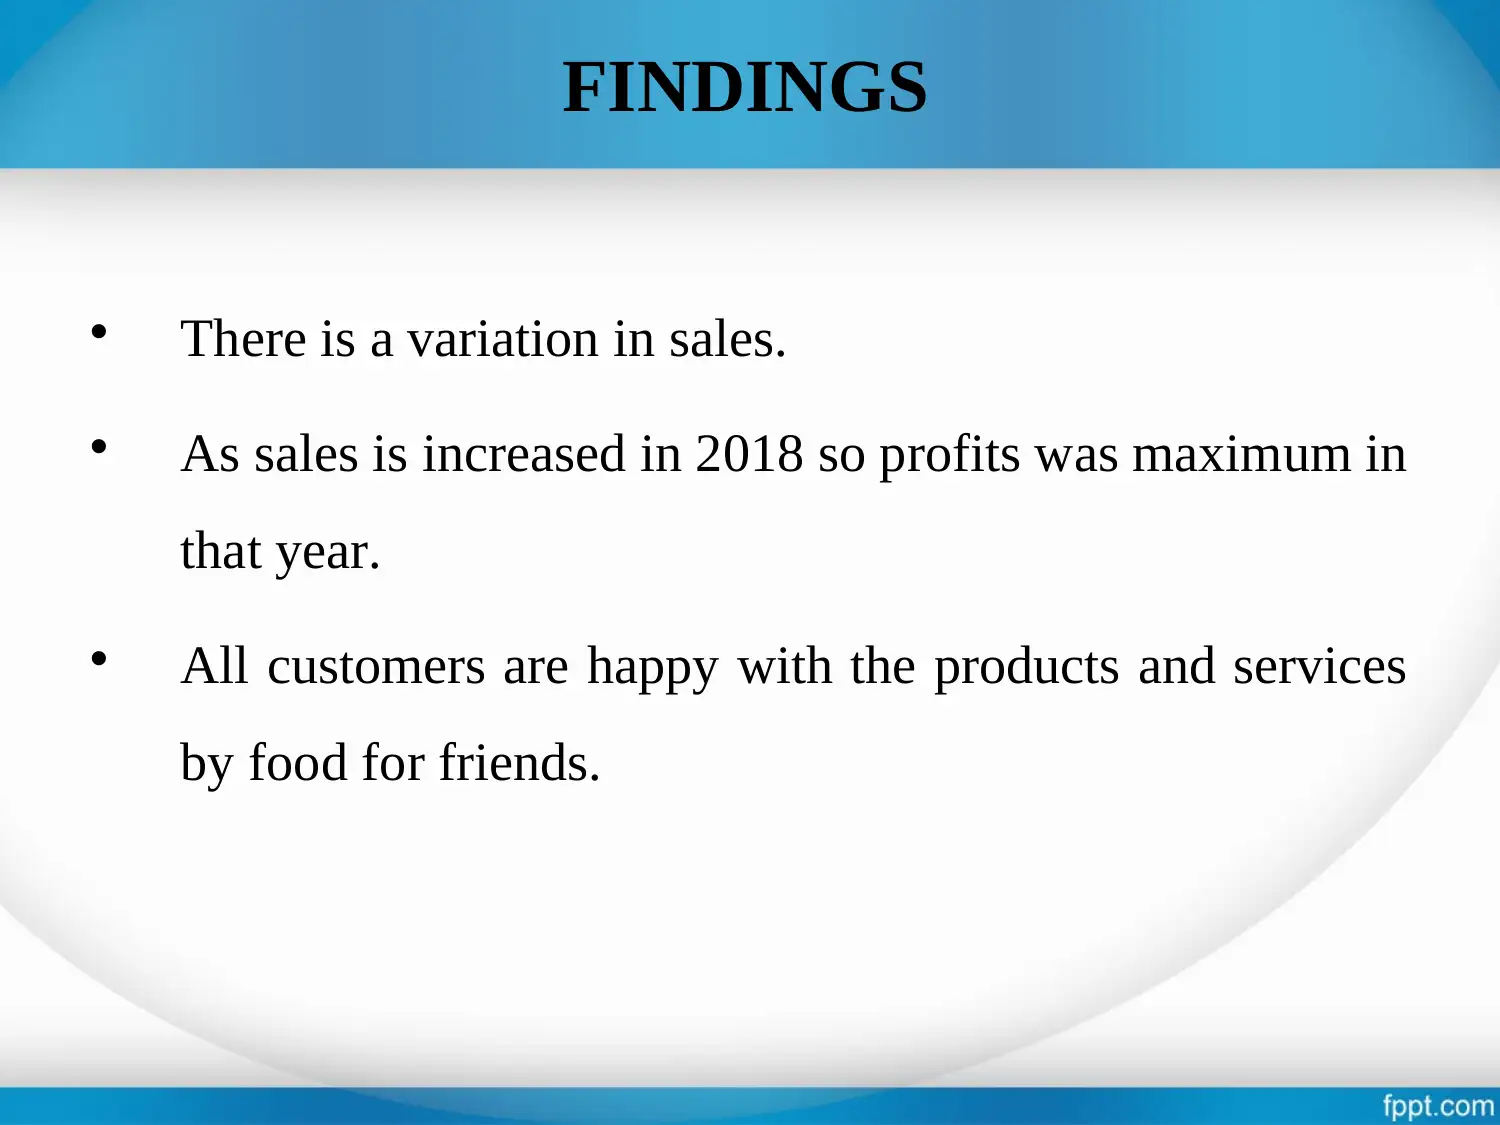
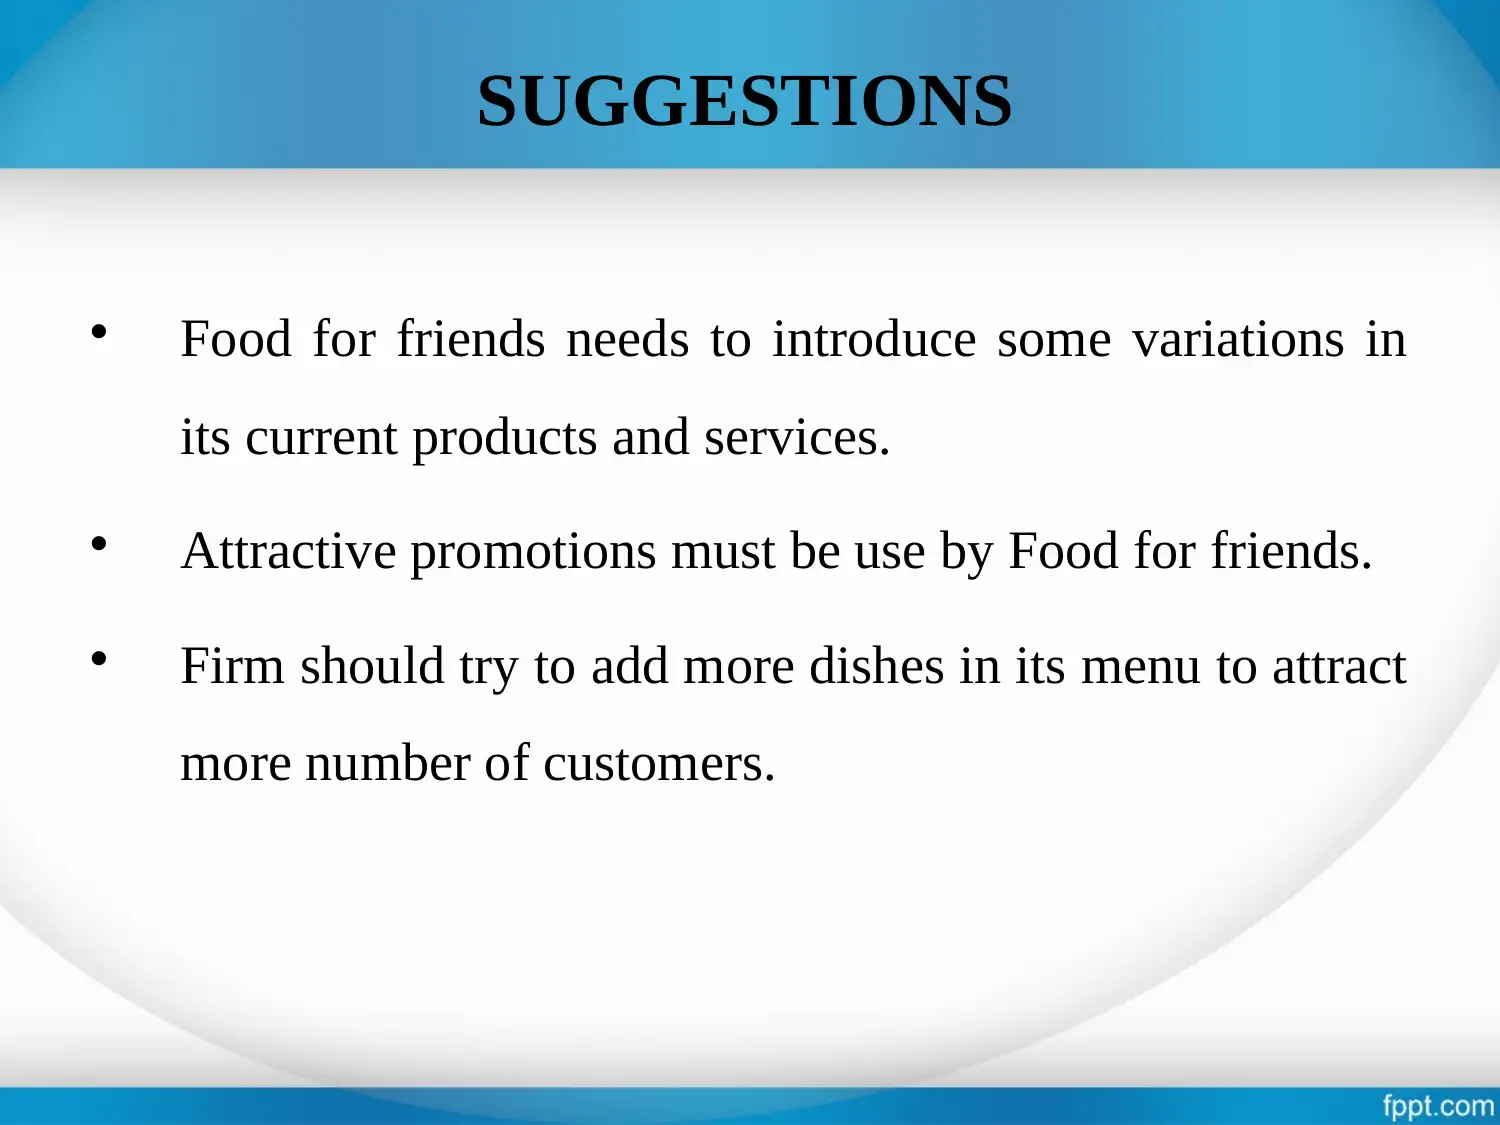
This report focuses on business decision-making, specifically analyzing data related to sales and net profits for the company 'Food for Friends.' The report begins with an introduction and objectives, followed by the research methodology, which includes data collection methods and the use of pie charts and trend lines to visualize data from 2008 to 2020. The findings highlight variations in sales and profit, with a correlation between increased sales and maximum profits in 2018. The report concludes with suggestions for Food for Friends, including product variations, promotional strategies, and menu expansions. References to relevant academic sources are also provided. This assignment is designed to provide insights into data analysis and business strategy.
Document Page
Business Decision
Making
(Task- 3.3)
tabler-icon-diamond-filled.svg

Paraphrase This Document

Need a fresh take? Get an instant paraphrase of this document with our AI Paraphraser
Document Page
Table Of Content
Introduction
Objectives
Research Methodology
Data Collection
Trend Line
Findings
Suggestions
References
Document Page
INTRODUCTION
Decision making is an important process which helps the
managers and business professionals to solve problems by
analysing alternative choices and selection of the best route
which is beneficial for organisation.
Document Page
OBJECTIVES
Major objectives of this research is to examine the views
and experience of customers related with the products and
services offered by food for friends. Further to known
how firm can expand its business operation in London in
an effective manner.
tabler-icon-diamond-filled.svg

Paraphrase This Document

Need a fresh take? Get an instant paraphrase of this document with our AI Paraphraser
Document Page
RESEARCH METHODOLOGY
Major aim behind this research is to remove the gap
take place in literature review in investigation.
Data gathering sources are useful in examine results.
Various graphs and charts are develop in this as per the
collected information.
Document Page
DATA COLLECTION THROUGH PIE
CHART
Row 1 Row 2 Row 3 Row 4
0
2
4
6
8
10
12
Column 1
Column 2
Column 3
Year Sales Net Profit
2008 2890 1500
2009 3850 1950
2010 4120 2050
2011 4970 2550
2012 5500 2950
2013 6740 3000
2014 7300 3250
2015 7350 3660
2016 8200 3850
Document Page
Continue...
2008
2009
2010
2011
2012 2013
2014
2015
2016
2017
1
2
3
4
5
6
7
8
9
10
tabler-icon-diamond-filled.svg

Paraphrase This Document

Need a fresh take? Get an instant paraphrase of this document with our AI Paraphraser
Document Page
TREND LINE
Year Sales Net Profits
2017 9000 3950
2018 9500 4250
2019 10150 4950
2020 10900 5150
Document Page
Continue...
1 2 3 4
0
2000
4000
6000
8000
10000
12000
9000 9500
10150
10900
Year
Sales
Linear (Sales)
Net Profit
Linear (Net Profit)
Document Page
FINDINGS
There is a variation in sales.
As sales is increased in 2018 so profits was maximum in
that year.
All customers are happy with the products and services
by food for friends.
tabler-icon-diamond-filled.svg

Paraphrase This Document

Need a fresh take? Get an instant paraphrase of this document with our AI Paraphraser
Document Page
SUGGESTIONS
Food for friends needs to introduce some variations in
its current products and services.
Attractive promotions must be use by Food for friends.
Firm should try to add more dishes in its menu to attract
more number of customers.
Document Page
REFERENCES
Ariely, D and Berns, G.S., 2010. Neuromarketing: the hope
and hype of neuroimaging in business. Nature reviews
neuroscience. 11(4). pp.284-292.
Casadesus-Masanell, R and Ricart, J.E., 2011. How to
design a winning business model. Harvard business
review. 89(1/2). pp.100-107.
chevron_up_icon
1 out of 12
circle_padding
hide_on_mobile
zoom_out_icon
[object Object]