Analysis of UKCBC Student Satisfaction and Experience Report (2017)

Verified

Added on  2023/03/29

|15
|481
|185
Report
AI Summary
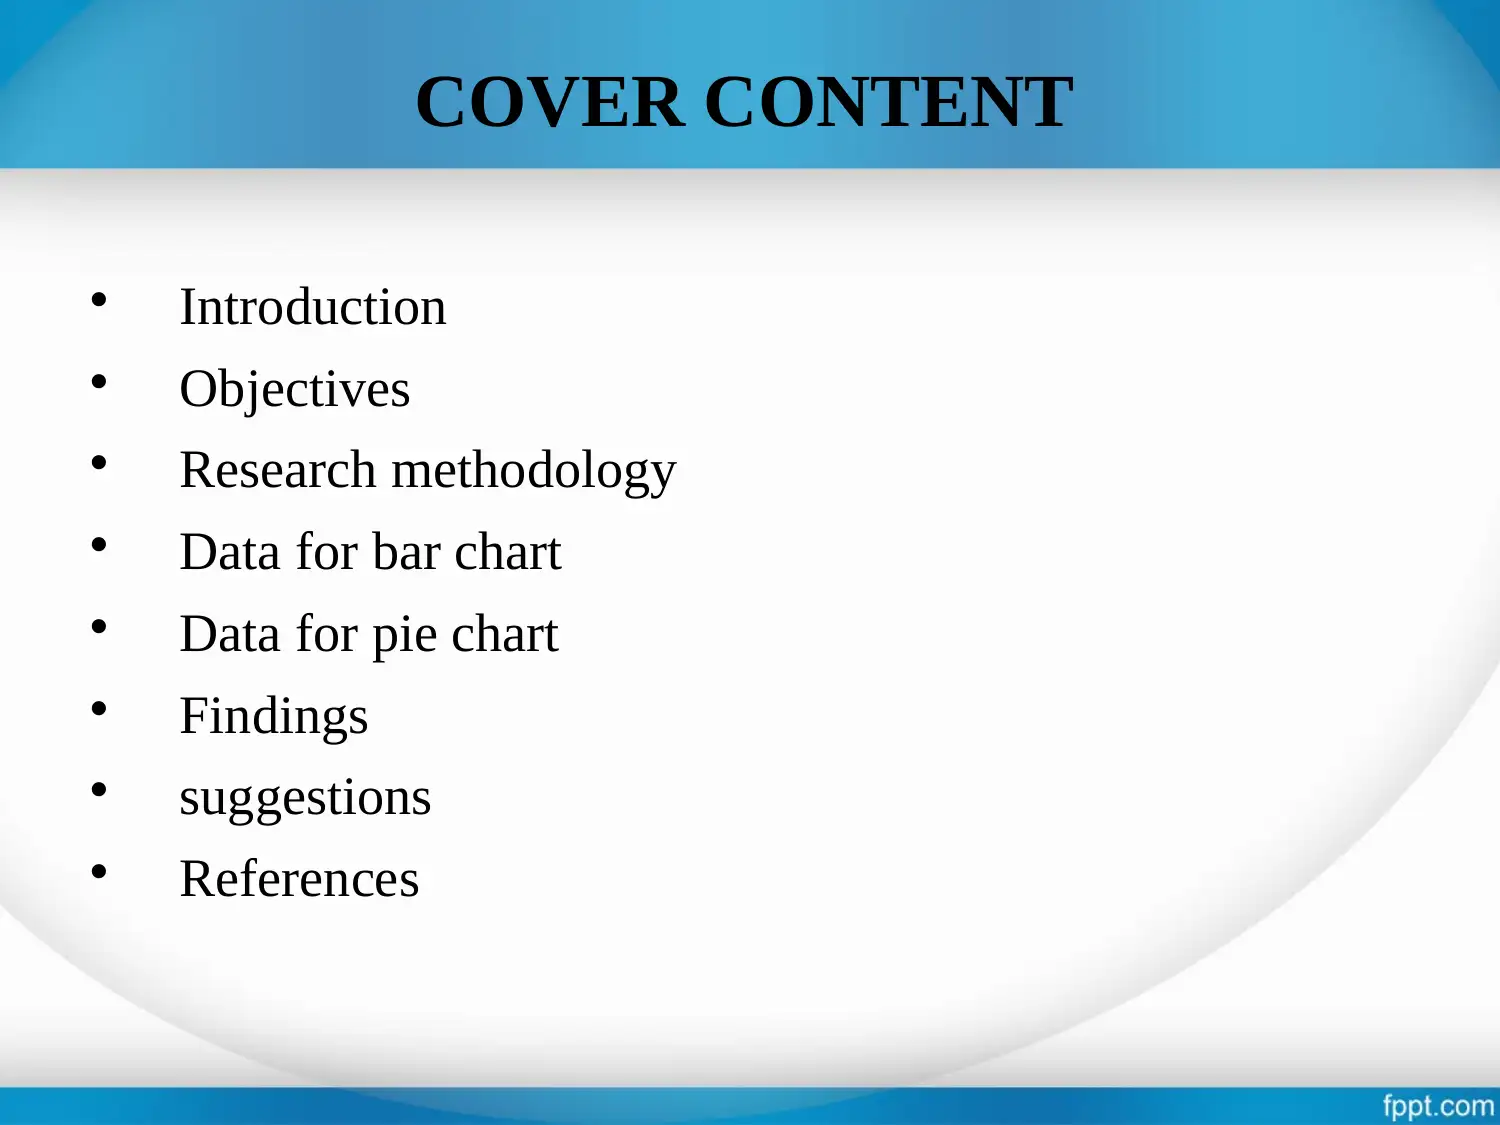
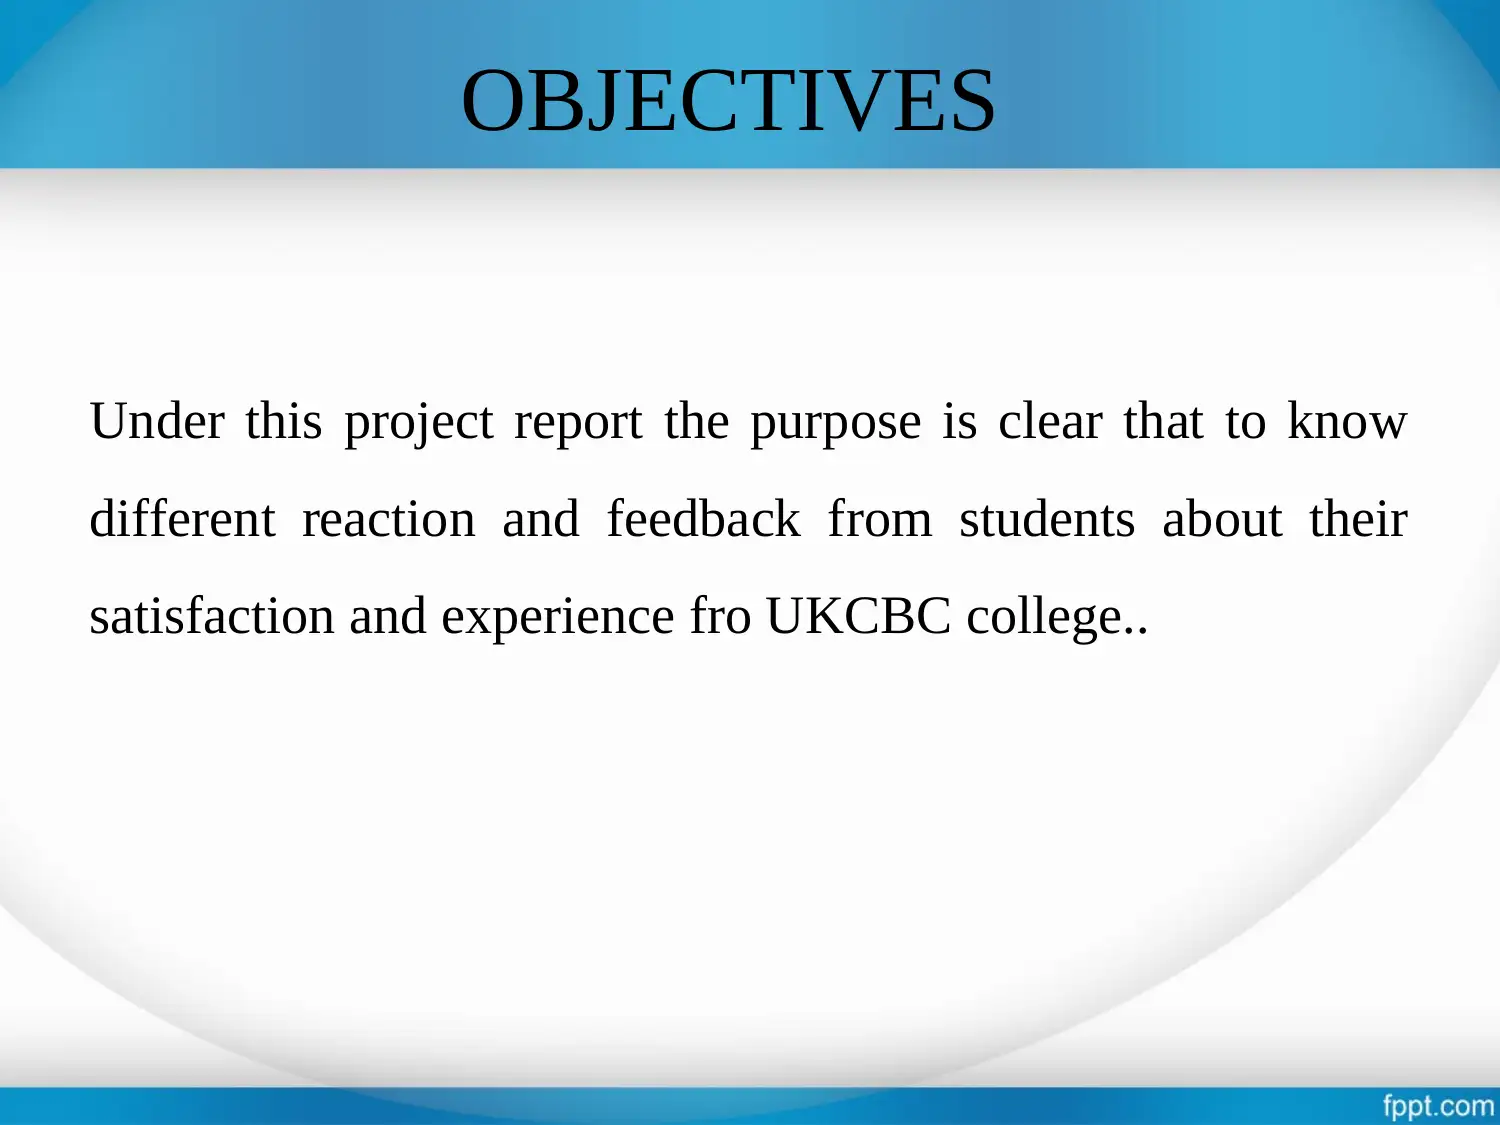
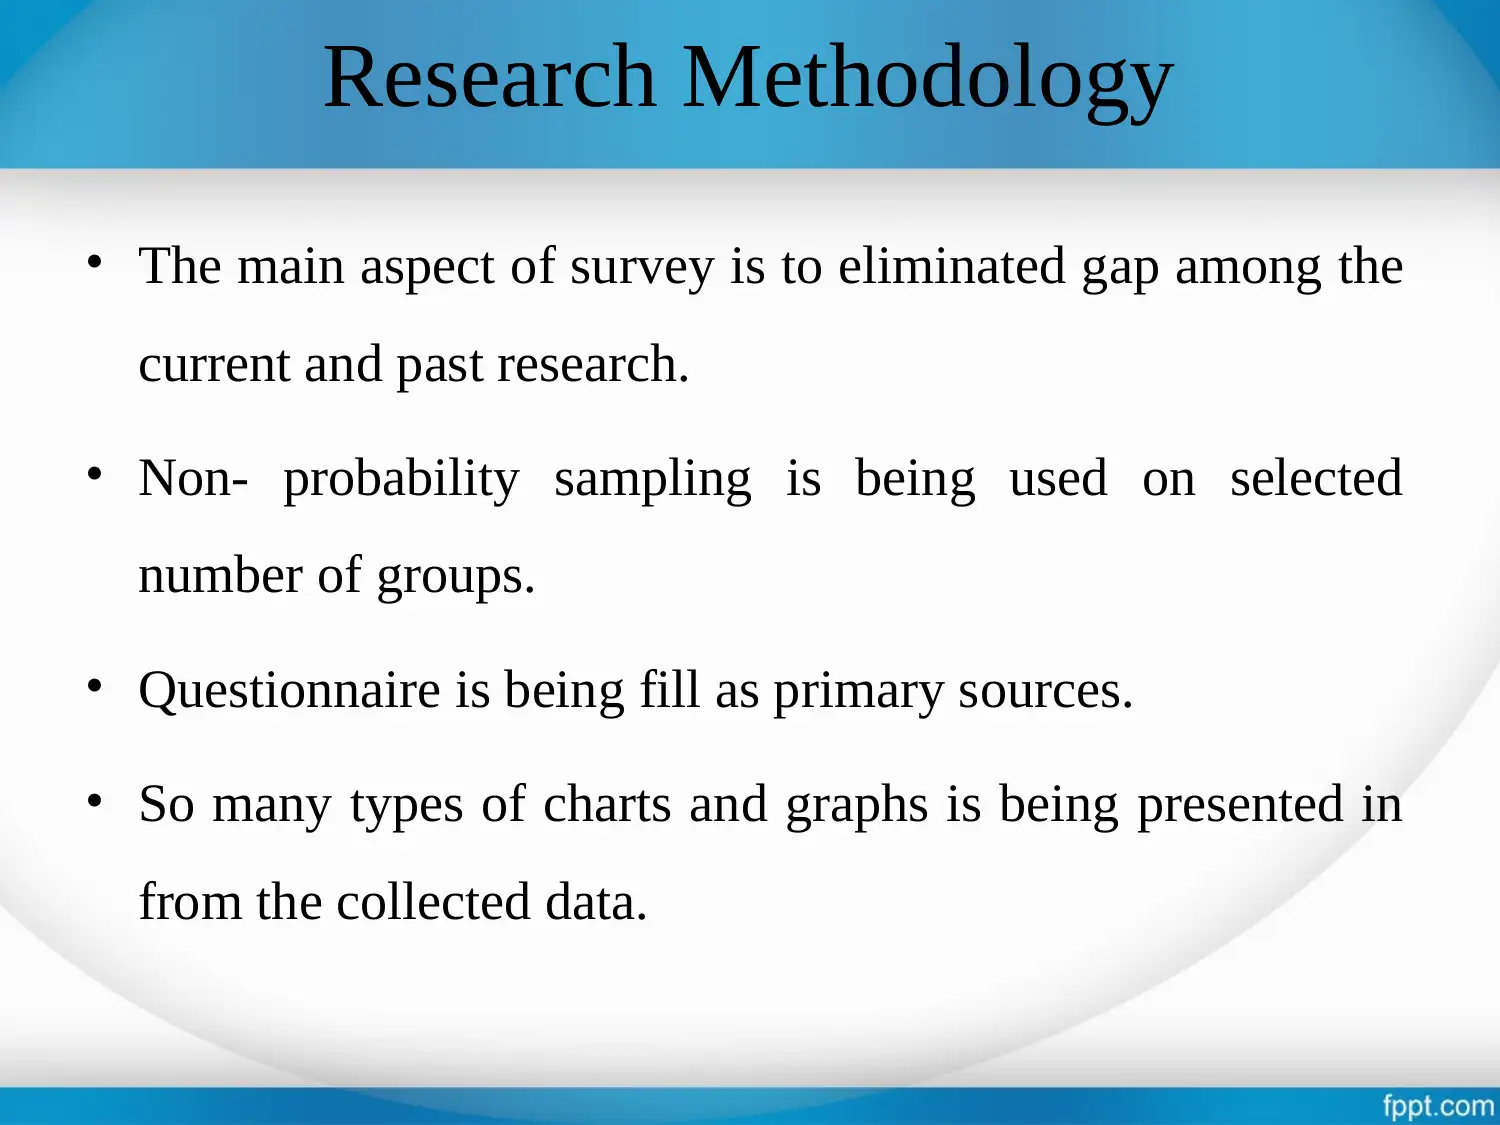
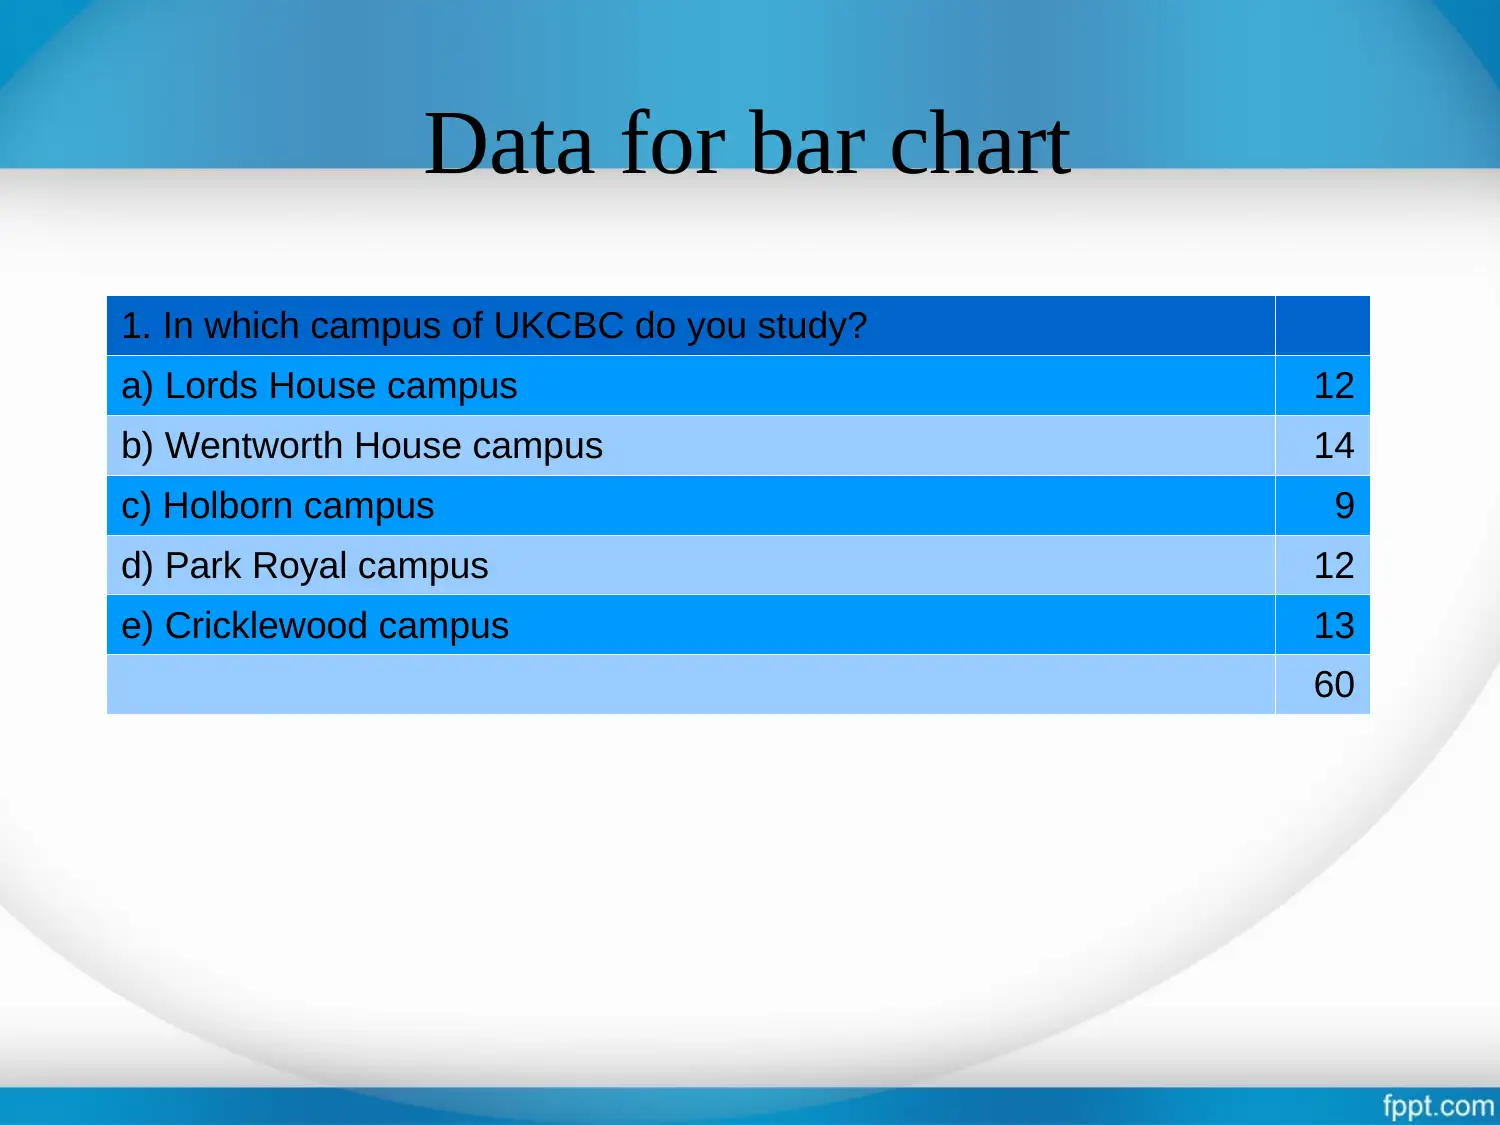
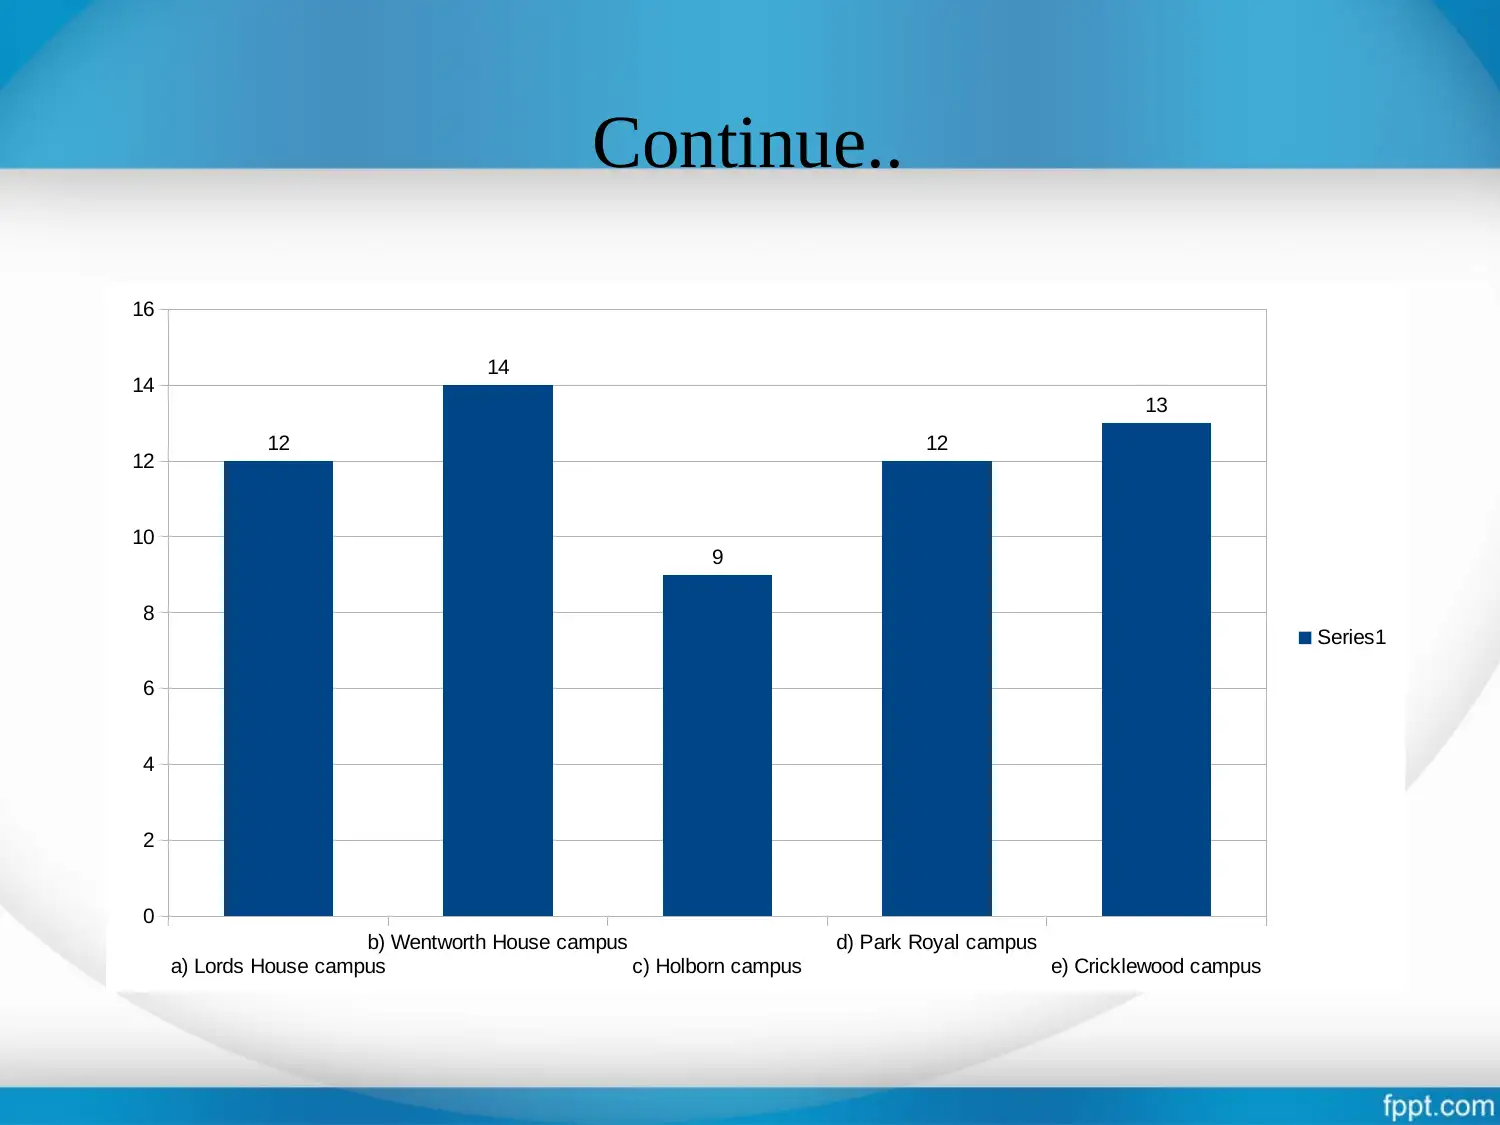
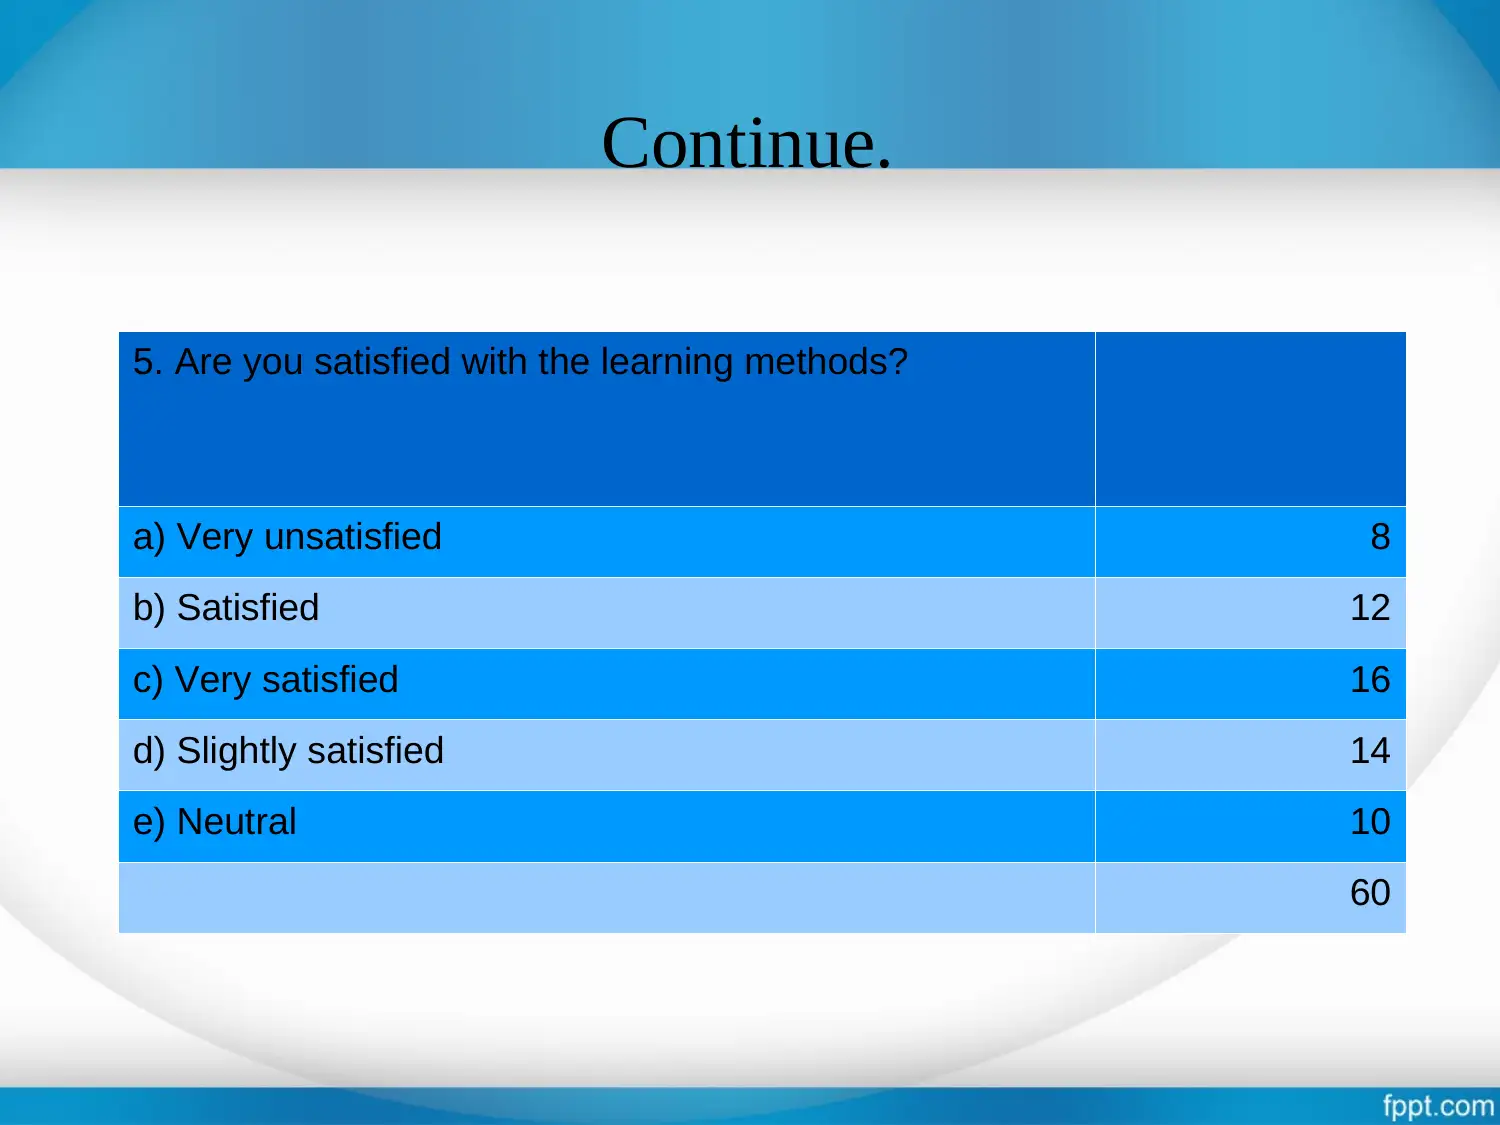
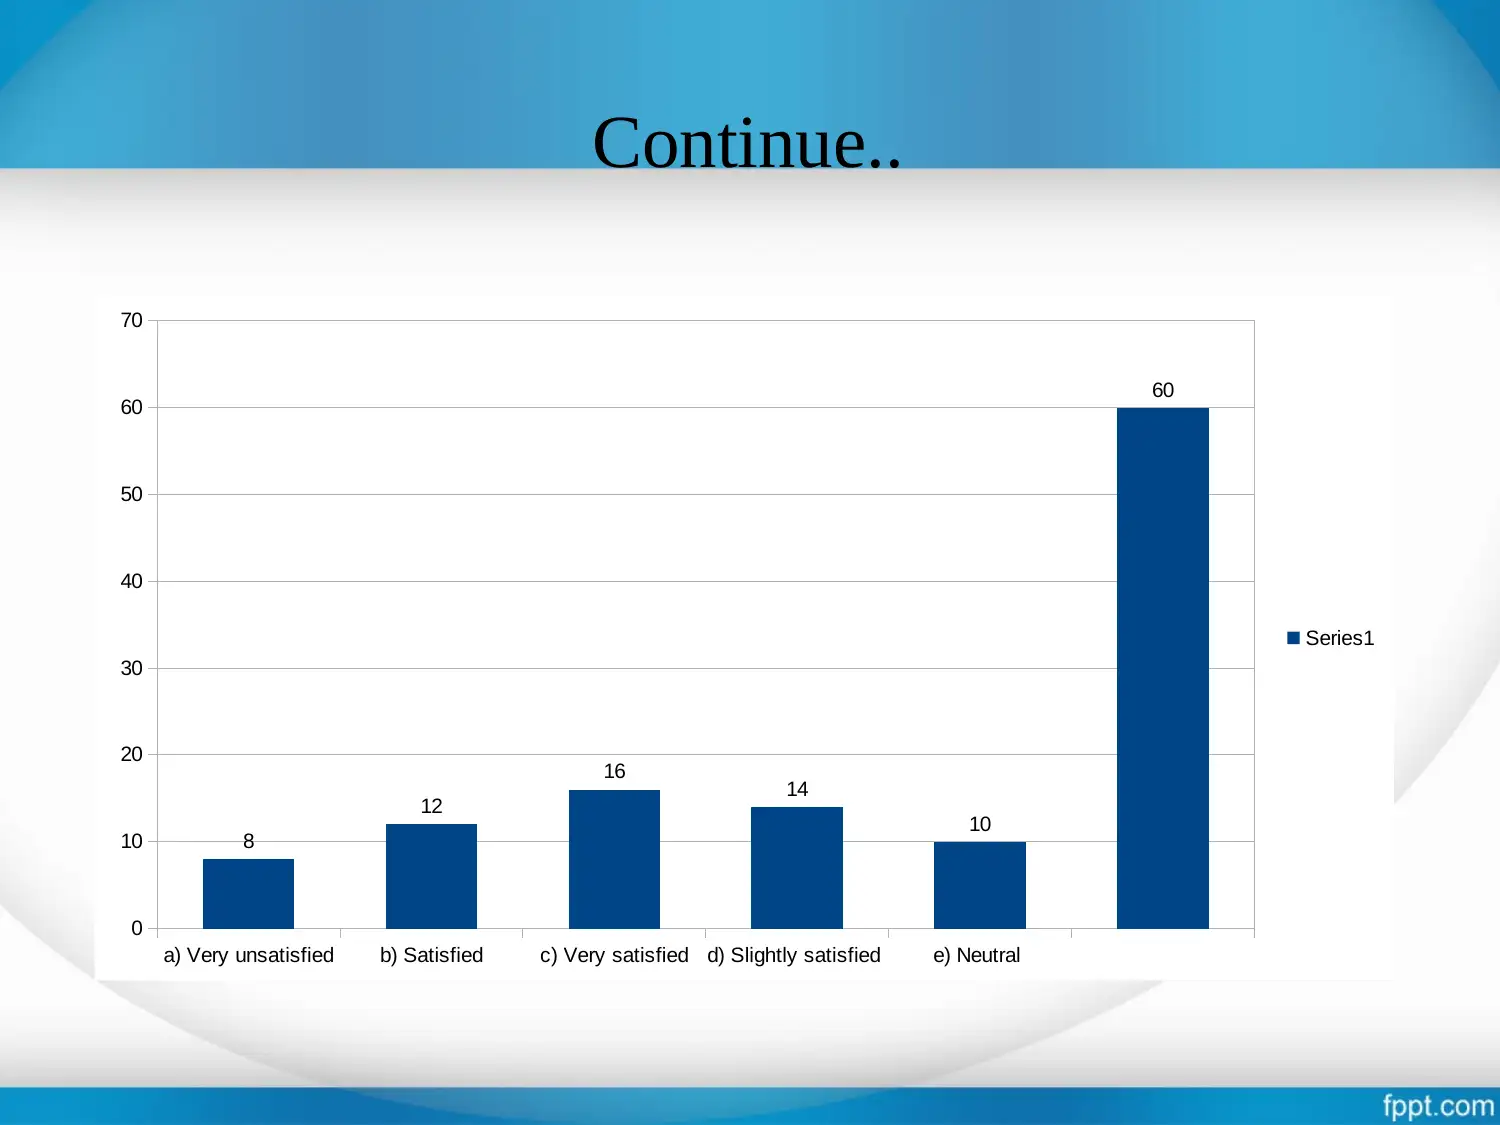
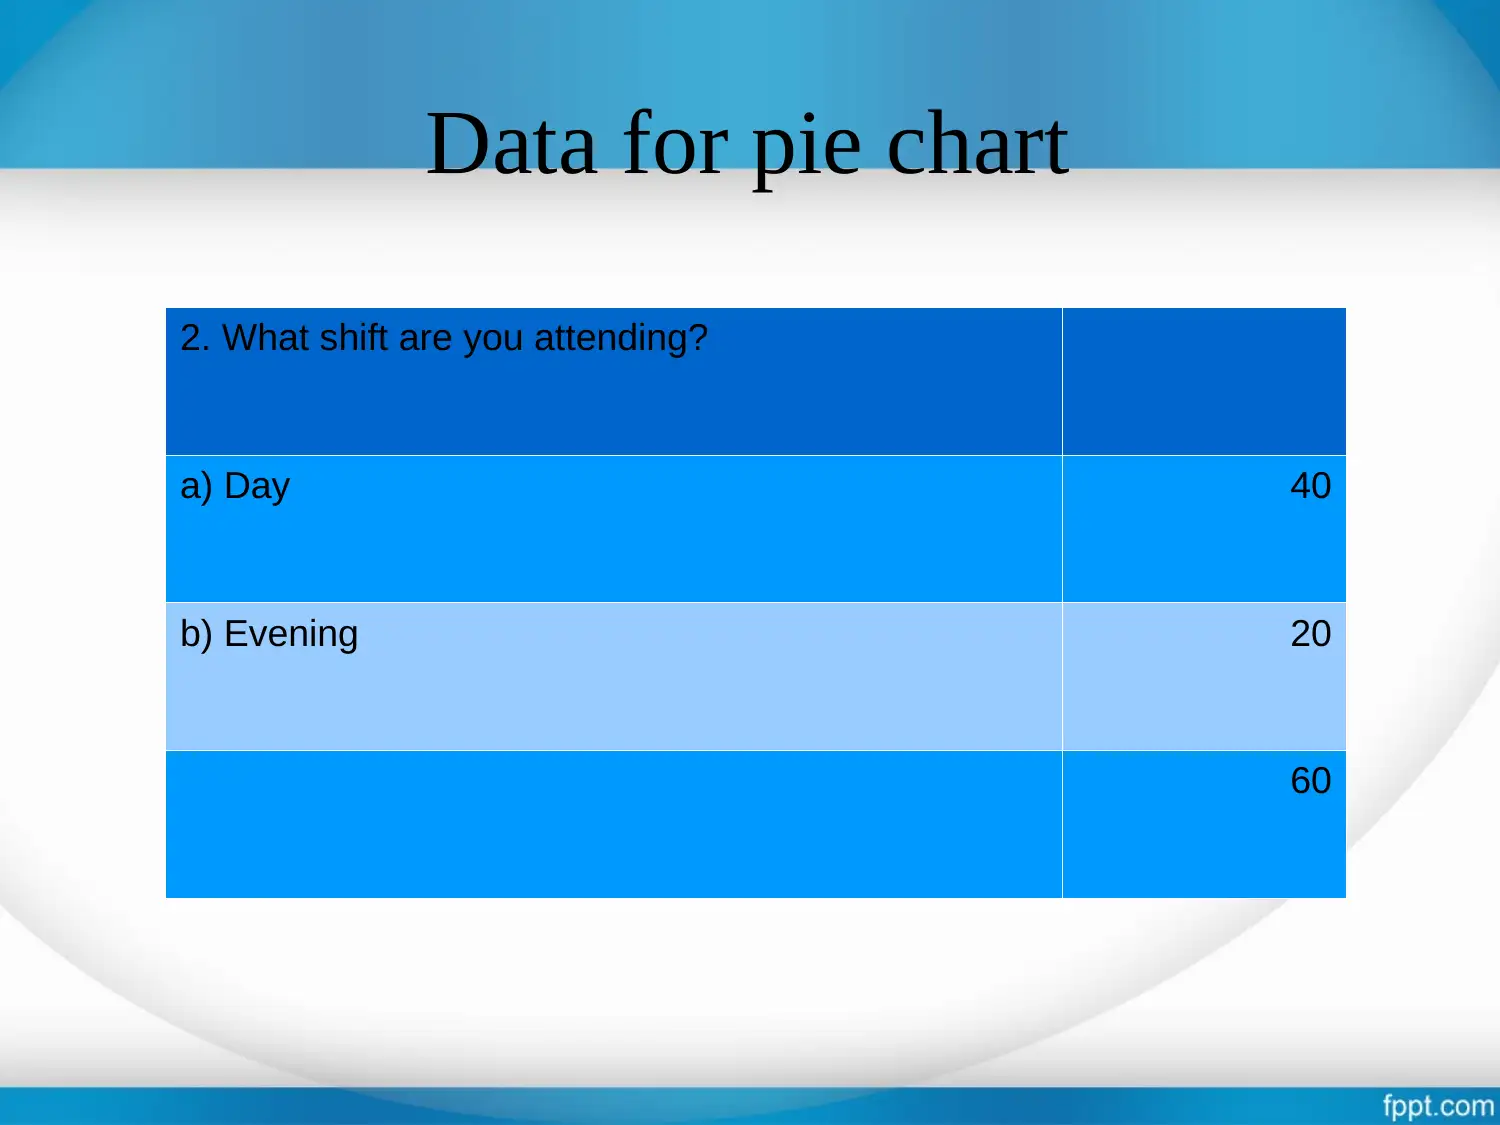
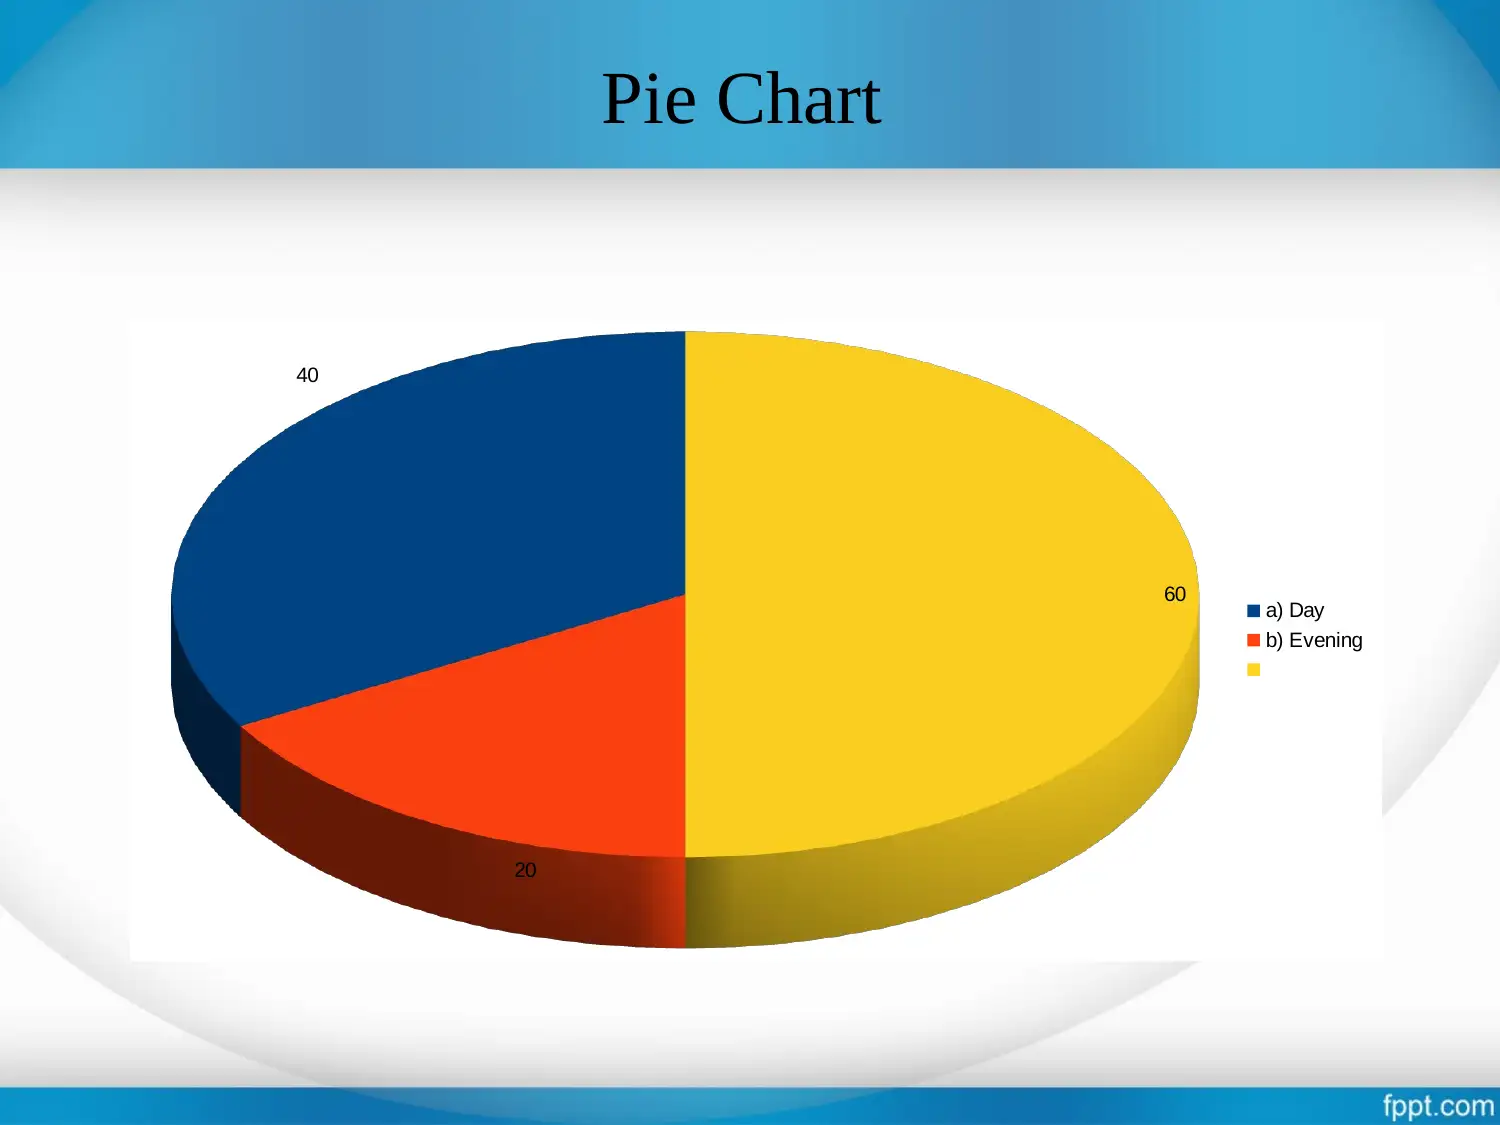
This report, created for a Business Decision Making assignment, analyzes student satisfaction and experience at UKCBC. The report includes an introduction, objectives, and a detailed research methodology involving a non-probability sampling approach using questionnaires. Data collected from various campuses is presented in bar and pie charts, highlighting student feedback on campus preferences, shift attendance, and satisfaction with learning methods. The findings indicate student interest and satisfaction with the college atmosphere, with suggestions for improvement including enhanced e-teaching facilities and tailored support for international students. The report concludes with a list of references.
Document Page
Business Decision
Making
Task 3 ( Part-C)
tabler-icon-diamond-filled.svg

Paraphrase This Document

Need a fresh take? Get an instant paraphrase of this document with our AI Paraphraser
Document Page
COVER CONTENT
Introduction
Objectives
Research methodology
Data for bar chart
Data for pie chart
Findings
suggestions
References
Document Page
INTRODUCTION
Business decision making is a techniques which is used by
an organisation in order to make effective decision in
order to achieve there aims and objectives.
Document Page
OBJECTIVES
Under this project report the purpose is clear that to know
different reaction and feedback from students about their
satisfaction and experience fro UKCBC college..
tabler-icon-diamond-filled.svg

Paraphrase This Document

Need a fresh take? Get an instant paraphrase of this document with our AI Paraphraser
Document Page
Research Methodology
The main aspect of survey is to eliminated gap among the
current and past research.
Non- probability sampling is being used on selected
number of groups.
Questionnaire is being fill as primary sources.
So many types of charts and graphs is being presented in
from the collected data.
Document Page
Data for bar chart
1. In which campus of UKCBC do you study?
a) Lords House campus 12
b) Wentworth House campus 14
c) Holborn campus 9
d) Park Royal campus 12
e) Cricklewood campus 13
60
Document Page
Continue..
a) Lords House campus
b) Wentworth House campus
c) Holborn campus
d) Park Royal campus
e) Cricklewood campus
0
2
4
6
8
10
12
14
16
12
14
9
12
13
Series1
tabler-icon-diamond-filled.svg

Paraphrase This Document

Need a fresh take? Get an instant paraphrase of this document with our AI Paraphraser
Document Page
Continue.
5. Are you satisfied with the learning methods?
a) Very unsatisfied 8
b) Satisfied 12
c) Very satisfied 16
d) Slightly satisfied 14
e) Neutral 10
60
Document Page
Continue..
a) Very unsatisfied b) Satisfied c) Very satisfied d) Slightly satisfied e) Neutral
0
10
20
30
40
50
60
70
8
12
16 14
10
60
Series1
Document Page
Data for pie chart
2. What shift are you attending?
a) Day 40
b) Evening 20
60
tabler-icon-diamond-filled.svg

Paraphrase This Document

Need a fresh take? Get an instant paraphrase of this document with our AI Paraphraser
Document Page
Pie Chart
40
20
60 a) Day
b) Evening
Document Page
FINDINGS
Students from different campuses are showing lot of
interest in college learning.
The graphs are indicating most number of student are
satisfies with college atmosphere
chevron_up_icon
1 out of 15
circle_padding
hide_on_mobile
zoom_out_icon
[object Object]