Business Decision Making (Unit 6) - Task 3.3 Report Analysis

Verified

Added on  2023/03/22

|18
|452
|20
Report
AI Summary
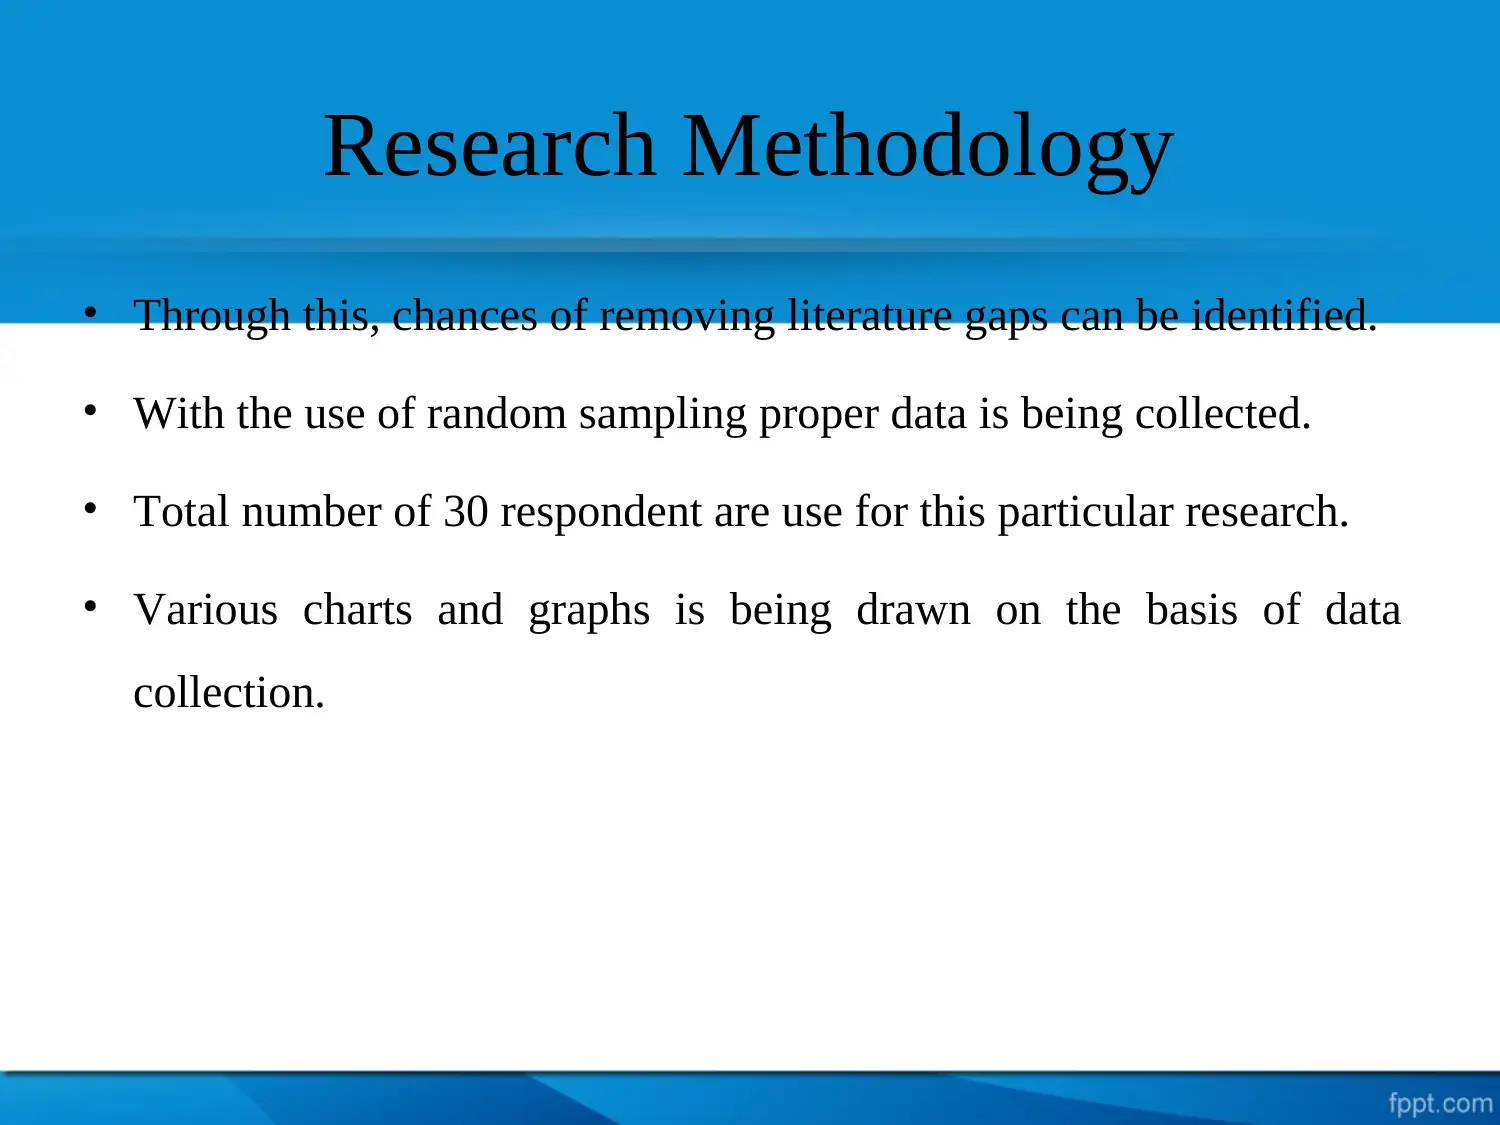
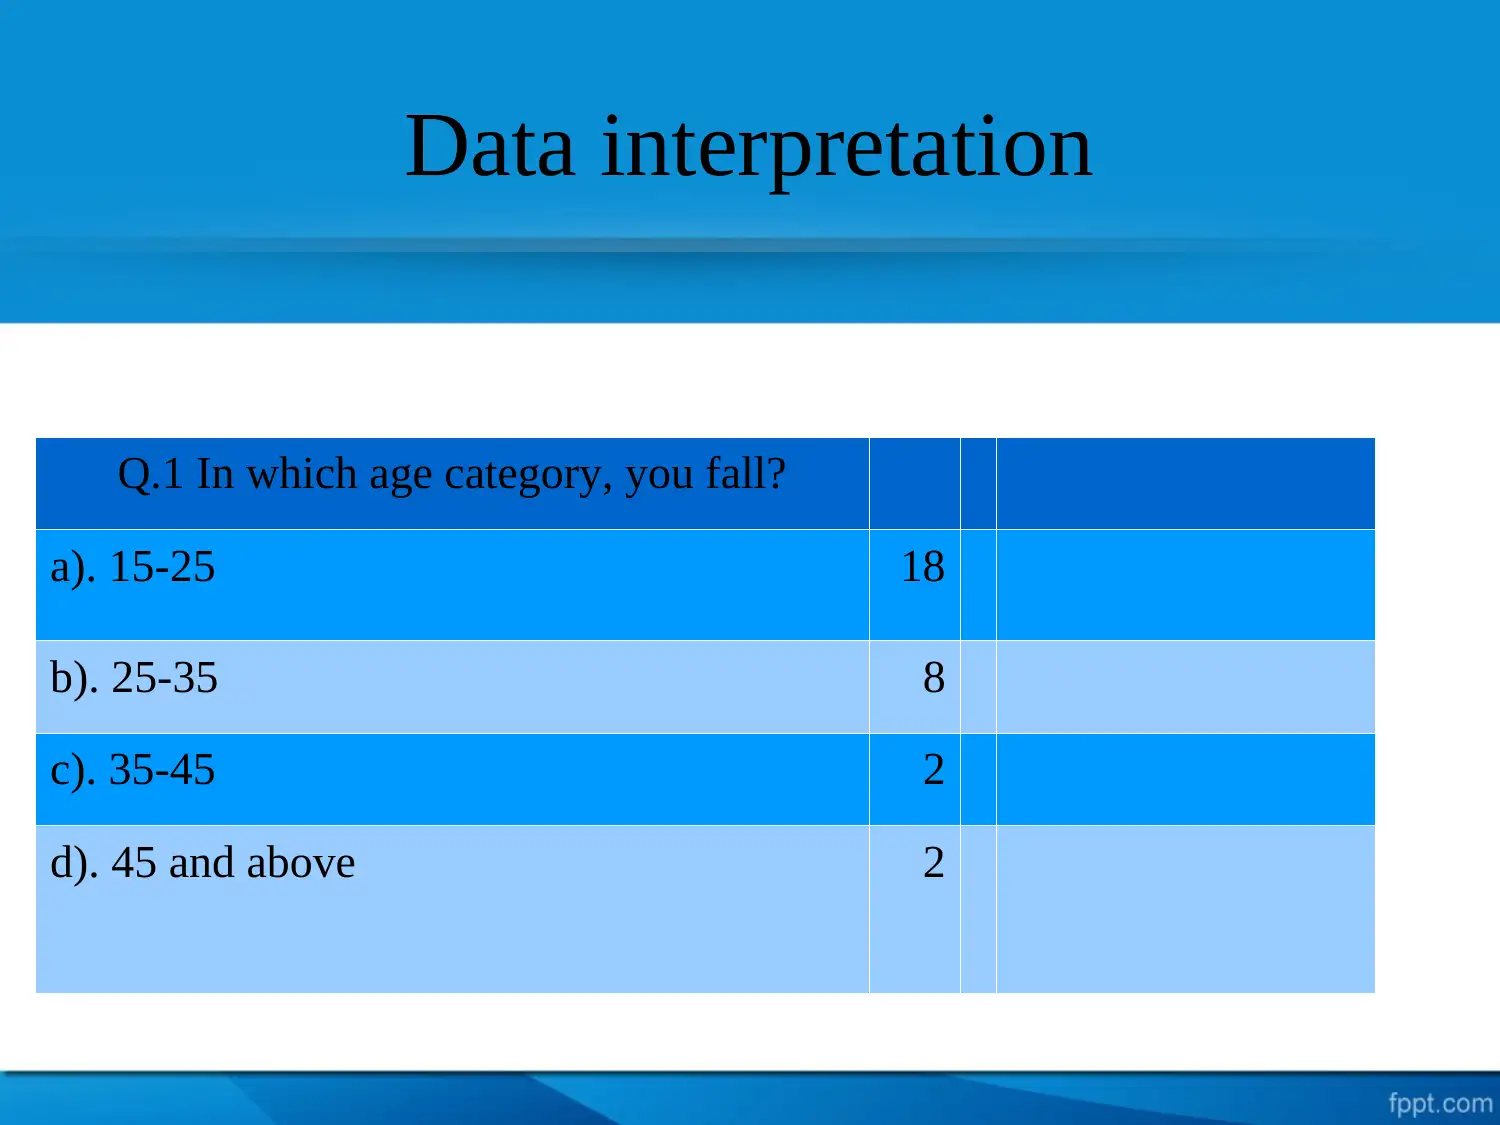
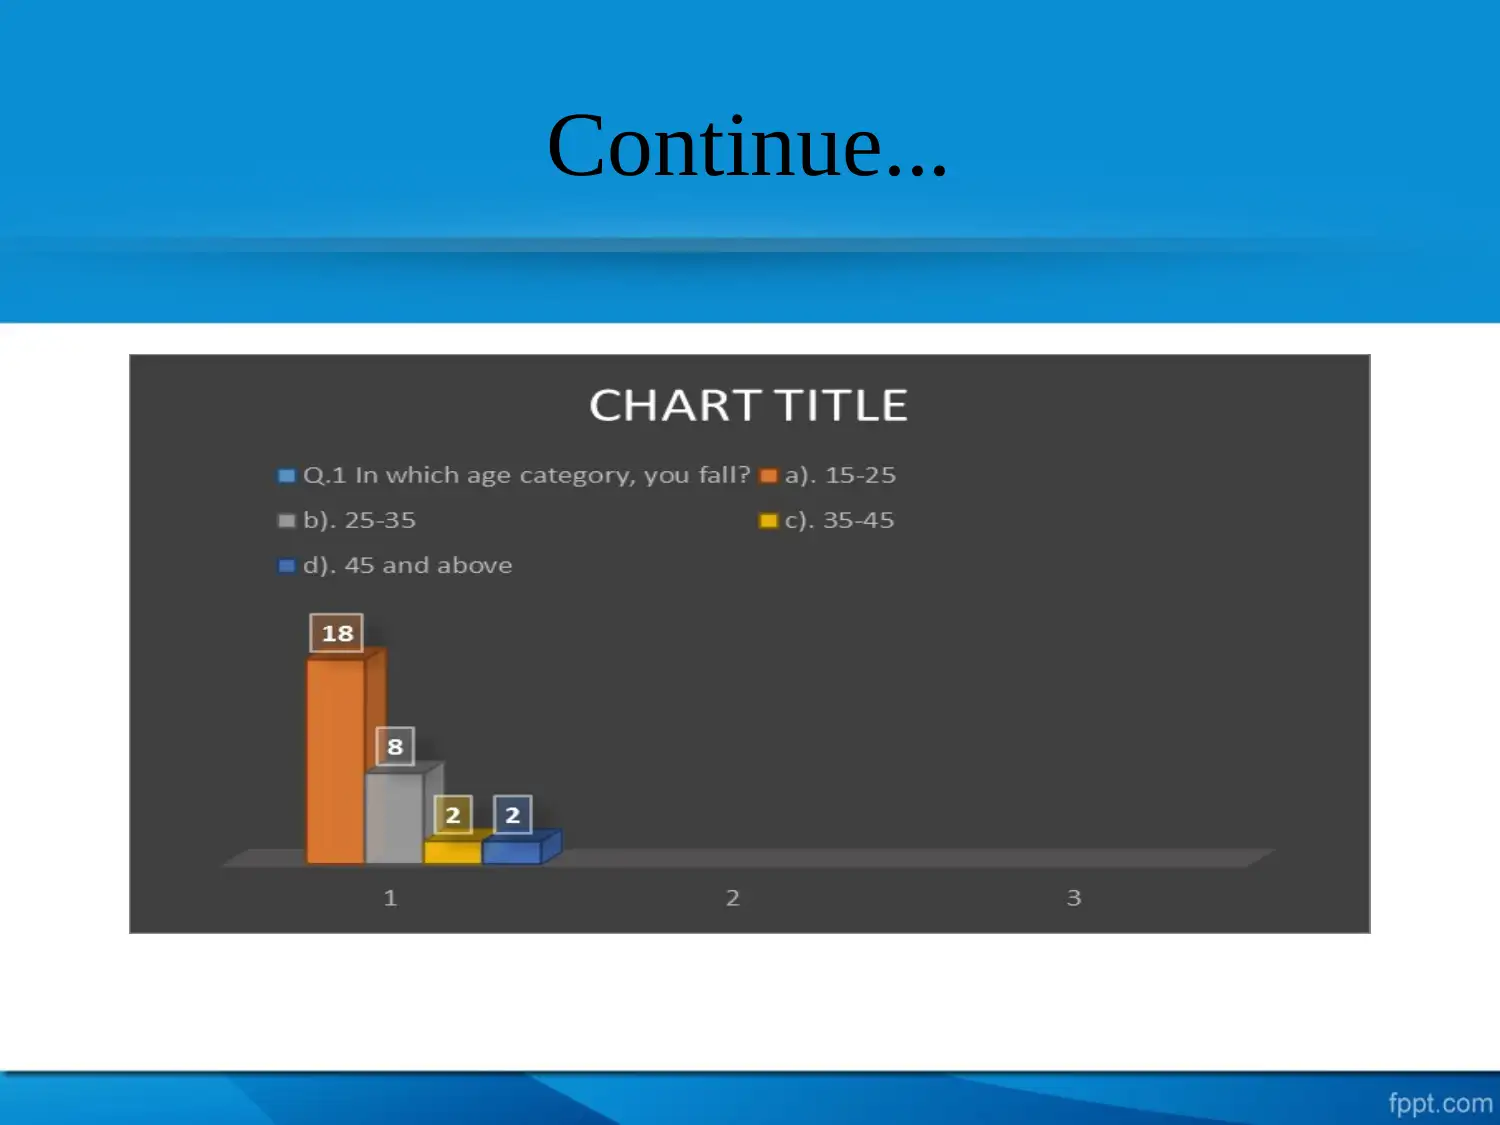
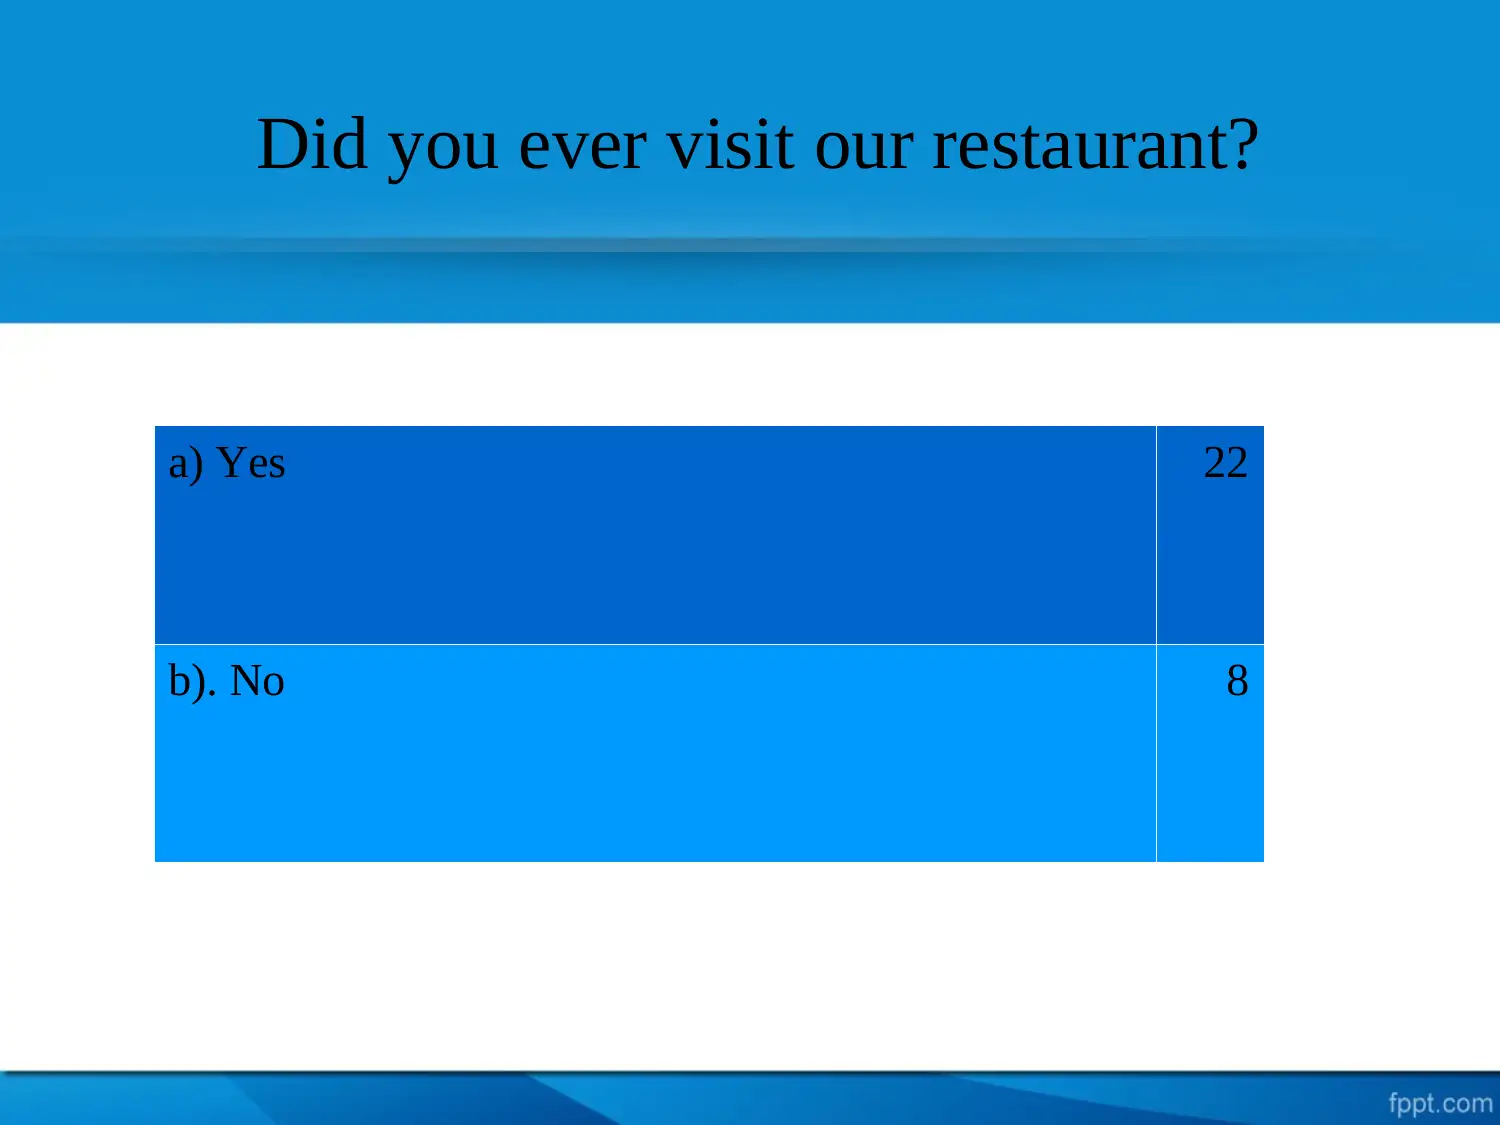
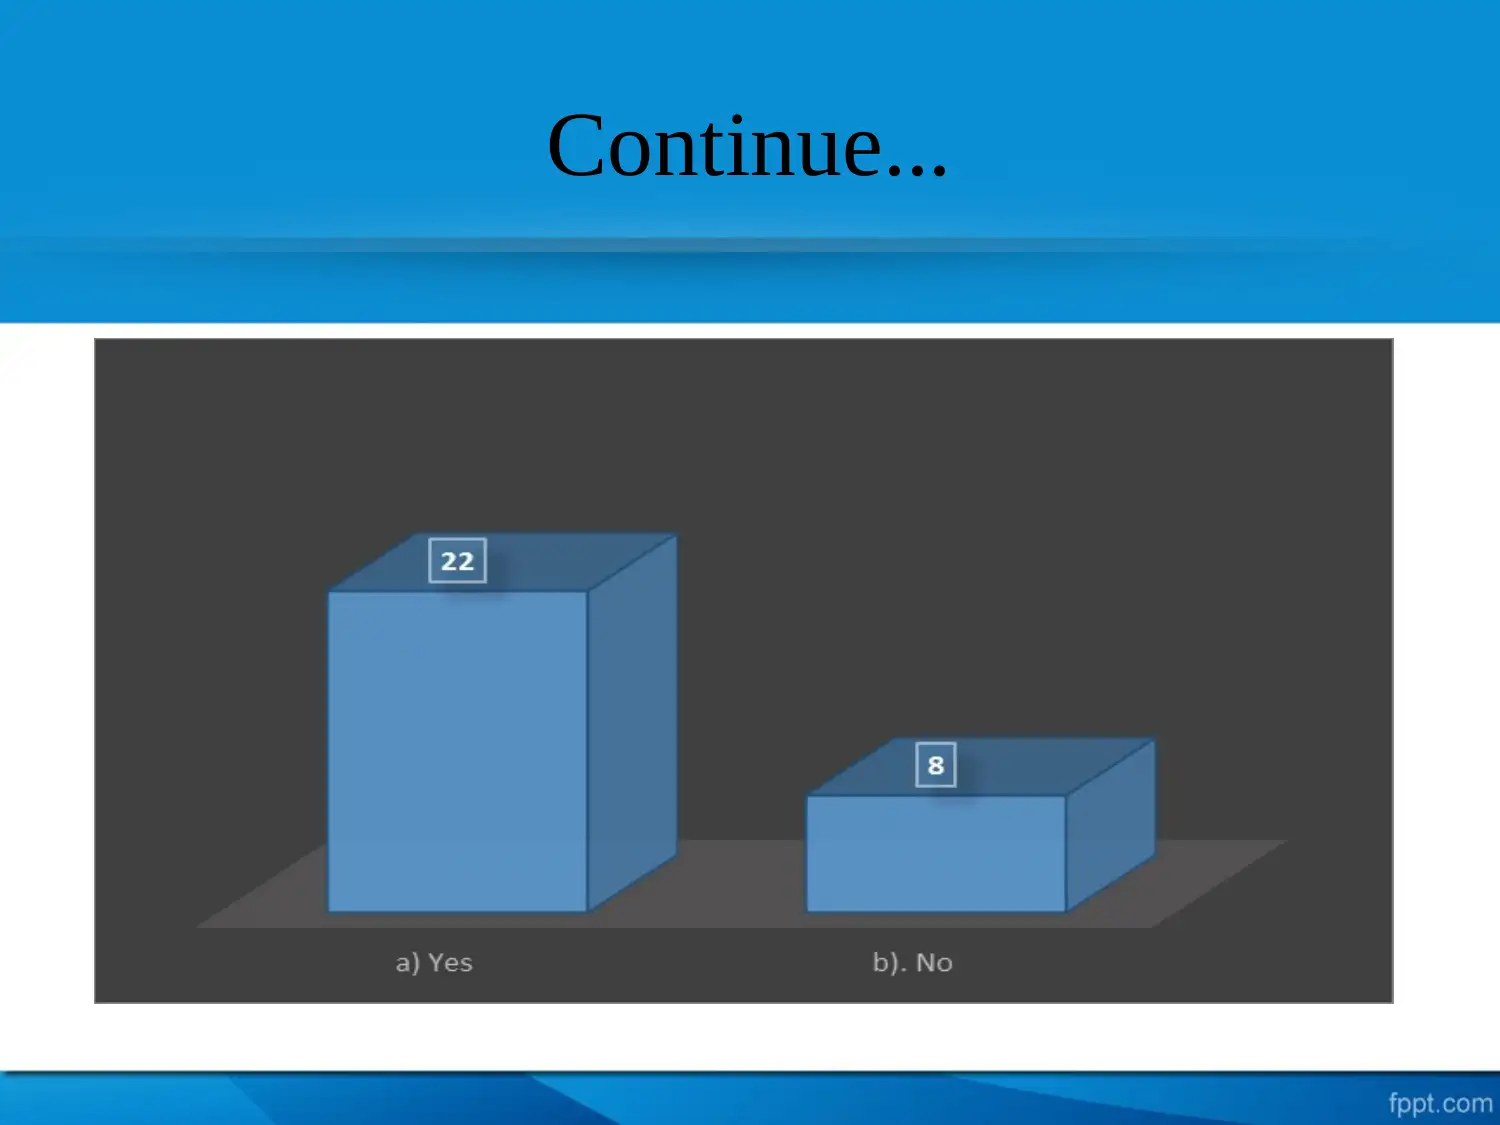
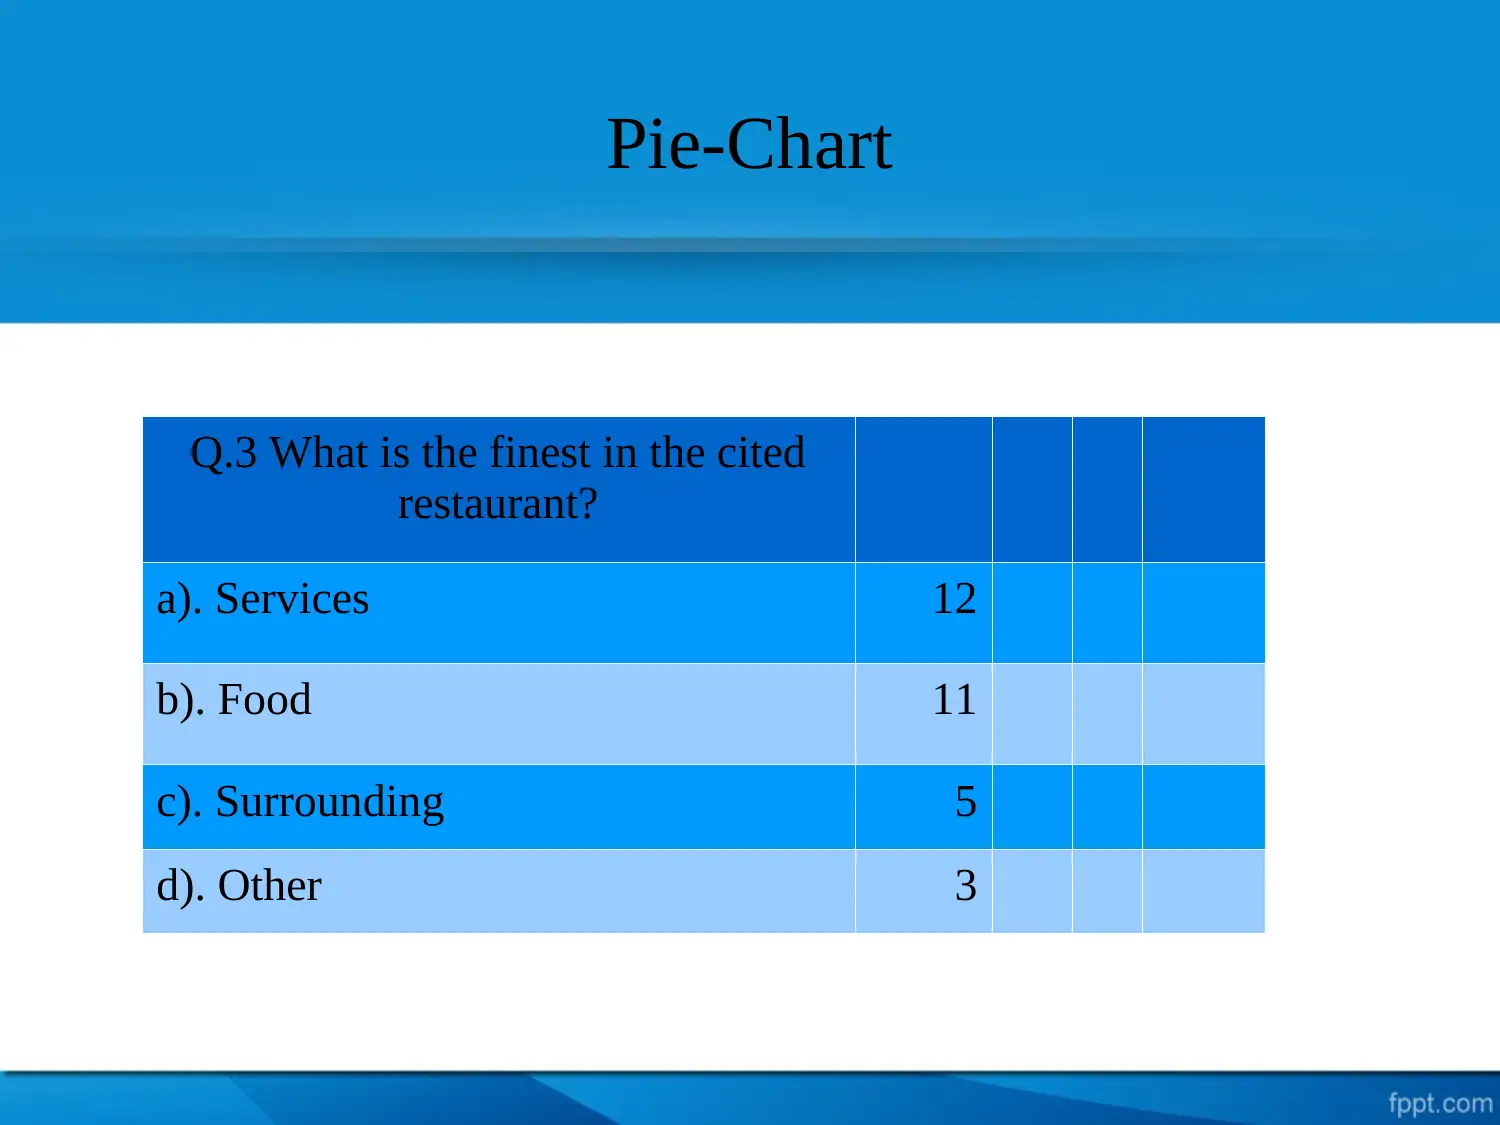
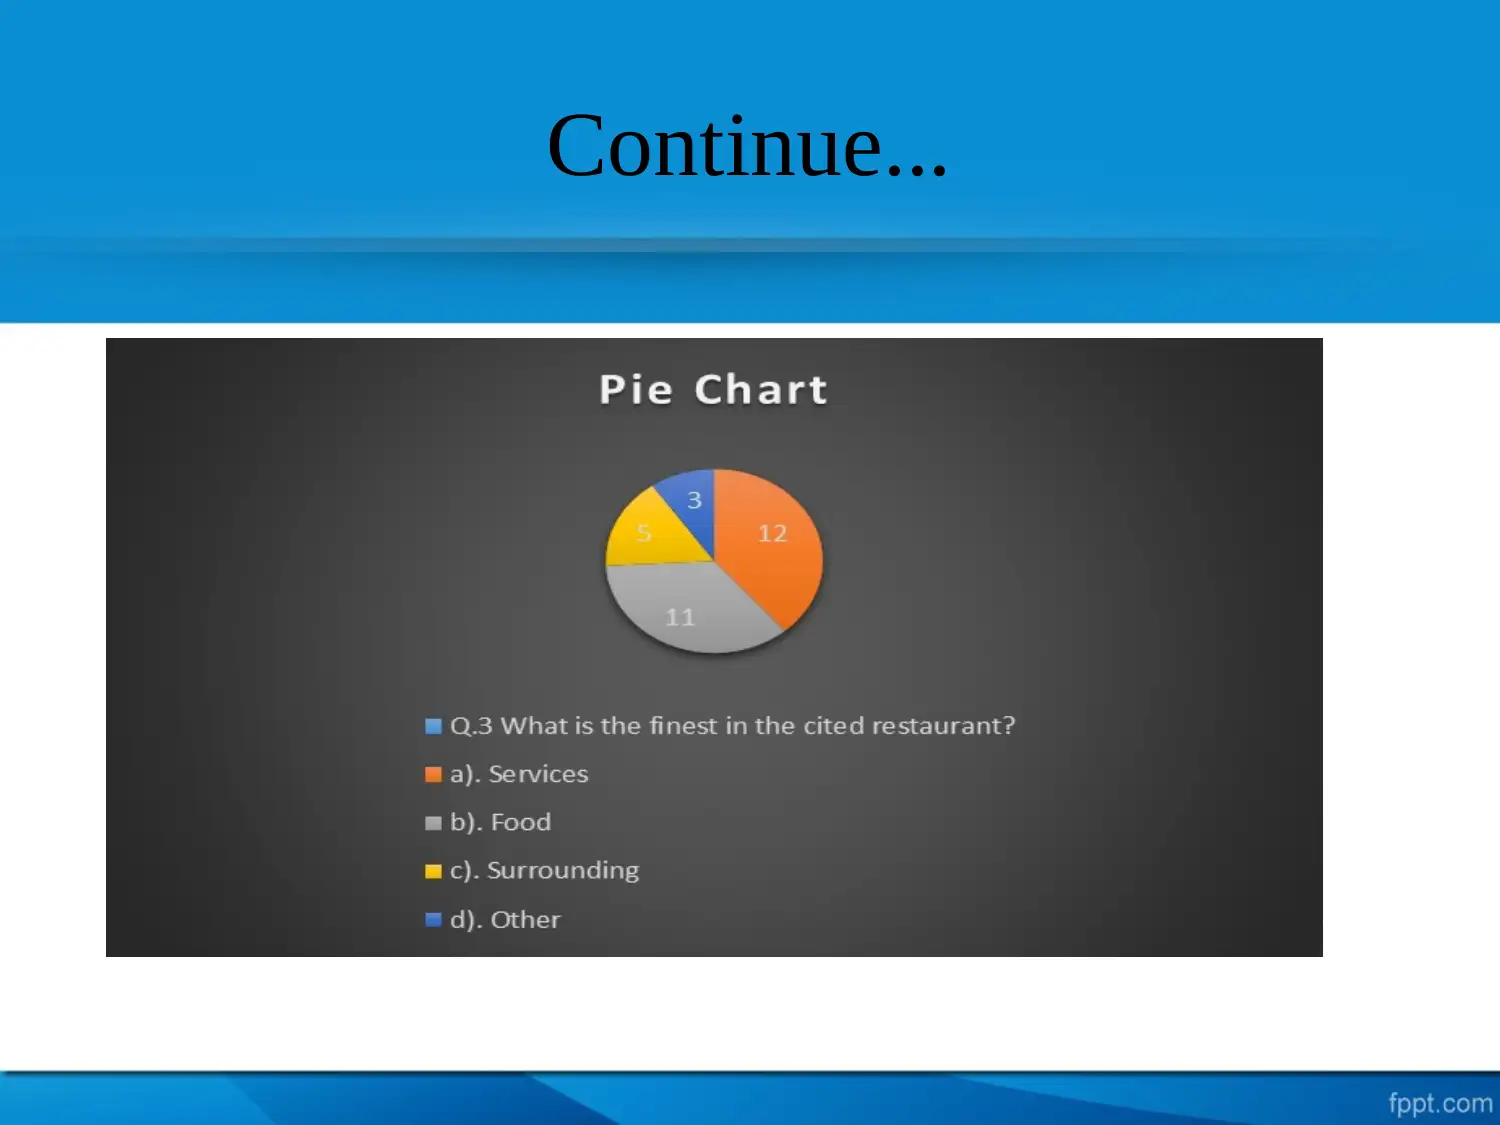
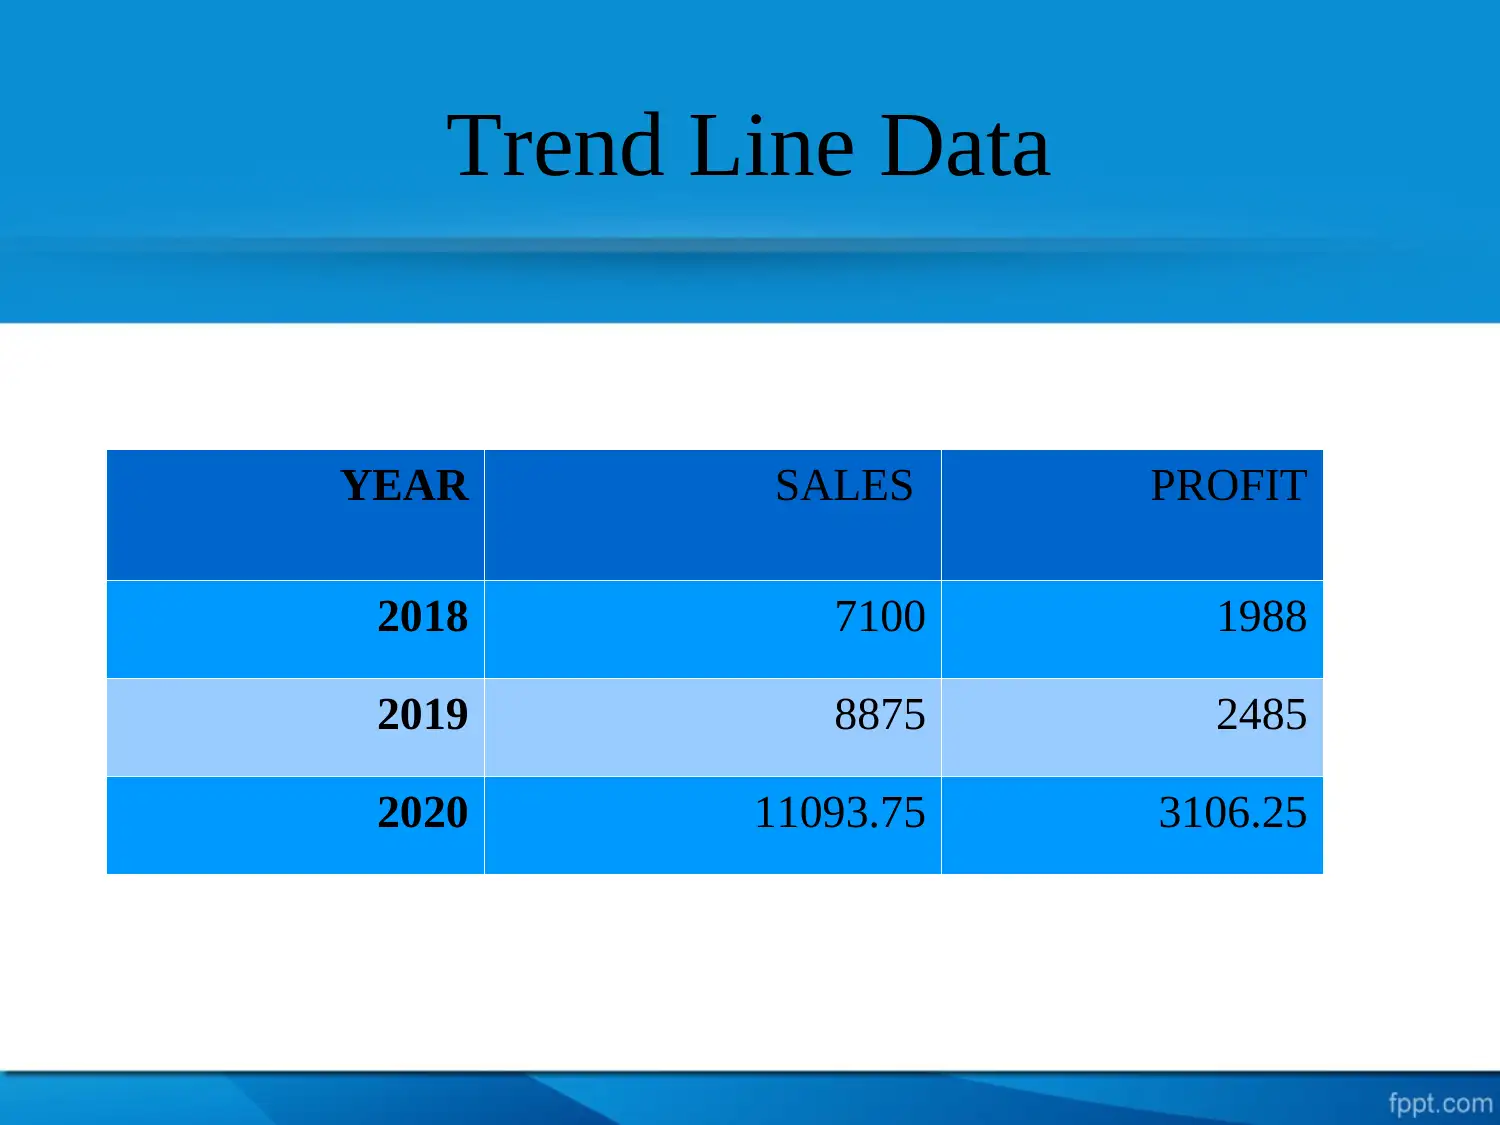
This report is a comprehensive analysis of business decision-making, focusing on customer perception of a restaurant's services. It includes an introduction, objectives, and research methodology, detailing the use of random sampling and data collection from 30 respondents. Data interpretation is presented through charts, graphs, and trend lines, analyzing customer demographics, visit frequency, and preferences regarding services, food, and ambiance. The report highlights key findings, such as increased customer visits and economical food pricing, while also suggesting improvements in hospitality and payment methods. The conclusion emphasizes the positive results related to service delivery and hospitality, and references relevant academic sources like Nowduri (2011) and Pettigrew (2014).
Document Page
BUSINESS DECISION
MAKING
Task 3.3
tabler-icon-diamond-filled.svg

Paraphrase This Document

Need a fresh take? Get an instant paraphrase of this document with our AI Paraphraser
Document Page
Cover Content
Introduction
Objectives
Research methodology
Data Interpretation
Trend line
Findings
Suggestions
Conclusion
References
Document Page
Introduction
Business decision is an essential aspect for every
organisation. With the help of this, one can make proper
analysis about the current reviews and problems those are
occur during the research process.
Document Page
Objective
The main objectives is to determine customer perception
about services offered by Balti palace restaurant.
To analyse quality of multi cuisine serve to plenty of
customers.
tabler-icon-diamond-filled.svg

Paraphrase This Document

Need a fresh take? Get an instant paraphrase of this document with our AI Paraphraser
Document Page
Research Methodology
Through this, chances of removing literature gaps can be identified.
With the use of random sampling proper data is being collected.
Total number of 30 respondent are use for this particular research.
Various charts and graphs is being drawn on the basis of data
collection.
Document Page
Data interpretation
Q.1 In which age category, you fall?
a). 15-25 18
b). 25-35 8
c). 35-45 2
d). 45 and above 2
Document Page
Continue...
tabler-icon-diamond-filled.svg

Paraphrase This Document

Need a fresh take? Get an instant paraphrase of this document with our AI Paraphraser
Document Page
Did you ever visit our restaurant?
a) Yes 22
b). No 8
Document Page
Continue...
Document Page
Pie-Chart
Q.3 What is the finest in the cited
restaurant?
a). Services 12
b). Food 11
c). Surrounding 5
d). Other 3
tabler-icon-diamond-filled.svg

Paraphrase This Document

Need a fresh take? Get an instant paraphrase of this document with our AI Paraphraser
Document Page
Continue...
Document Page
Trend Line Data
YEAR SALES PROFIT
2018 7100 1988
2019 8875 2485
2020 11093.75 3106.25
chevron_up_icon
1 out of 18
circle_padding
hide_on_mobile
zoom_out_icon
[object Object]