Business Decision Making Report: Project Viability and Data

Verified

Added on  2023/06/06

|8
|1151
|264
Report
AI Summary
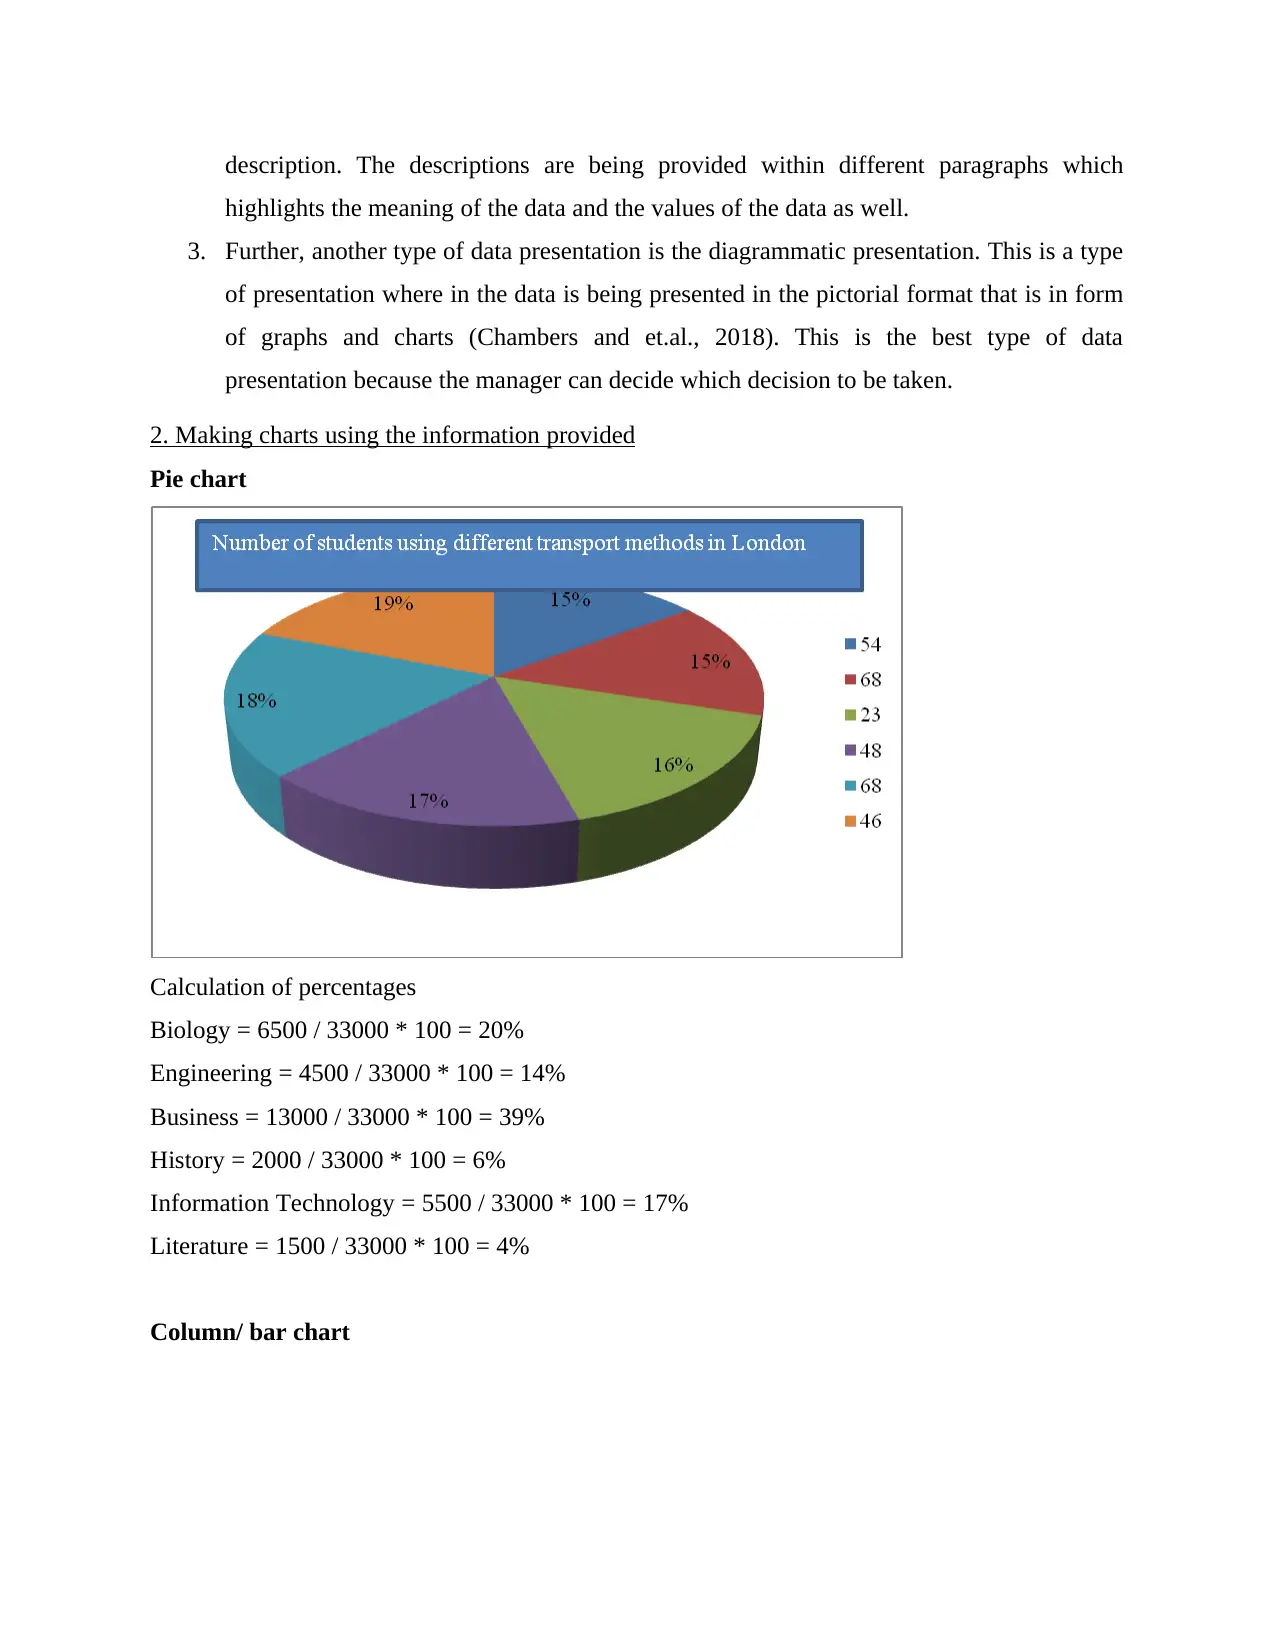
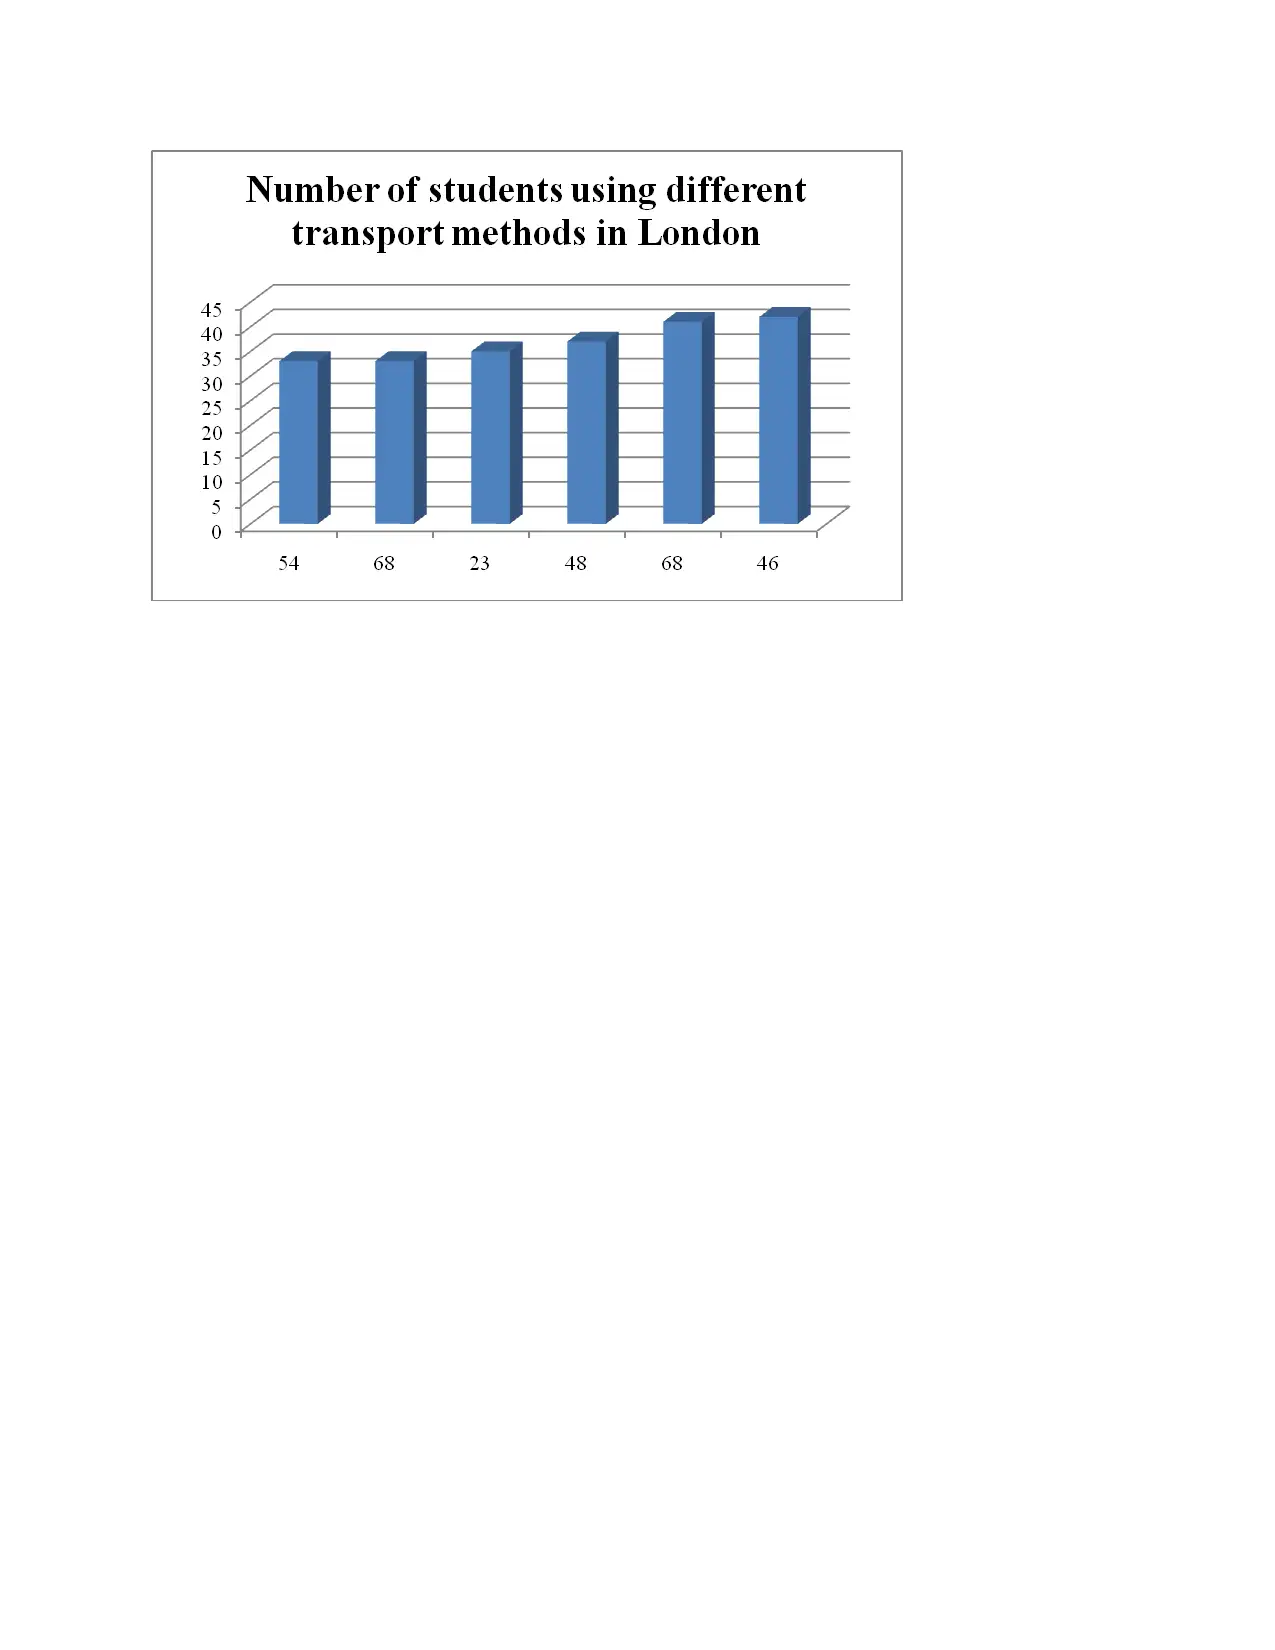
This report provides a comprehensive analysis of business decision-making processes. Section A focuses on appraising a project using Net Present Value (NPV), evaluating its financial viability, and considering other relevant factors. The NPV calculation reveals the project's financial unsuitability, prompting a recommendation against its pursuit. Section B delves into statistical analysis, including plotting histograms, calculating various statistical measures, and discussing the limitations of central tendency measures. Furthermore, the report explores useful data presentation methods, such as tabular, textual, and diagrammatic approaches, with practical examples like pie and bar charts to visualize data effectively. The report references relevant academic sources to support its findings and recommendations. The report is a valuable resource for students seeking to understand and apply business decision-making principles.
Document Page
Business Decision Making
tabler-icon-diamond-filled.svg

Paraphrase This Document

Need a fresh take? Get an instant paraphrase of this document with our AI Paraphraser
Document Page
TABLE OF CONTENTS
SECTION A.....................................................................................................................................3
QUESTION 1...................................................................................................................................3
A. Appraising the project by using NPV....................................................................................3
B. Advising on financial viability of proect................................................................................3
C. Other factors...........................................................................................................................3
SECTION B.....................................................................................................................................4
QUESTION 3...................................................................................................................................4
A. plotting histogram..................................................................................................................4
B. Calculating different statistical...............................................................................................4
C. Limitation of measures of central tendency...........................................................................5
QUESTION 4...................................................................................................................................5
1. Useful types of data presentation method...............................................................................5
2. Making charts using the information provided.......................................................................6
REFERENCES................................................................................................................................8
Document Page
SECTION A
QUESTION 1
A. Appraising the project by using NPV
Year Cash
inflows
Cash
outflows
Net
cash
flow
Discounting
factor
Discounted
cash flows
0 -140000 -
140000
1 -140000
1 41000 -45000 -4000 0.900901 -3603.6
2 52000 -66000 -14000 0.811622 -11362.7
3 86000 -61000 25000 0.731191 18279.78
4 110000 -80000 30000 0.658731 19761.93
5 120000 -71000 49000 0.593451 29079.12
6 155000 -78000 77000 0.534641 41167.34
Net Present value -46678.1
B. Advising on financial viability of proect
With respect to the above table, it can be seen that the project is not viable financially
because the NPV of the project is negative. A negative NPV denotes that the project is not
capable of providing positive returns in the future. In other words, the company will be going to
have net loss because of this project because of the present value of cash inflows being less than
the present value of cash outflows. Accordingly, management should not go for pursuing this
project.
C. Other factors
There are several other factors that needs to be taken into account while making this
investment decision, such as the following:
Document Page
Before getting involves in any investment, it is advisable to identify the risk levels
associated with the project in order to ensure that the returns of the business can be kept
safe.
Tenure of the project must be taken into account in terms of how much time the project will
take to bring back the initial investment amount. The longer the term, the greater would be
the risk for the business.
Tax implication to be arised in the future because of the investment must be taken into
account because it affects the returns that would be generated due to the project.
The effect of project on the business’s liquidity must be considered.
Proficiency and ability of individuals within the organization who are going to implement
the project must be considered.
SECTION B
QUESTION 3
A. plotting histogram
B. Calculating different statistical
Element Value
mean 44.1
median 42.5
mode 31
range
Maximum-
minimum 45
Maximum 68
Minimum 23
tabler-icon-diamond-filled.svg

Paraphrase This Document

Need a fresh take? Get an instant paraphrase of this document with our AI Paraphraser
Document Page
C. Limitation of measures of central tendency
The major limitation of using the measures of Central tendency is as follows-
The first and foremost limitation of using measures of central tendency is that in the absence
of actual data the measures of central tendency can lead to misleading information
(Chakrabarty, 2021). The reason underlying the fact is that this method can only be used in
case of actual data only.
Along with this another limitation of using the measures of central tendency is that the value
of the range is affected by only the two extreme scores and the middle values does not affect
the range to any of the extent.
Along with this another limitation of using measures of central tendency is that the mean
provides the undue weight age of the extreme values and the presence or absence of extreme
value does not affect the distribution of the data.
The major purpose of the central tendency is to provide the exact representation of the data being
collected and being analysed (Walesiak, Dehnel and Dudek, 2022). The major applicable tea or
the situation where the use of measures of central tendency will provide a better output is the
case of normally distributed data.
QUESTION 4
1. Useful types of data presentation method
There are many different methods through which the data can be presented. Within a
business it is the crucial duty of managers to take with decisions and within that data presentation
assist in much effective manner. The different useful methods of data presentation from a
manager’s point of view for taking quick business decisions are as follows-
1. The first and foremost presentation type is the tabular data presentation. This is a type of
method where in the data is being presented within a table format. There are rows and
columns containing different sets of data and their labels (Singh and et.al., 2021). These
levels outline what are the data then notes and how it needs to be used to within the
business decision making.
2. Moreover, another type of data presentation is the textual or descriptive presentation.
This is a type of presentation where in the whole data is being presented in the form of
Document Page
description. The descriptions are being provided within different paragraphs which
highlights the meaning of the data and the values of the data as well.
3. Further, another type of data presentation is the diagrammatic presentation. This is a type
of presentation where in the data is being presented in the pictorial format that is in form
of graphs and charts (Chambers and et.al., 2018). This is the best type of data
presentation because the manager can decide which decision to be taken.
2. Making charts using the information provided
Pie chart
Calculation of percentages
Biology = 6500 / 33000 * 100 = 20%
Engineering = 4500 / 33000 * 100 = 14%
Business = 13000 / 33000 * 100 = 39%
History = 2000 / 33000 * 100 = 6%
Information Technology = 5500 / 33000 * 100 = 17%
Literature = 1500 / 33000 * 100 = 4%
Column/ bar chart
Document Page
tabler-icon-diamond-filled.svg

Paraphrase This Document

Need a fresh take? Get an instant paraphrase of this document with our AI Paraphraser
Document Page
REFERENCES
Books and Journals
Chakrabarty, D., 2021. Model Describing Central Tendency of Data. International Journal of
Advanced Research in Science, Engineering and Technology, pp.2350-0328.
Chambers, J.M., and et.al., 2018. Graphical methods for data analysis. Chapman and Hall/CRC.
Singh, A., and et.al., 2021. A comparative evaluation of the wearable augmented reality-based
data presentation interface and traditional methods for data entry tasks. International
Journal of Industrial Ergonomics. 86. p.103190.
Walesiak, M., Dehnel, G. and Dudek, A., 2022. A dynamic approach to relative taxonomy and
robust measures of central tendency. Communications in Statistics-Simulation and
Computation, pp.1-17.
chevron_up_icon
1 out of 8
circle_padding
hide_on_mobile
zoom_out_icon
[object Object]