Business Decision Making Report - HND Business, Level 5, Term 2
VerifiedAdded on 2020/07/23
|19
|3946
|31
Report
AI Summary
This report provides a comprehensive analysis of business decision-making processes for a restaurant expansion. It begins with a plan for data collection, encompassing both primary (questionnaire survey) and secondary sources (historical sales and profit data). The report details the survey methodology, sampling frame, and questionnaire design to understand customer preferences. Task 2 focuses on data analysis, including creating information for decision-making by summarizing the data using representative values (average, median, mode), measures of dispersion (range, standard deviation), and correlation analysis. It also explains how quartile, percentiles and correlation coefficients are used to draw conclusions. Task 3 involves producing graphs using spreadsheets, creating trend lines for forecasting, and preparing a business presentation and a formal business report. Finally, Task 4 uses information processing tools, project planning techniques (critical path analysis), and financial tools to support decision-making, particularly in the context of investment appraisal. The conclusion summarizes the key findings and recommendations for the restaurant's expansion strategy.
BUSINESS DECISION-MAKING
Paraphrase This Document
Need a fresh take? Get an instant paraphrase of this document with our AI Paraphraser
Table of Contents
INTRODUCTION.........................................................................................................................................1
TASK 1..........................................................................................................................................................1
1.1 Create a plan for data collection..........................................................................................................1
1.2 Present survey methodology and sampling frame...............................................................................2
1.3 Design a questionnaire for a given business problem..........................................................................2
TASK 2..........................................................................................................................................................4
2.1 Create information for decision making by summarizing the given data set......................................4
2.2 Analysis of the results to draw valid conclusion.................................................................................6
2.3 Analyze data using dispersion measures..............................................................................................7
2.4 Explain how quartile, percentiles and correlation coefficient used to draw conclusion......................8
TASK 3..........................................................................................................................................................8
3.1 Producing graphs using spreadsheet and drawing conclusion.............................................................8
3.2 Creating trend lines in the spreadsheets to assist in forecasting........................................................10
3.3 Preparing a business presentation......................................................................................................11
3.4 Producing a formal business report....................................................................................................11
TASK 4........................................................................................................................................................12
4.1 Using appropriate information processing tools................................................................................12
4.2 Preparing a project plan for the activity and finding critical path.....................................................13
4.3 Using financial tools for decision-making.........................................................................................14
CONCLUSION............................................................................................................................................16
REFERENCES............................................................................................................................................17
INTRODUCTION
In challenging time, decision-making becomes a vital part of every business organization
however, uncertainty, unpredictable market volatility, changing demographics, lifestyle, social
preference brings risk for the business. Although restaurant sector of UK is highly growing,
expanding and profitable industry, still, it is subjected to challenging period where all restaurants
are struggling in the market to stay competitively strong. In order to expand, currently, Murano
restaurant had taken a step forward to open one more outlet in the UK. Thus, the research will
carry out qualitative and quantitative analysis of primary and secondary data set collected
through survey and secondary reports. Lastly, it will utilize investment appraisal tools to
examine project viability.
TASK 1
1.1 Create a plan for data collection
Before commencing a new restaurant branch in London, Murano restaurant need to
investigate necessary information by collecting required data from different possible sources. It
will need to carry out a research to discover or explore the factors which affect their expansion
strategy.
Primary sources: As its name, new information is generated by conducting an original
investigation. Survey, field observation, questionnaire, interview and others are several ways
whereby primary information can be generated by a researcher (Pickard, 2012). With reference
to the given case, as the key focus is to know customer prefernces, choices and perception,
therefore, questionnaire survey seems an effective technique for Murano restaurant. Although, it
may be time consuming and expnsive too, still, helpful to extract credible information.
Secondary sources: By contrast to above, sometimes information is already available and
investigator do not need to collect it by surveying the target population. For instance, historical
studies of scholars, encyclopedia, newsletters, research papers, annual reports, industry statistics
and government publications are few secondary sources that may be published or unpublished.
Here, historical performance of Murano restaurant will be examine through extracting sales and
profit results of last years.
1
⊘ This is a preview!⊘
Do you want full access?
Subscribe today to unlock all pages.
Trusted by 1+ million students worldwide
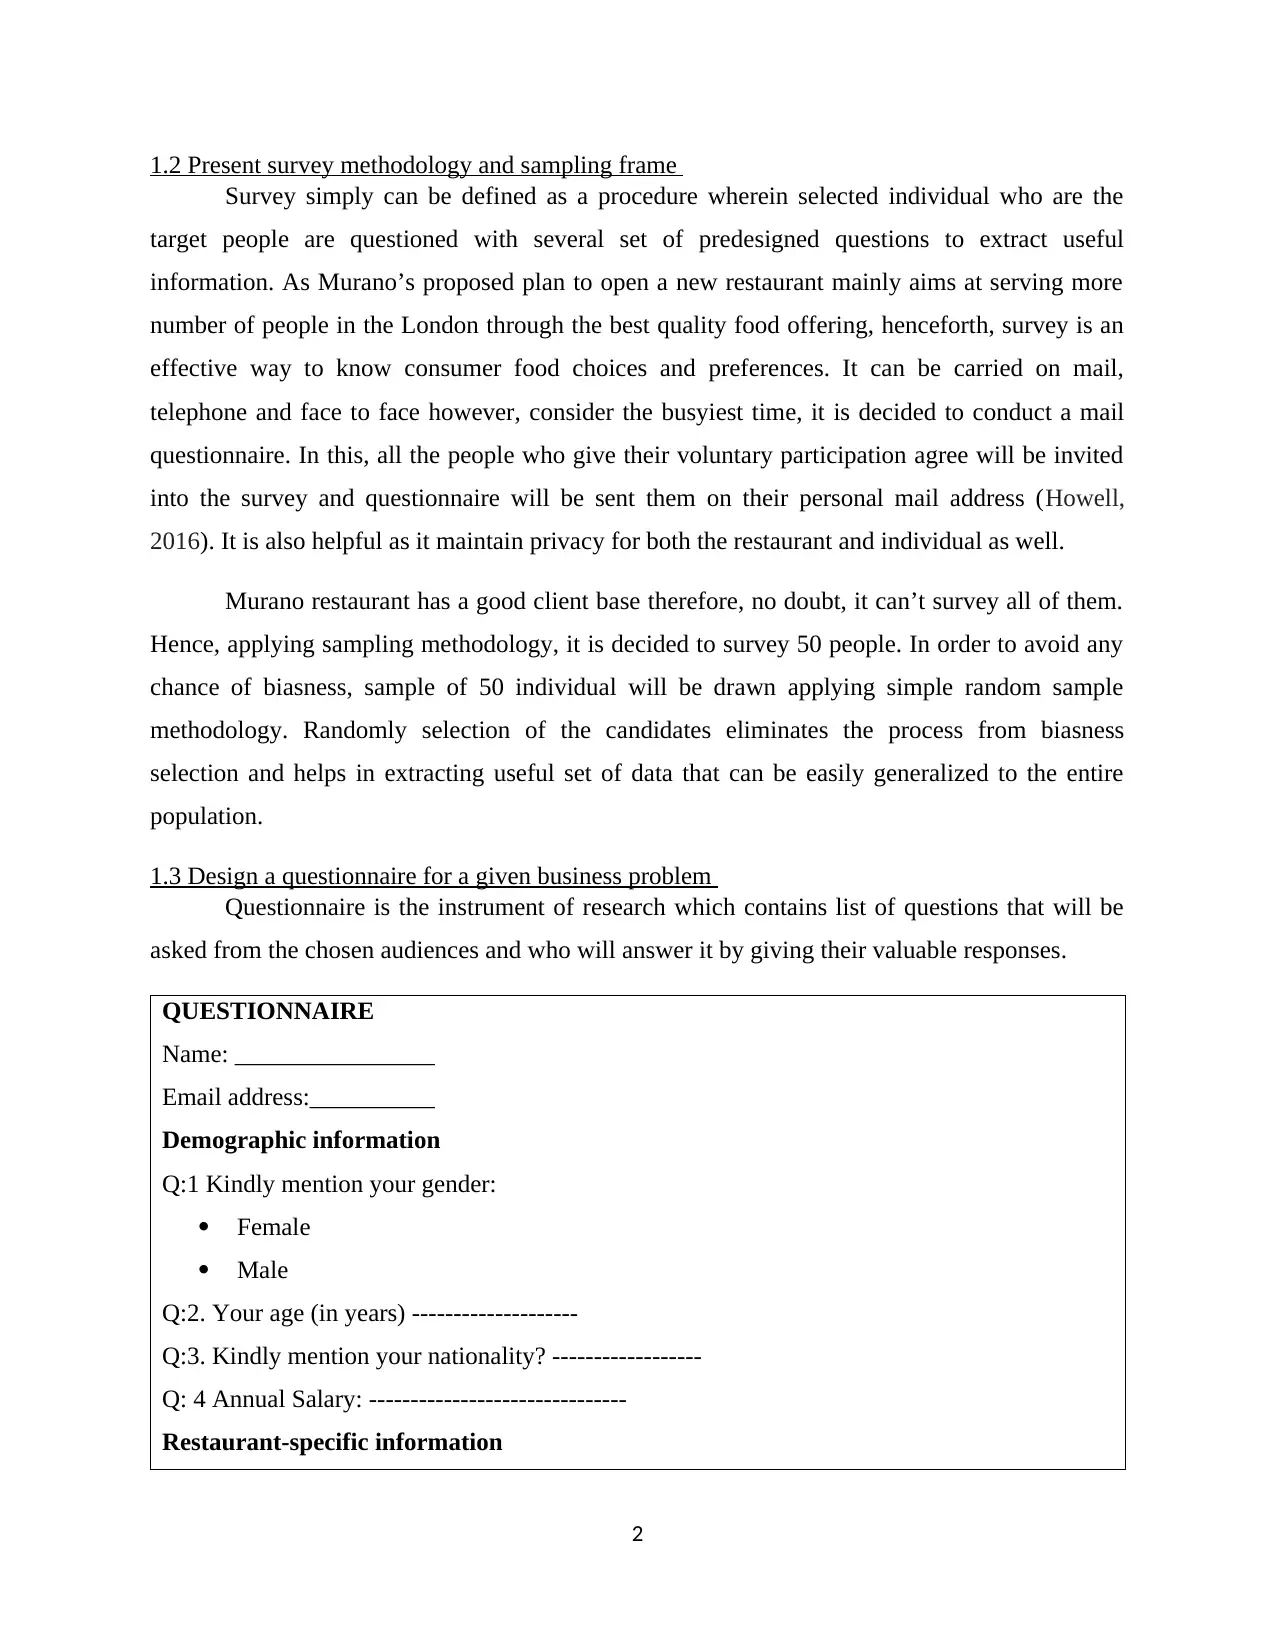
1.2 Present survey methodology and sampling frame
Survey simply can be defined as a procedure wherein selected individual who are the
target people are questioned with several set of predesigned questions to extract useful
information. As Murano’s proposed plan to open a new restaurant mainly aims at serving more
number of people in the London through the best quality food offering, henceforth, survey is an
effective way to know consumer food choices and preferences. It can be carried on mail,
telephone and face to face however, consider the busyiest time, it is decided to conduct a mail
questionnaire. In this, all the people who give their voluntary participation agree will be invited
into the survey and questionnaire will be sent them on their personal mail address (Howell,
2016). It is also helpful as it maintain privacy for both the restaurant and individual as well.
Murano restaurant has a good client base therefore, no doubt, it can’t survey all of them.
Hence, applying sampling methodology, it is decided to survey 50 people. In order to avoid any
chance of biasness, sample of 50 individual will be drawn applying simple random sample
methodology. Randomly selection of the candidates eliminates the process from biasness
selection and helps in extracting useful set of data that can be easily generalized to the entire
population.
1.3 Design a questionnaire for a given business problem
Questionnaire is the instrument of research which contains list of questions that will be
asked from the chosen audiences and who will answer it by giving their valuable responses.
QUESTIONNAIRE
Name: ________________
Email address:__________
Demographic information
Q:1 Kindly mention your gender:
Female
Male
Q:2. Your age (in years) --------------------
Q:3. Kindly mention your nationality? ------------------
Q: 4 Annual Salary: -------------------------------
Restaurant-specific information
2
Paraphrase This Document
Need a fresh take? Get an instant paraphrase of this document with our AI Paraphraser
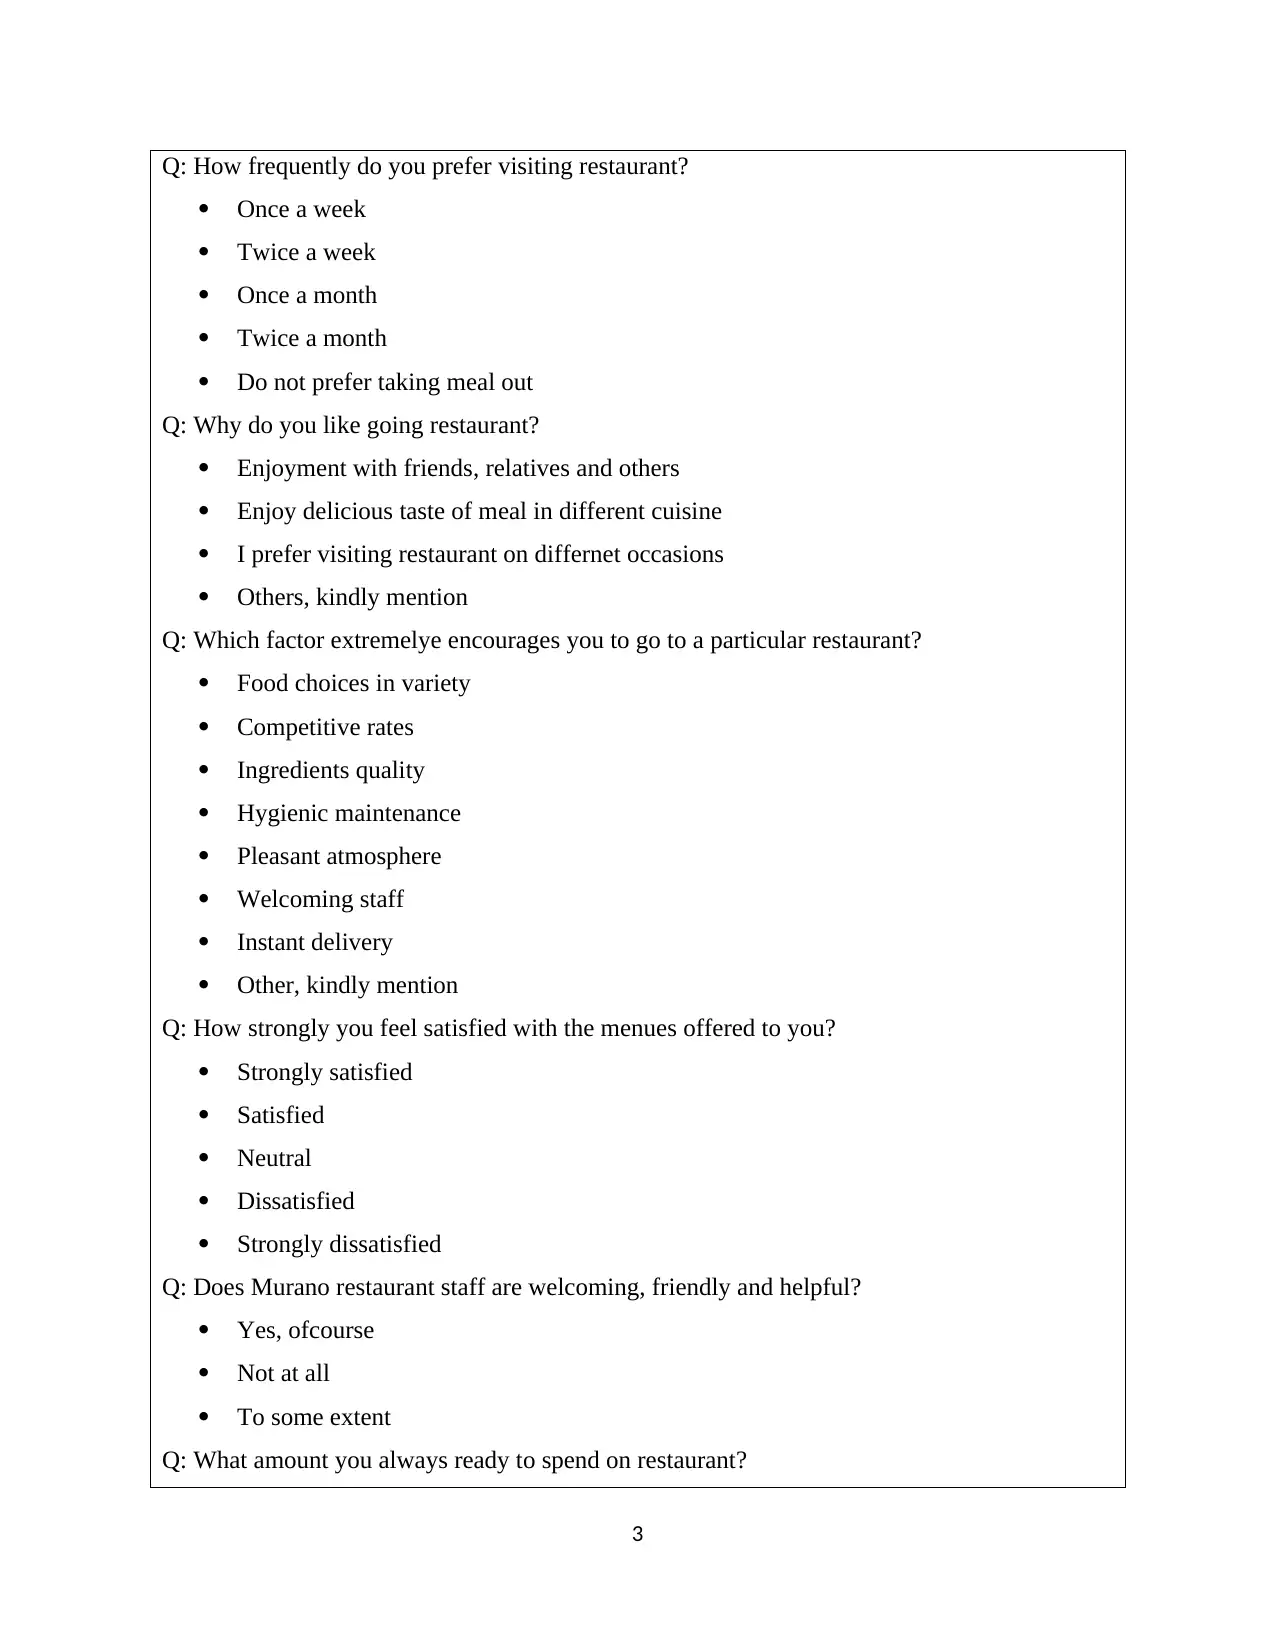
Q: How frequently do you prefer visiting restaurant?
Once a week
Twice a week
Once a month
Twice a month
Do not prefer taking meal out
Q: Why do you like going restaurant?
Enjoyment with friends, relatives and others
Enjoy delicious taste of meal in different cuisine
I prefer visiting restaurant on differnet occasions
Others, kindly mention
Q: Which factor extremelye encourages you to go to a particular restaurant?
Food choices in variety
Competitive rates
Ingredients quality
Hygienic maintenance
Pleasant atmosphere
Welcoming staff
Instant delivery
Other, kindly mention
Q: How strongly you feel satisfied with the menues offered to you?
Strongly satisfied
Satisfied
Neutral
Dissatisfied
Strongly dissatisfied
Q: Does Murano restaurant staff are welcoming, friendly and helpful?
Yes, ofcourse
Not at all
To some extent
Q: What amount you always ready to spend on restaurant?
3
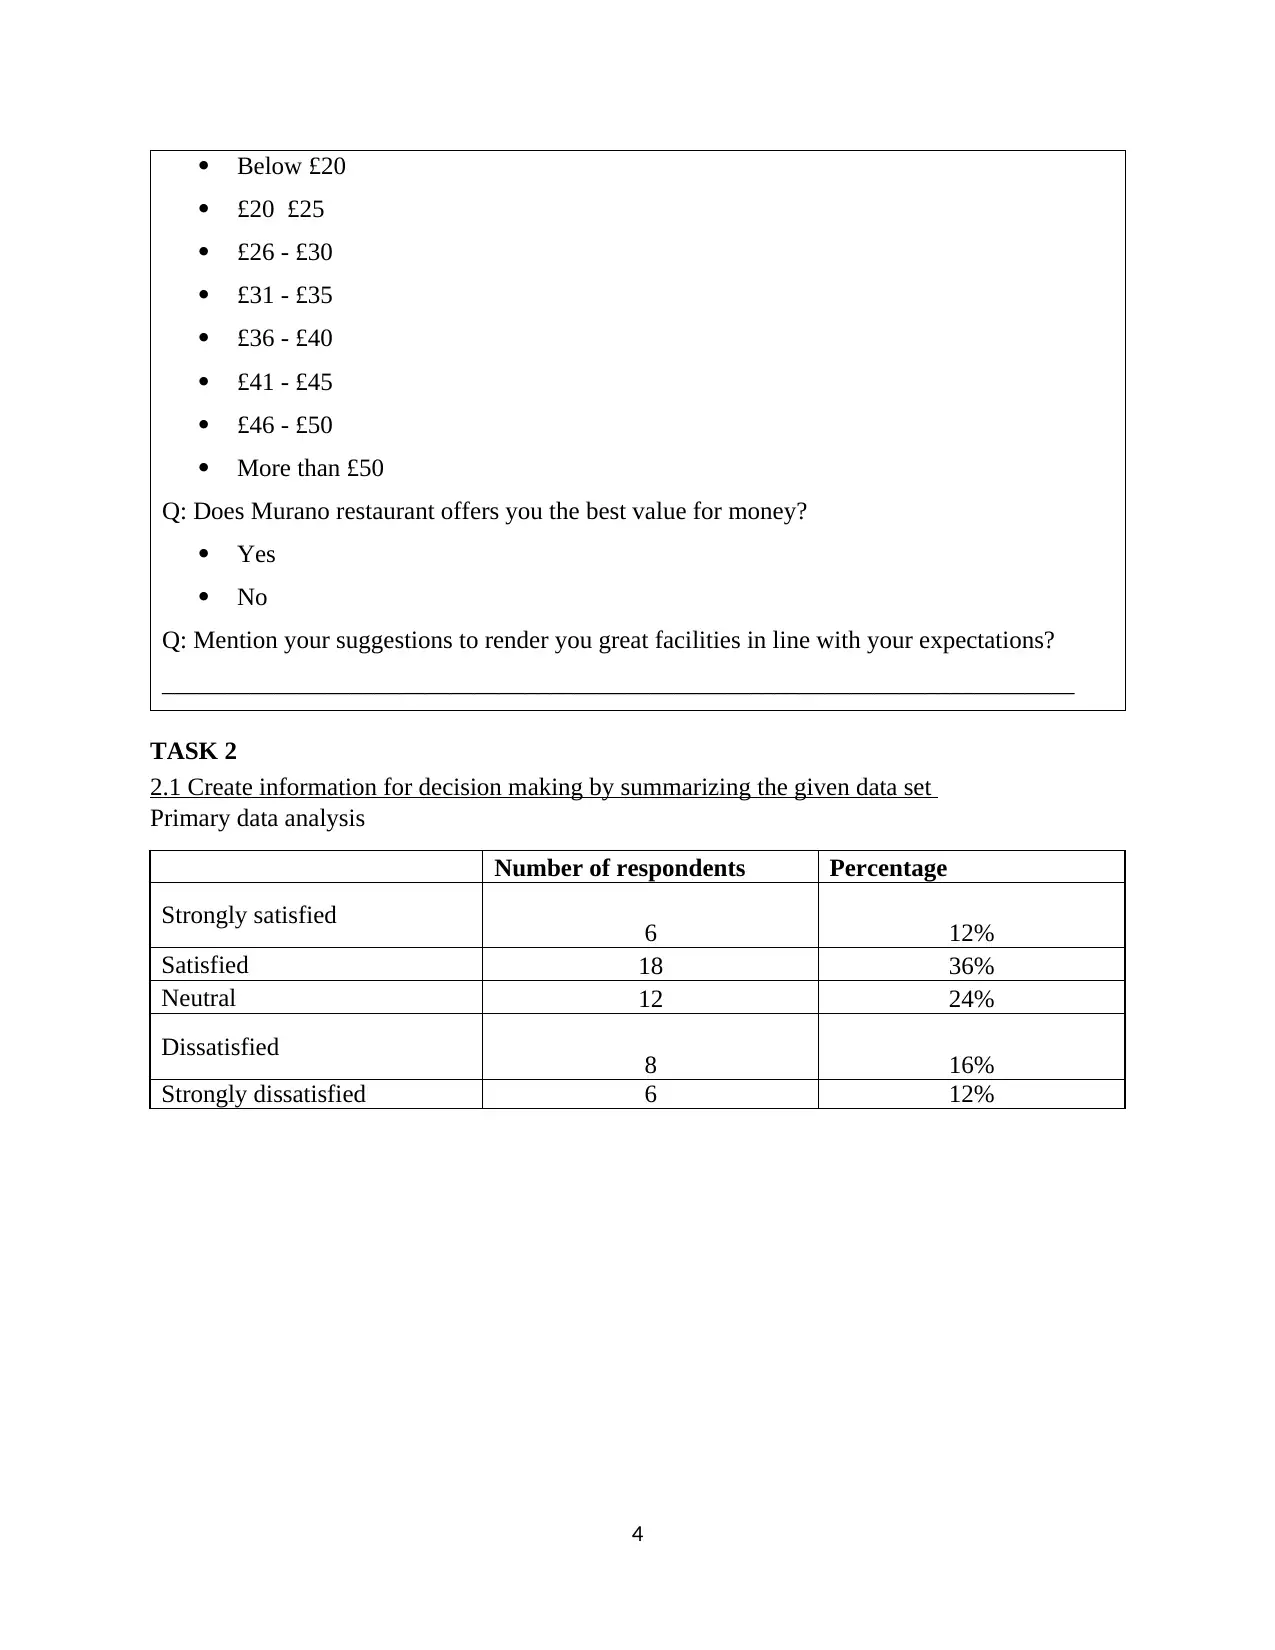
Below £20
£20 £25
£26 - £30
£31 - £35
£36 - £40
£41 - £45
£46 - £50
More than £50
Q: Does Murano restaurant offers you the best value for money?
Yes
No
Q: Mention your suggestions to render you great facilities in line with your expectations?
_________________________________________________________________________
TASK 2
2.1 Create information for decision making by summarizing the given data set
Primary data analysis
Number of respondents Percentage
Strongly satisfied 6 12%
Satisfied 18 36%
Neutral 12 24%
Dissatisfied 8 16%
Strongly dissatisfied 6 12%
4
⊘ This is a preview!⊘
Do you want full access?
Subscribe today to unlock all pages.
Trusted by 1+ million students worldwide
S t r o n g l y s a ti s fi e d S a ti s fi e d N e u t r a l D i s s a ti s fi e d S t r o n g l y
d i s s a ti s fi e d
6
18
12
8
6
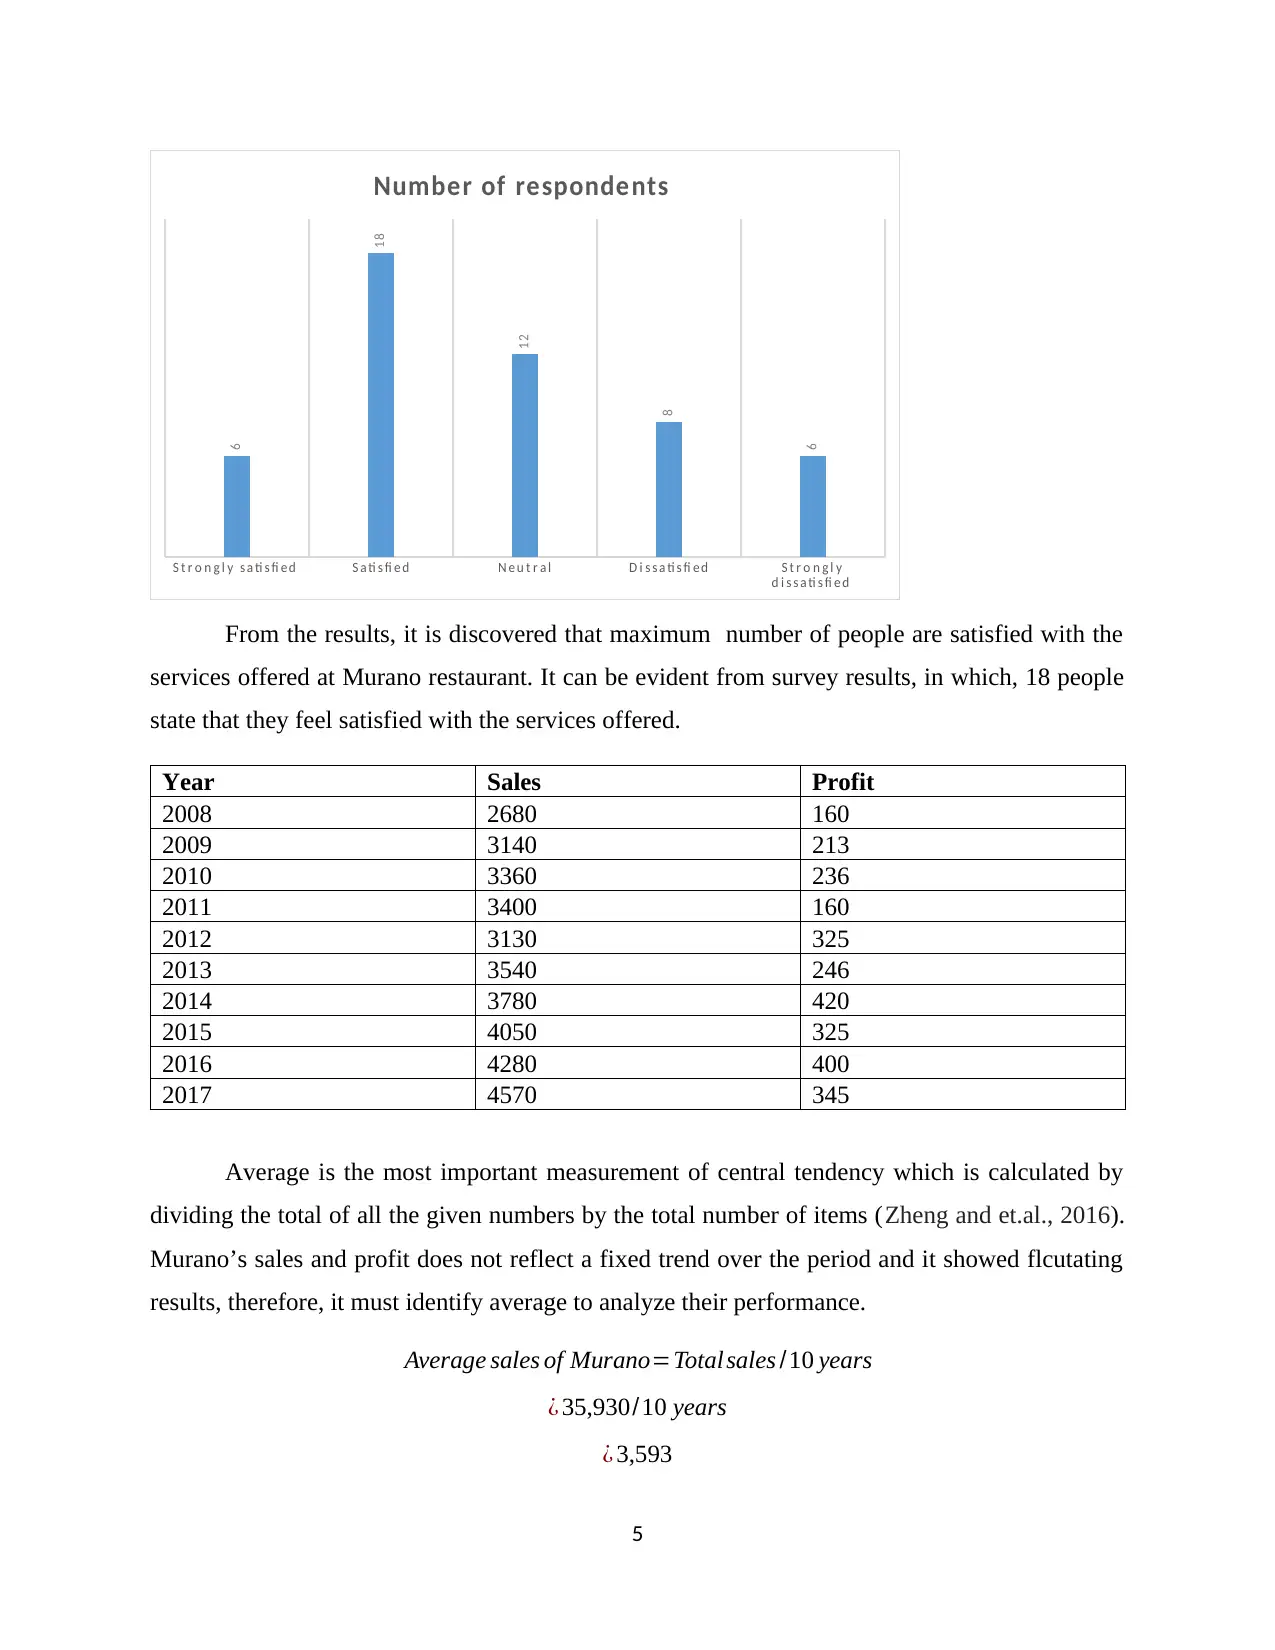
Number of respondents
From the results, it is discovered that maximum number of people are satisfied with the
services offered at Murano restaurant. It can be evident from survey results, in which, 18 people
state that they feel satisfied with the services offered.
Year Sales Profit
2008 2680 160
2009 3140 213
2010 3360 236
2011 3400 160
2012 3130 325
2013 3540 246
2014 3780 420
2015 4050 325
2016 4280 400
2017 4570 345
Average is the most important measurement of central tendency which is calculated by
dividing the total of all the given numbers by the total number of items (Zheng and et.al., 2016).
Murano’s sales and profit does not reflect a fixed trend over the period and it showed flcutating
results, therefore, it must identify average to analyze their performance.
Average sales of Murano=Total sales /10 years
¿ 35,930/10 years
¿ 3,593
5
d i s s a ti s fi e d
6
18
12
8
6
Number of respondents
From the results, it is discovered that maximum number of people are satisfied with the
services offered at Murano restaurant. It can be evident from survey results, in which, 18 people
state that they feel satisfied with the services offered.
Year Sales Profit
2008 2680 160
2009 3140 213
2010 3360 236
2011 3400 160
2012 3130 325
2013 3540 246
2014 3780 420
2015 4050 325
2016 4280 400
2017 4570 345
Average is the most important measurement of central tendency which is calculated by
dividing the total of all the given numbers by the total number of items (Zheng and et.al., 2016).
Murano’s sales and profit does not reflect a fixed trend over the period and it showed flcutating
results, therefore, it must identify average to analyze their performance.
Average sales of Murano=Total sales /10 years
¿ 35,930/10 years
¿ 3,593
5
Paraphrase This Document
Need a fresh take? Get an instant paraphrase of this document with our AI Paraphraser
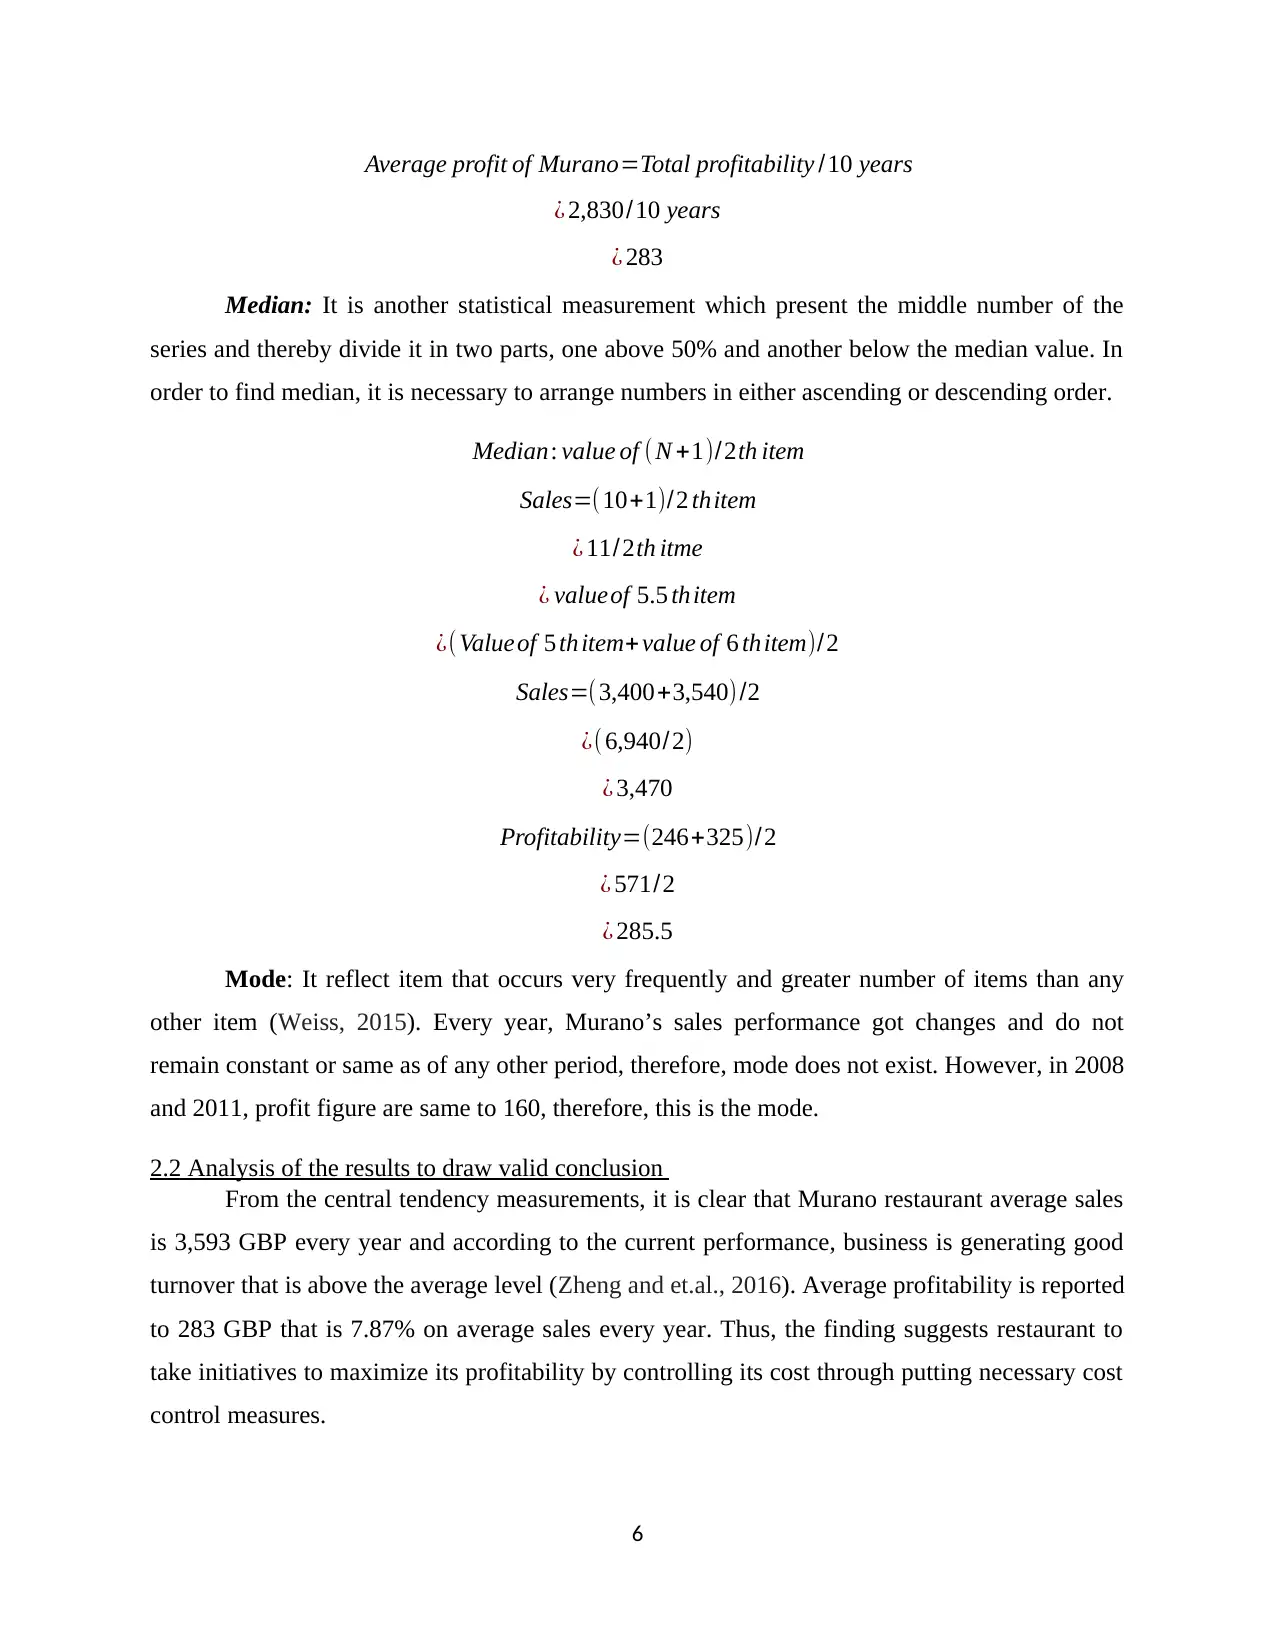
Average profit of Murano=Total profitability /10 years
¿ 2,830/10 years
¿ 283
Median: It is another statistical measurement which present the middle number of the
series and thereby divide it in two parts, one above 50% and another below the median value. In
order to find median, it is necessary to arrange numbers in either ascending or descending order.
Median: value of ( N +1)/2th item
Sales=(10+1)/2 thitem
¿ 11/2th itme
¿ valueof 5.5 thitem
¿( Valueof 5 th item+ value of 6 thitem)/2
Sales=(3,400+3,540)/2
¿( 6,940/2)
¿ 3,470
Profitability=(246+325)/2
¿ 571/2
¿ 285.5
Mode: It reflect item that occurs very frequently and greater number of items than any
other item (Weiss, 2015). Every year, Murano’s sales performance got changes and do not
remain constant or same as of any other period, therefore, mode does not exist. However, in 2008
and 2011, profit figure are same to 160, therefore, this is the mode.
2.2 Analysis of the results to draw valid conclusion
From the central tendency measurements, it is clear that Murano restaurant average sales
is 3,593 GBP every year and according to the current performance, business is generating good
turnover that is above the average level (Zheng and et.al., 2016). Average profitability is reported
to 283 GBP that is 7.87% on average sales every year. Thus, the finding suggests restaurant to
take initiatives to maximize its profitability by controlling its cost through putting necessary cost
control measures.
6
However, median of the sales is 3,470 GBP that is little bit below above the average
turnover. It is the level which is equal to the 50% of the total sales. However, median profit of
the company is 285.5 GBP that is little bit above the average that represents the need for the firm
to make plans and strategies to boost their net return by controlling cost and overheads.
Lastly, mode of the profit series is found to 160 GBP because it took place twice in the
period of past 10 years.
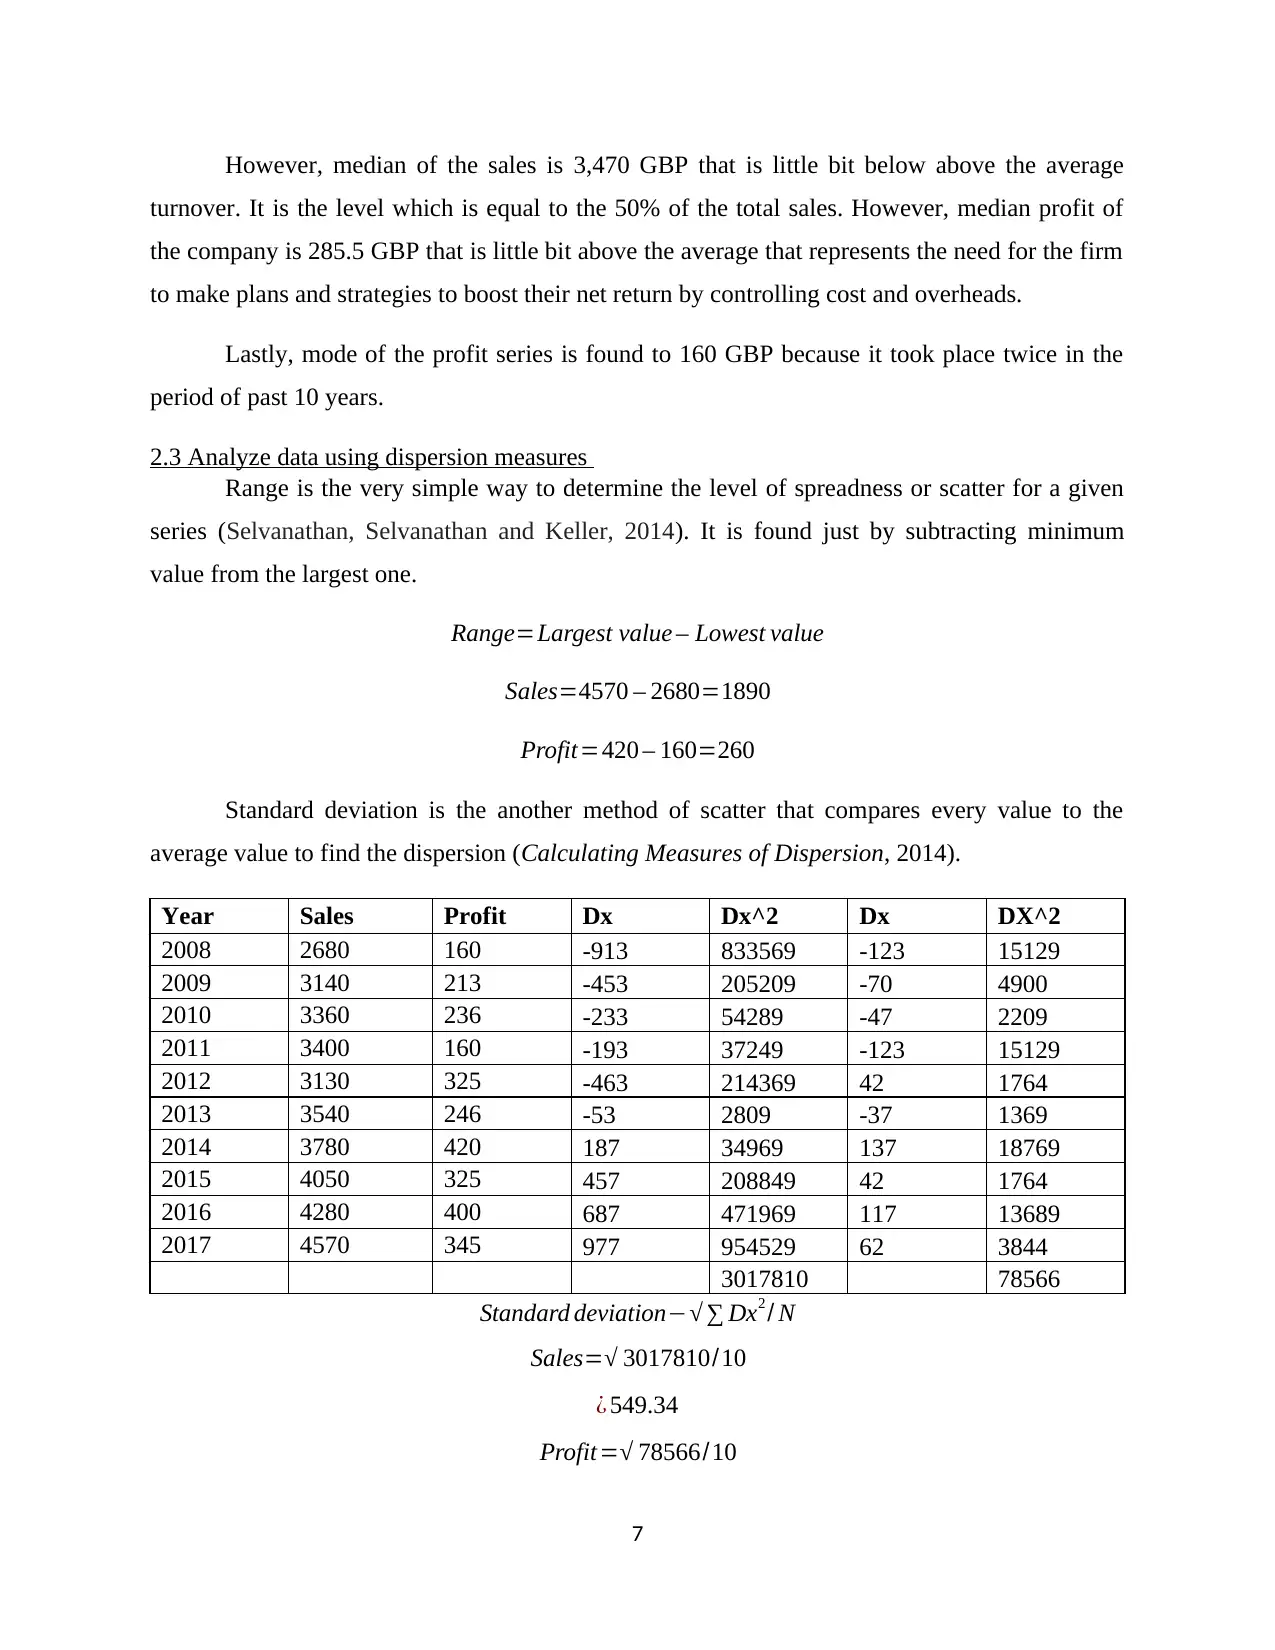
2.3 Analyze data using dispersion measures
Range is the very simple way to determine the level of spreadness or scatter for a given
series (Selvanathan, Selvanathan and Keller, 2014). It is found just by subtracting minimum
value from the largest one.
Range=Largest value – Lowest value
Sales=4570 – 2680=1890
Profit=420 – 160=260
Standard deviation is the another method of scatter that compares every value to the
average value to find the dispersion (Calculating Measures of Dispersion, 2014).
Year Sales Profit Dx Dx^2 Dx DX^2
2008 2680 160 -913 833569 -123 15129
2009 3140 213 -453 205209 -70 4900
2010 3360 236 -233 54289 -47 2209
2011 3400 160 -193 37249 -123 15129
2012 3130 325 -463 214369 42 1764
2013 3540 246 -53 2809 -37 1369
2014 3780 420 187 34969 137 18769
2015 4050 325 457 208849 42 1764
2016 4280 400 687 471969 117 13689
2017 4570 345 977 954529 62 3844
3017810 78566
Standard deviation−√ ∑ Dx2 / N
Sales=√ 3017810/10
¿ 549.34
Profit=√ 78566/10
7
turnover. It is the level which is equal to the 50% of the total sales. However, median profit of
the company is 285.5 GBP that is little bit above the average that represents the need for the firm
to make plans and strategies to boost their net return by controlling cost and overheads.
Lastly, mode of the profit series is found to 160 GBP because it took place twice in the
period of past 10 years.
2.3 Analyze data using dispersion measures
Range is the very simple way to determine the level of spreadness or scatter for a given
series (Selvanathan, Selvanathan and Keller, 2014). It is found just by subtracting minimum
value from the largest one.
Range=Largest value – Lowest value
Sales=4570 – 2680=1890
Profit=420 – 160=260
Standard deviation is the another method of scatter that compares every value to the
average value to find the dispersion (Calculating Measures of Dispersion, 2014).
Year Sales Profit Dx Dx^2 Dx DX^2
2008 2680 160 -913 833569 -123 15129
2009 3140 213 -453 205209 -70 4900
2010 3360 236 -233 54289 -47 2209
2011 3400 160 -193 37249 -123 15129
2012 3130 325 -463 214369 42 1764
2013 3540 246 -53 2809 -37 1369
2014 3780 420 187 34969 137 18769
2015 4050 325 457 208849 42 1764
2016 4280 400 687 471969 117 13689
2017 4570 345 977 954529 62 3844
3017810 78566
Standard deviation−√ ∑ Dx2 / N
Sales=√ 3017810/10
¿ 549.34
Profit=√ 78566/10
7
⊘ This is a preview!⊘
Do you want full access?
Subscribe today to unlock all pages.
Trusted by 1+ million students worldwide
¿ 88.63
As per the results, sales figure highly spreaded from the average results in comparison to
the profitability dispersion that standard deviation is lower to 88.63.
2.4 Explain how quartile, percentiles and correlation coefficient used to draw conclusion
Quartile is like quantile, every series has total 4 quartile and every quartile presents 25%
values of the series. A population is divided into four groups as per the distribution of values.
Percentile, on the other side, is a measure that indicates values below which a fixed percentage of
total observation falls.
Percentile Quartile Sales Profit
P25 Q1 3195 218.75
P50 Q2 3470 285.5
P75 Q3 3982.5 340
P100 Q4 4570 420
Correlation, as its name, it shows relationship between correlated series. Generally, sales
and profit shows positive association but to what extent, both affect other can be determined only
with correlation coefficient in statistics (Mukaka, 2012).
Year Sales Profit
2008 2680 160
2009 3140 213
2010 3360 236
2011 3400 160
2012 3130 325
2013 3540 246
2014 3780 420
2015 4050 325
2016 4280 400
2017 4570 345
Correlation = 0.71
Finding out the results, it is seen that correlation coefficient between profit and sales is
0.71 means they both follows moderate association because it falls in the band of 0.25 to 0.75. It
states that increase in sales raised profit by 71% or vice-versa.
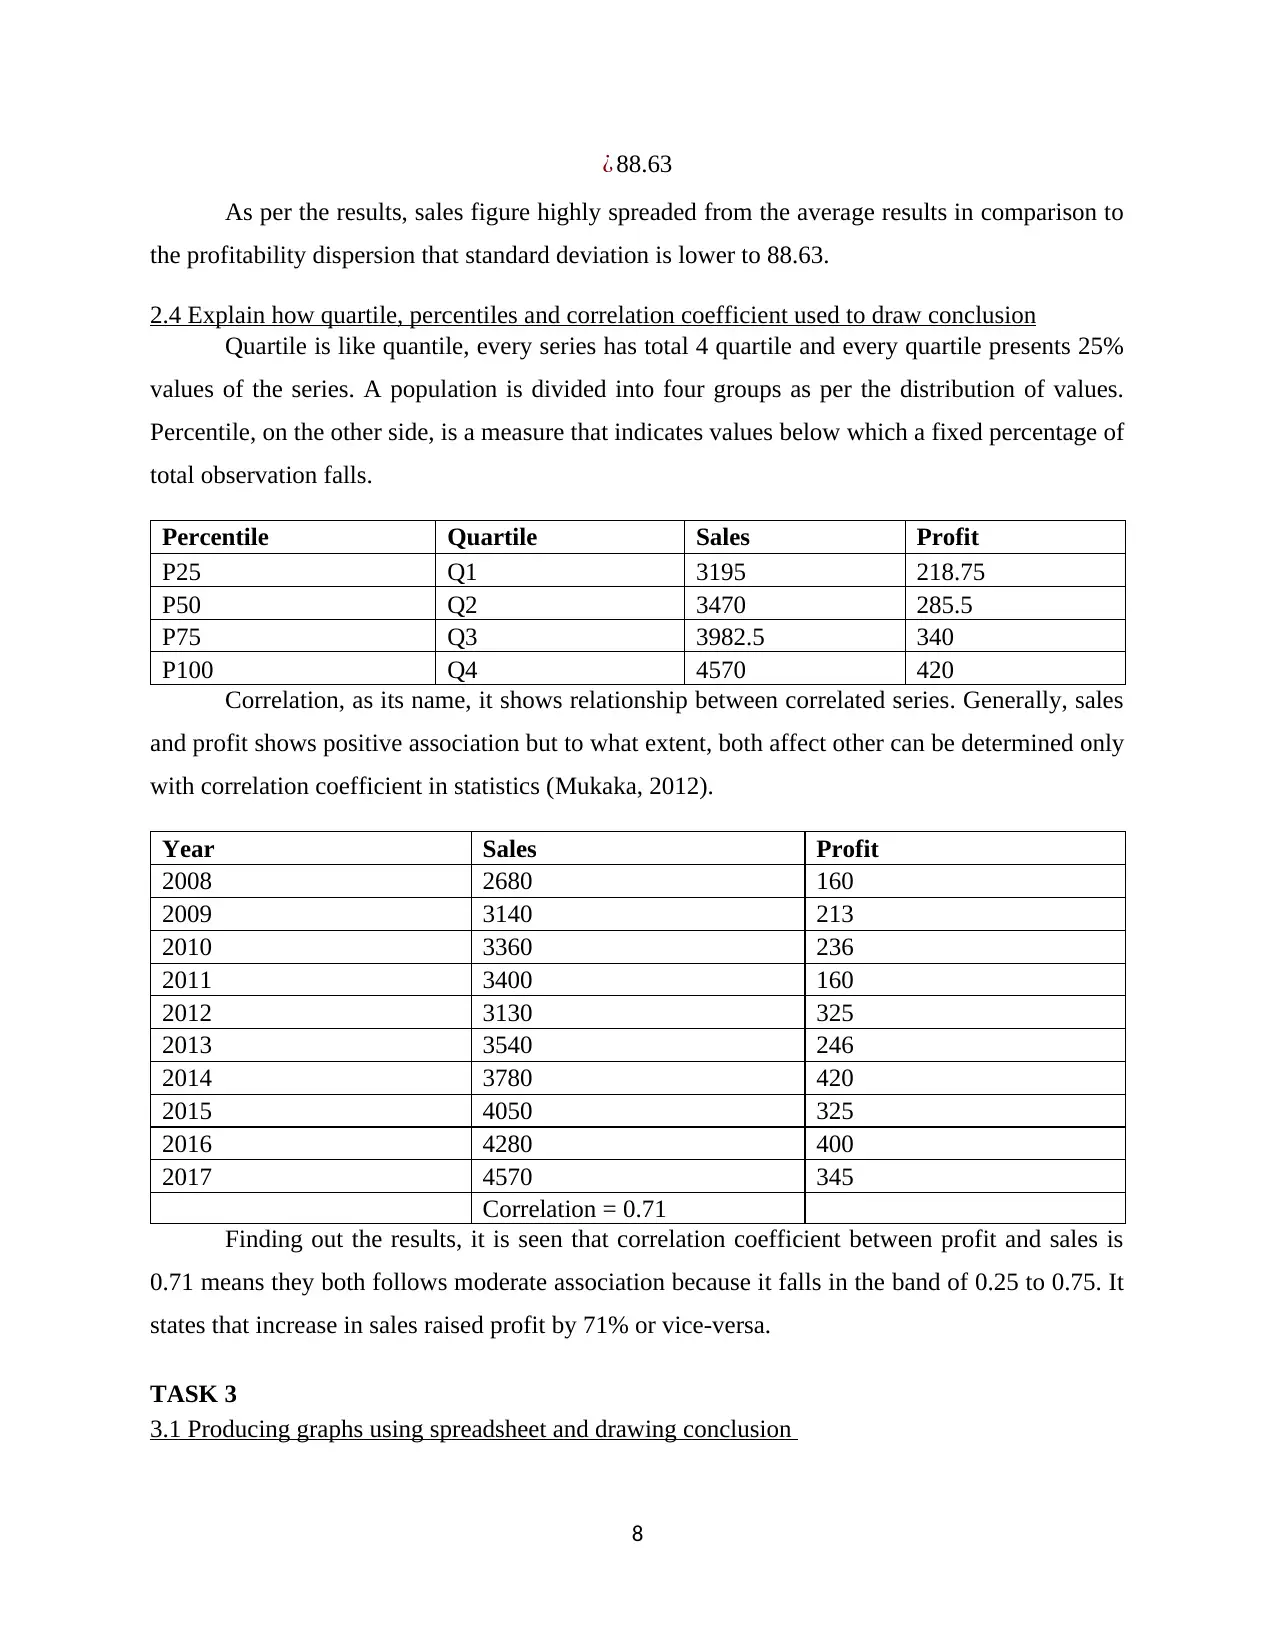
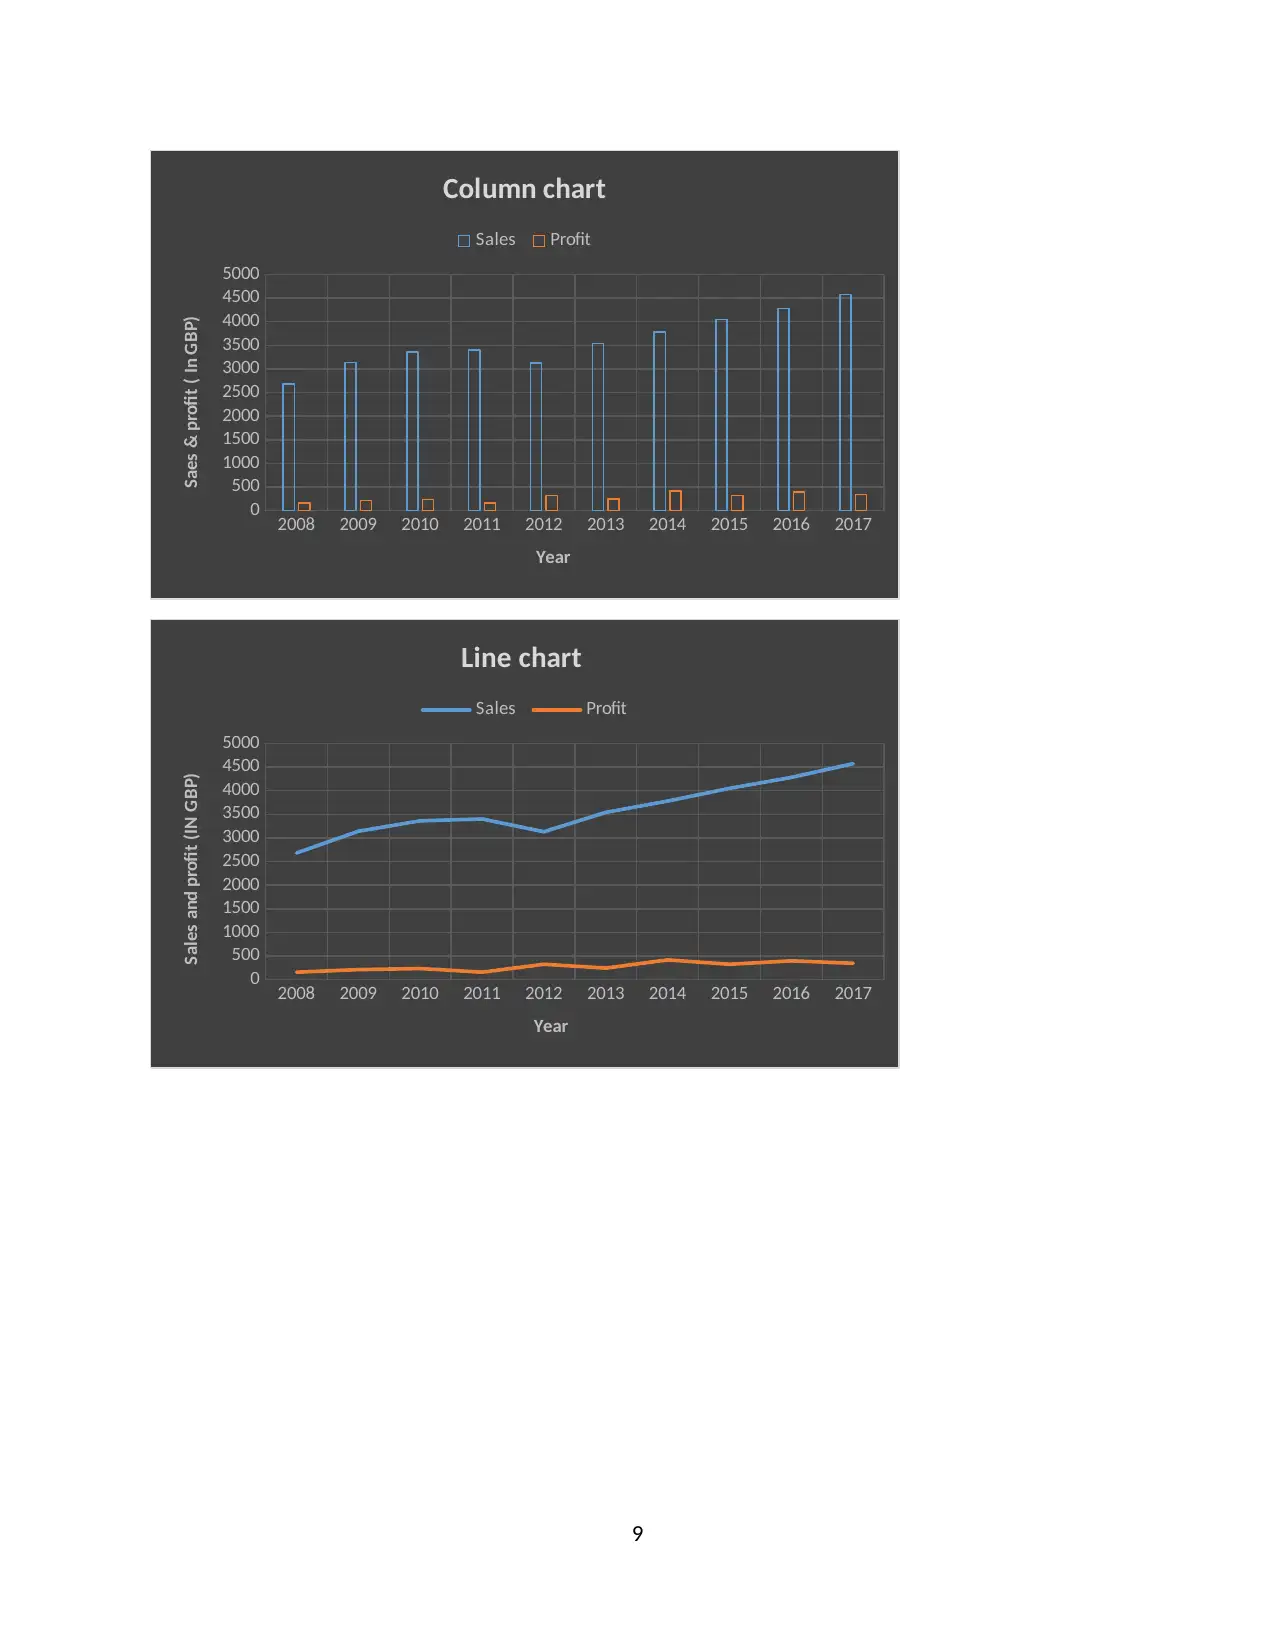
TASK 3
3.1 Producing graphs using spreadsheet and drawing conclusion
8
As per the results, sales figure highly spreaded from the average results in comparison to
the profitability dispersion that standard deviation is lower to 88.63.
2.4 Explain how quartile, percentiles and correlation coefficient used to draw conclusion
Quartile is like quantile, every series has total 4 quartile and every quartile presents 25%
values of the series. A population is divided into four groups as per the distribution of values.
Percentile, on the other side, is a measure that indicates values below which a fixed percentage of
total observation falls.
Percentile Quartile Sales Profit
P25 Q1 3195 218.75
P50 Q2 3470 285.5
P75 Q3 3982.5 340
P100 Q4 4570 420
Correlation, as its name, it shows relationship between correlated series. Generally, sales
and profit shows positive association but to what extent, both affect other can be determined only
with correlation coefficient in statistics (Mukaka, 2012).
Year Sales Profit
2008 2680 160
2009 3140 213
2010 3360 236
2011 3400 160
2012 3130 325
2013 3540 246
2014 3780 420
2015 4050 325
2016 4280 400
2017 4570 345
Correlation = 0.71
Finding out the results, it is seen that correlation coefficient between profit and sales is
0.71 means they both follows moderate association because it falls in the band of 0.25 to 0.75. It
states that increase in sales raised profit by 71% or vice-versa.
TASK 3
3.1 Producing graphs using spreadsheet and drawing conclusion
8
Paraphrase This Document
Need a fresh take? Get an instant paraphrase of this document with our AI Paraphraser
2008 2009 2010 2011 2012 2013 2014 2015 2016 2017
0
500
1000
1500
2000
2500
3000
3500
4000
4500
5000
Column chart
Sales Profit
Year
Saes & profit ( In GBP)
2008 2009 2010 2011 2012 2013 2014 2015 2016 2017
0
500
1000
1500
2000
2500
3000
3500
4000
4500
5000
Line chart
Sales Profit
Year
Sales and profit (IN GBP)
9
0
500
1000
1500
2000
2500
3000
3500
4000
4500
5000
Column chart
Sales Profit
Year
Saes & profit ( In GBP)
2008 2009 2010 2011 2012 2013 2014 2015 2016 2017
0
500
1000
1500
2000
2500
3000
3500
4000
4500
5000
Line chart
Sales Profit
Year
Sales and profit (IN GBP)
9
2008
2009
2010
2011
2012
2013
2014
2015
2016
2017
0 500 1000 1500 2000 2500 3000 3500 4000 4500 5000
Bar chart
Profit Sales
Sales and profit ( In GBP)
Year
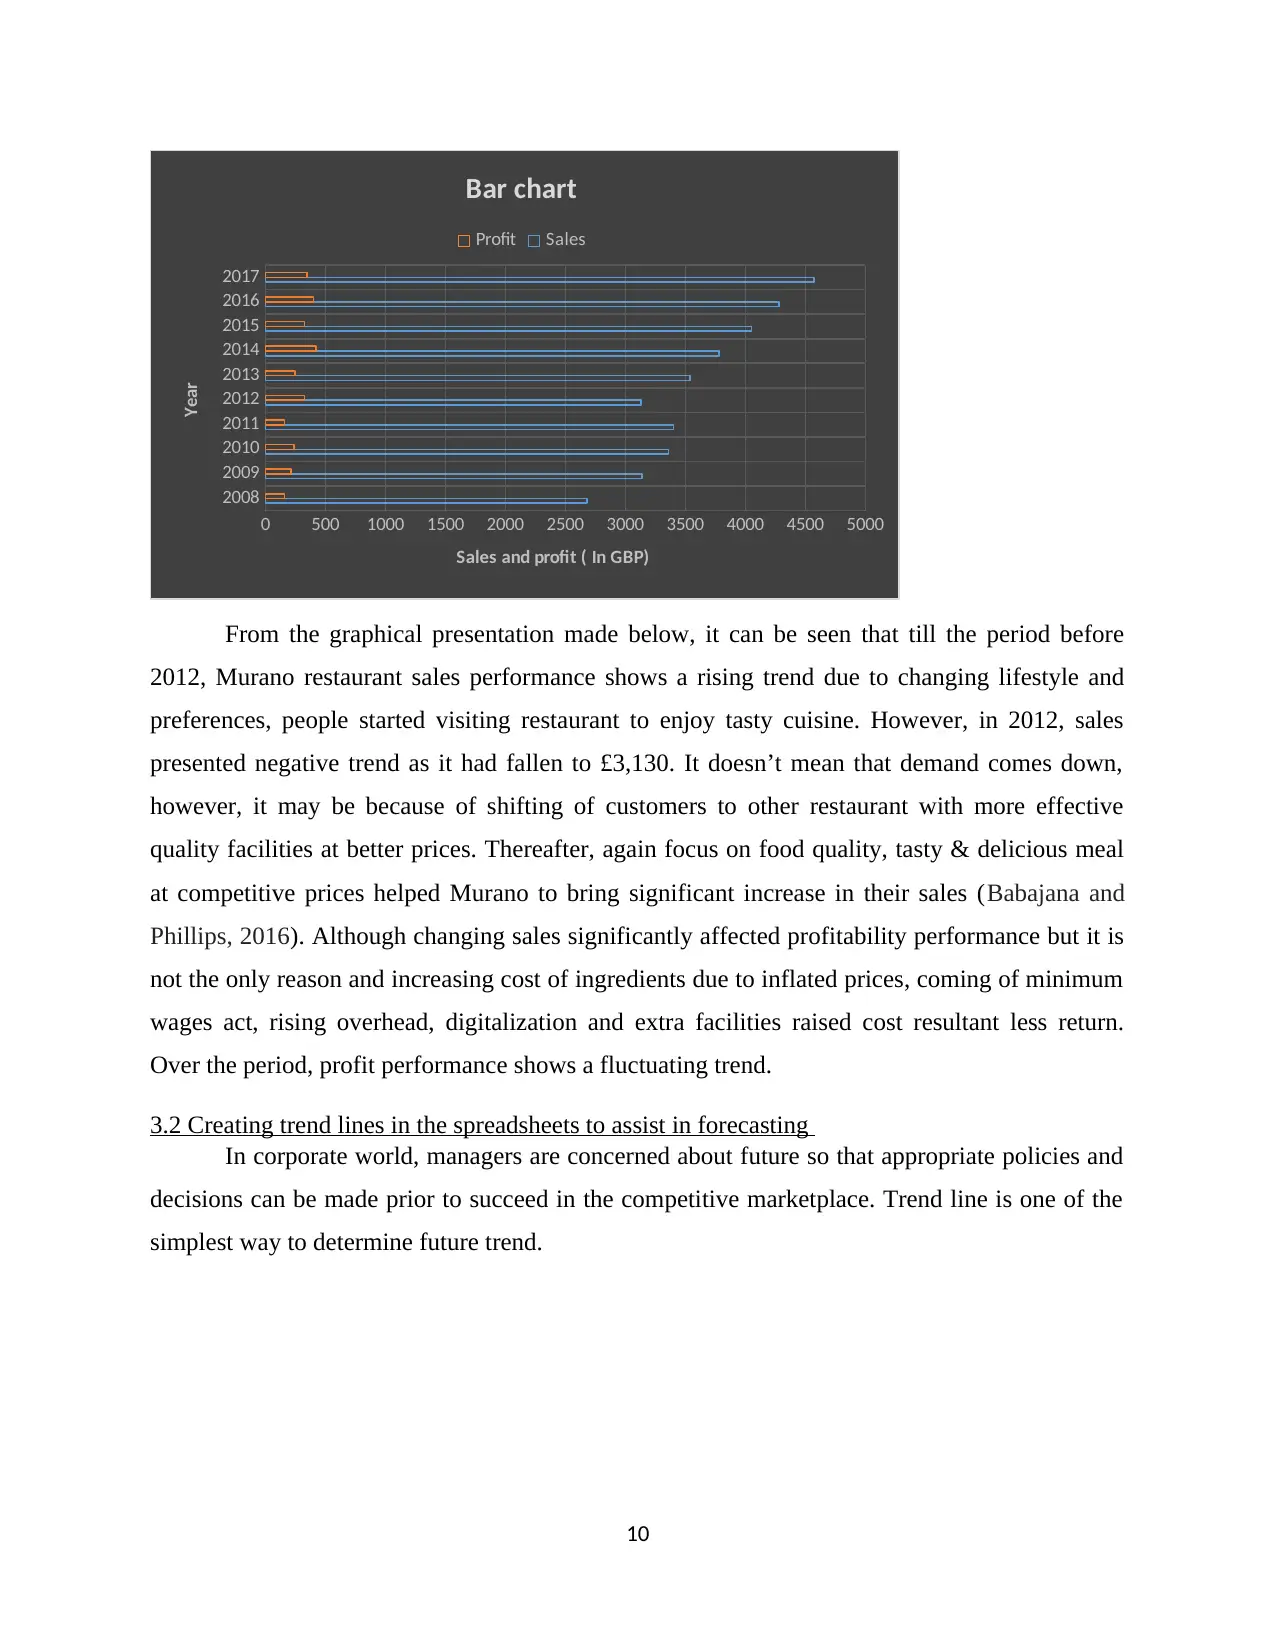
From the graphical presentation made below, it can be seen that till the period before
2012, Murano restaurant sales performance shows a rising trend due to changing lifestyle and
preferences, people started visiting restaurant to enjoy tasty cuisine. However, in 2012, sales
presented negative trend as it had fallen to £3,130. It doesn’t mean that demand comes down,
however, it may be because of shifting of customers to other restaurant with more effective
quality facilities at better prices. Thereafter, again focus on food quality, tasty & delicious meal
at competitive prices helped Murano to bring significant increase in their sales (Babajana and
Phillips, 2016). Although changing sales significantly affected profitability performance but it is
not the only reason and increasing cost of ingredients due to inflated prices, coming of minimum
wages act, rising overhead, digitalization and extra facilities raised cost resultant less return.
Over the period, profit performance shows a fluctuating trend.
3.2 Creating trend lines in the spreadsheets to assist in forecasting
In corporate world, managers are concerned about future so that appropriate policies and
decisions can be made prior to succeed in the competitive marketplace. Trend line is one of the
simplest way to determine future trend.
10
2009
2010
2011
2012
2013
2014
2015
2016
2017
0 500 1000 1500 2000 2500 3000 3500 4000 4500 5000
Bar chart
Profit Sales
Sales and profit ( In GBP)
Year
From the graphical presentation made below, it can be seen that till the period before
2012, Murano restaurant sales performance shows a rising trend due to changing lifestyle and
preferences, people started visiting restaurant to enjoy tasty cuisine. However, in 2012, sales
presented negative trend as it had fallen to £3,130. It doesn’t mean that demand comes down,
however, it may be because of shifting of customers to other restaurant with more effective
quality facilities at better prices. Thereafter, again focus on food quality, tasty & delicious meal
at competitive prices helped Murano to bring significant increase in their sales (Babajana and
Phillips, 2016). Although changing sales significantly affected profitability performance but it is
not the only reason and increasing cost of ingredients due to inflated prices, coming of minimum
wages act, rising overhead, digitalization and extra facilities raised cost resultant less return.
Over the period, profit performance shows a fluctuating trend.
3.2 Creating trend lines in the spreadsheets to assist in forecasting
In corporate world, managers are concerned about future so that appropriate policies and
decisions can be made prior to succeed in the competitive marketplace. Trend line is one of the
simplest way to determine future trend.
10
⊘ This is a preview!⊘
Do you want full access?
Subscribe today to unlock all pages.
Trusted by 1+ million students worldwide
1 out of 19
Related Documents


Your All-in-One AI-Powered Toolkit for Academic Success.
+13062052269
info@desklib.com
Available 24*7 on WhatsApp / Email
![[object Object]](/_next/static/media/star-bottom.7253800d.svg)
Unlock your academic potential
Copyright © 2020–2026 A2Z Services. All Rights Reserved. Developed and managed by ZUCOL.