Business Decision Making Task 3: Customer Satisfaction Analysis Report

Verified

Added on  2023/04/04

|13
|301
|311
Report
AI Summary
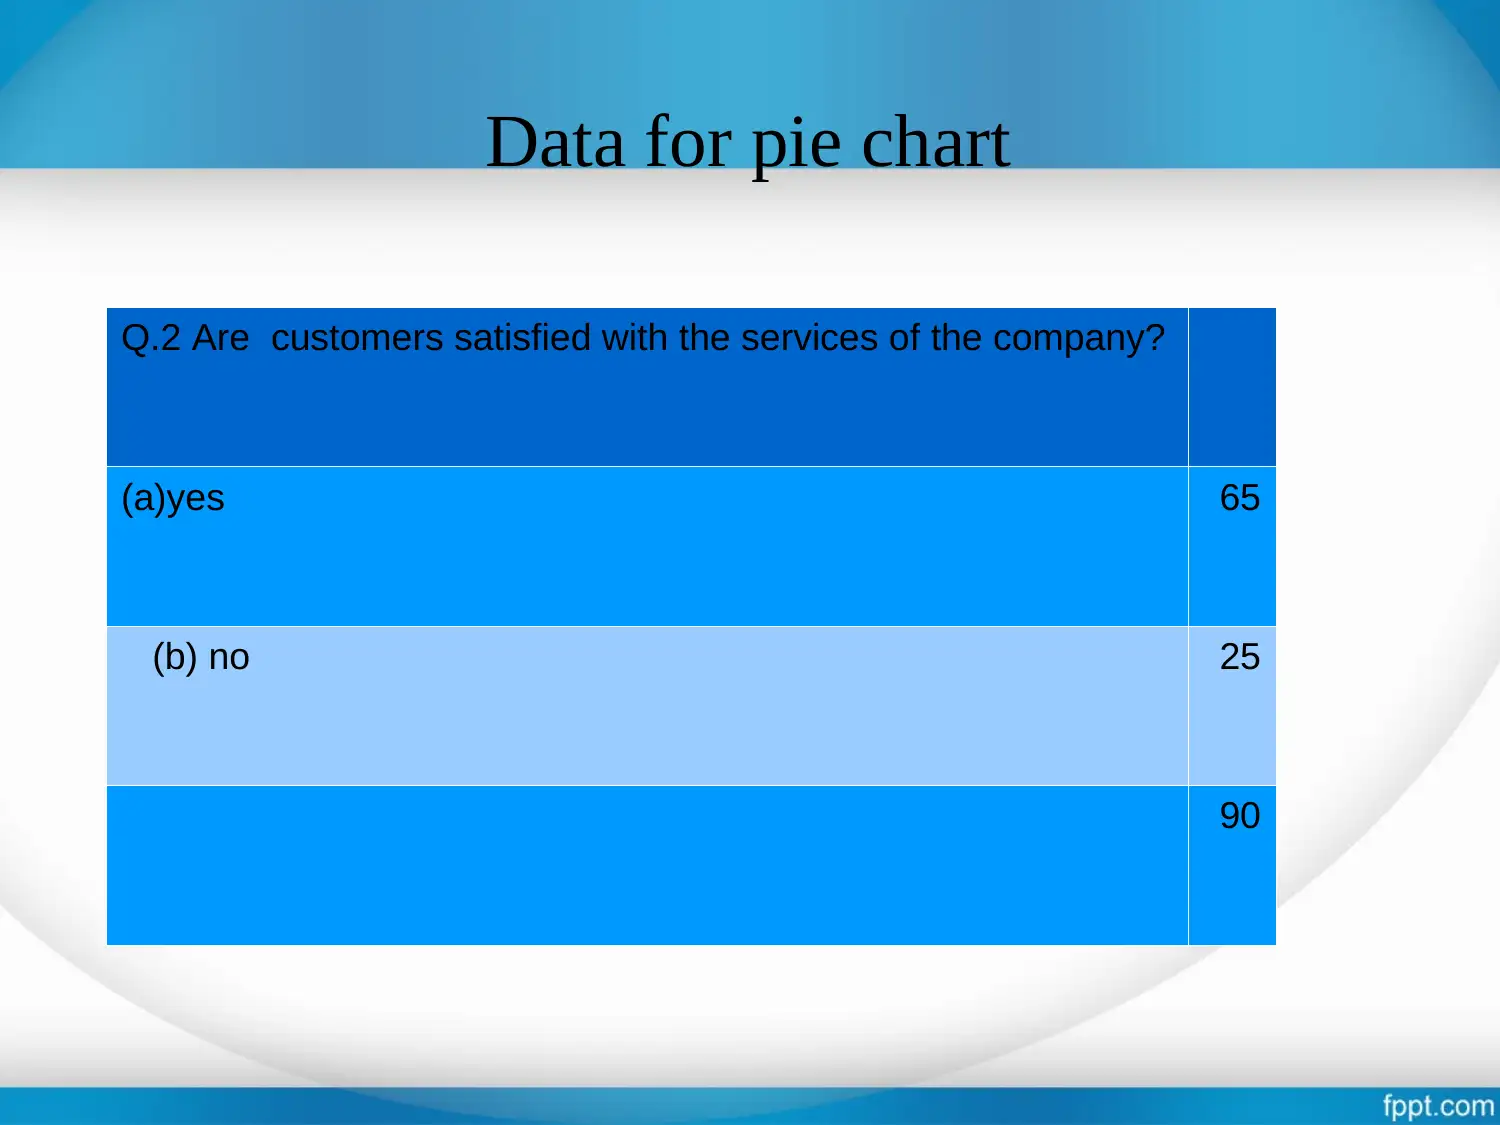
This report examines business decision-making through the lens of customer satisfaction. It outlines the objectives, research methodology (simple random sampling), and data collected from traveler feedback regarding their experiences. The data, presented in bar and pie charts, reveals insights into customer awareness of the company (via social and print media) and their satisfaction levels with the services provided. Key findings indicate a need for more advanced services for tourists, suggesting that improvements in existing services could boost business. Recommendations include enhanced e-learning facilities and quality learning experiences for international students to foster personal development. The report concludes with a list of references and a thank you note.
Document Page
Business Decision
Making
Task 3 ( Part-C)
tabler-icon-diamond-filled.svg

Paraphrase This Document

Need a fresh take? Get an instant paraphrase of this document with our AI Paraphraser
Document Page
COVER CONTENT
Introduction
Objectives
Research methodology
Data for bar chart
Data for pie chart
Findings
Suggestions
References
Document Page
INTRODUCTION
Business decision making is a process through
management of distinct enterprise reach to a particular
decision which offers maximum advantage to the
company. Following report will discuss the different
modes through which company takes its important
judgement.
Document Page
OBJECTIVES
Under this report feedbacks from different travellers is
recorded regarding their experience in their journey
tabler-icon-diamond-filled.svg

Paraphrase This Document

Need a fresh take? Get an instant paraphrase of this document with our AI Paraphraser
Document Page
Research Methodology
Gap between clients and organisations is ascertain in this
report
Simple random sampling is utilised
Data is collected through asking relevant questions from
various respondents
Data is presented in different graphs and charts.
Document Page
Data for bar chart
Q.1 From where the customers got to
know about the company?
(a) Social media 55
(b) Print media 35
Document Page
Continue..
(a) Social media (b) Print media
0
10
20
30
40
50
60
55
35
Series1
Series2
Series3
Series4
tabler-icon-diamond-filled.svg

Paraphrase This Document

Need a fresh take? Get an instant paraphrase of this document with our AI Paraphraser
Document Page
Data for pie chart
Q.2 Are customers satisfied with the services of the company?
(a)yes 65
(b) no 25
90
Document Page
Continue..
65
25
Document Page
FINDINGS
Tourists need more advanced services while their journey.
By doing advancement in the existing services company
can increase its total business
tabler-icon-diamond-filled.svg

Paraphrase This Document

Need a fresh take? Get an instant paraphrase of this document with our AI Paraphraser
Document Page
SUGGESTION
More E- Teaching facilities can be provided to the
students.
Those students which are come outside of the country can
be provide more quality learning so that their personality
can be groom.
Document Page
REFERENCES
Parnell, G.S., Driscoll, P.J. and Henderson, D.L. Eds., 2011.
Decision making in systems engineering and
management (Vol. 81). John Wiley & Sons.
Pettigrew, A.M., 2014. The politics of organizational
decision-making. Routledge.
Solomon, M.R., 2014. Consumer behavior: Buying, having,
and being (Vol. 10). Upper Saddle River, NJ: Prentice
Hall.
chevron_up_icon
1 out of 13
circle_padding
hide_on_mobile
zoom_out_icon
[object Object]