Business Decision Making: Student Experience and Data Analysis Report
VerifiedAdded on 2020/06/05
|21
|4419
|48
Report
AI Summary
This report presents an analysis of business decision-making processes, focusing on student experience and satisfaction at UKCBC College. The report outlines a plan for gathering data, differentiating between primary and secondary research methods. It details the use of survey methods and sampling frameworks, including the rationale for the study and the composition of the questionnaire used to collect data from 200 respondents. The report then moves on to data analysis, including data estimation, forecasting, and dispersion, using measures such as mean, median, mode, variance, and standard deviation to interpret student feedback on various aspects of the college, such as teaching services, management, and overall environment. The findings are presented using quartiles and percentiles to provide a comprehensive view of student satisfaction levels. The analysis aims to provide insights for improving services at UKCBC.
Business Decision
Making
Making
Paraphrase This Document
Need a fresh take? Get an instant paraphrase of this document with our AI Paraphraser
INTRODUCTION
Decisions can be taken by the firm after having extensive research. But before going to
make certain research, there is a strong need to make certain things which could be made out in
order to render effective services (Goodall, 2014). The business decisions help a firm in order to
make certain decisions effectively. Under this research, the UKCBC College students experience
and satisfaction is presented to the Quality Assurance Agency. However, this could be said that
the researcher needs to adopt this by using their business plan in an effective manner. there are
various ways by which the researcher can gather the data by using primary and secondary
method. However, this can be said that this is totally based on the researcher data requirement
needs. But there is a strong requirement which are required to know through primary data and
secondary data methods.
TASK 1
1.1 Produce a plan for gathering of data:
The data collection technique is the most crucial manner which are required to make their
certain tools effectively. Information could be made in order to satiate information which are
required so that the management could make out their strategy in a the most effective manner.
The data requirement need is totally based on the researcher mood as he gathers data according
to their need (Gaillard, 2014). Normally, this can be said that there are mainly two main
information gathering channel which are required to make in order to make decisions. But before
going to gather the data, there is a need to know about what kind of research tool is required to
collect the data. This are defined in details:
Primary research: This is the research tool which is made for the first time in order to
make information. The data via using this tool can be collected so that they could build an
effective strategy. Although, the company needs to make certain tools that can be used by the
firm in order build effective decisions. However, this can be said that the reliability of the data is
at the highest level. Management by using this research method build information which would
further makes decisions in an effective manner. The management needs to use this research tool
which would further helps out to make effective business decisions. As this can be said that the
data gathered by using this tool is having high reliability in terms of data. There are various tools
which are used in order to collect the data by using this tool. Some of them are: telephone,
1
⊘ This is a preview!⊘
Do you want full access?
Subscribe today to unlock all pages.
Trusted by 1+ million students worldwide
interviews, survey, observation and others. but there is also have few drawbacks. One of them is
that this needs huge capital while gathering the data from the marketplace. Henceforth, this is
only possible if the data requirement is less.
Secondary data: this is the research tool which is already used or published. If the
researcher is going to gather the data by using secondary data tool, then it becomes very easy to
get the data and make the information useful for making business decisions (Franks and et. al.,
2014). Under this, various sources through which the secondary data can be gathered, some of
them are: books, journals, and other published information. This research is known as the desk
research. this covers data collected through library, internet or the survey.
The crucial thing is that to have the raw data which can be used for evaluating,
implementing and storing the data in order to ensure higher safety. But before going to collect
the data, researcher is needed to face various following issues that are needed in order to gather
data about the research.
1.2 Survey method and sampling framework:
Survey method is used by the researcher in order to collect the data. Information is
collected by the young generation about student experience and satisfaction, for gathering this
report, this has been observed that the primary research is needed to convene that are going to
help for framing research (Delen, 2014). This can most important that the representative of the
cited college to determine about must be seen, behaviour and perception of the whole students
which reflects the UKCBC college. Before going to gather the research, this is needed to know
about the students from whom data is collected. As per this case, research is required in order to
make certain tools that would help out to make decisions. In research method, this can be said
that various aspects are discussed and they are defined in details:
Rational of study: This covers the most important and valid evidence which are rendered
in link up to the researches in order to attain few advantages out of it. The crucial aspects which
is required to be concentrates while making any kind of surveys is that they ensure any kind of
literature gap which falls between the last and current information. If this is found, then in that
case it is requires to be reduced (Cash Flow, 2017). There could be so many problems which are
needed to face out at the time of procedure for convening research analysis. This is rightly
observed that by doing surveys this can be sorted out. However, professional growth could be
2
Paraphrase This Document
Need a fresh take? Get an instant paraphrase of this document with our AI Paraphraser
attained by convened by doing rational research analysis, that would have adopted as this is the
assistive step for development in the long term.
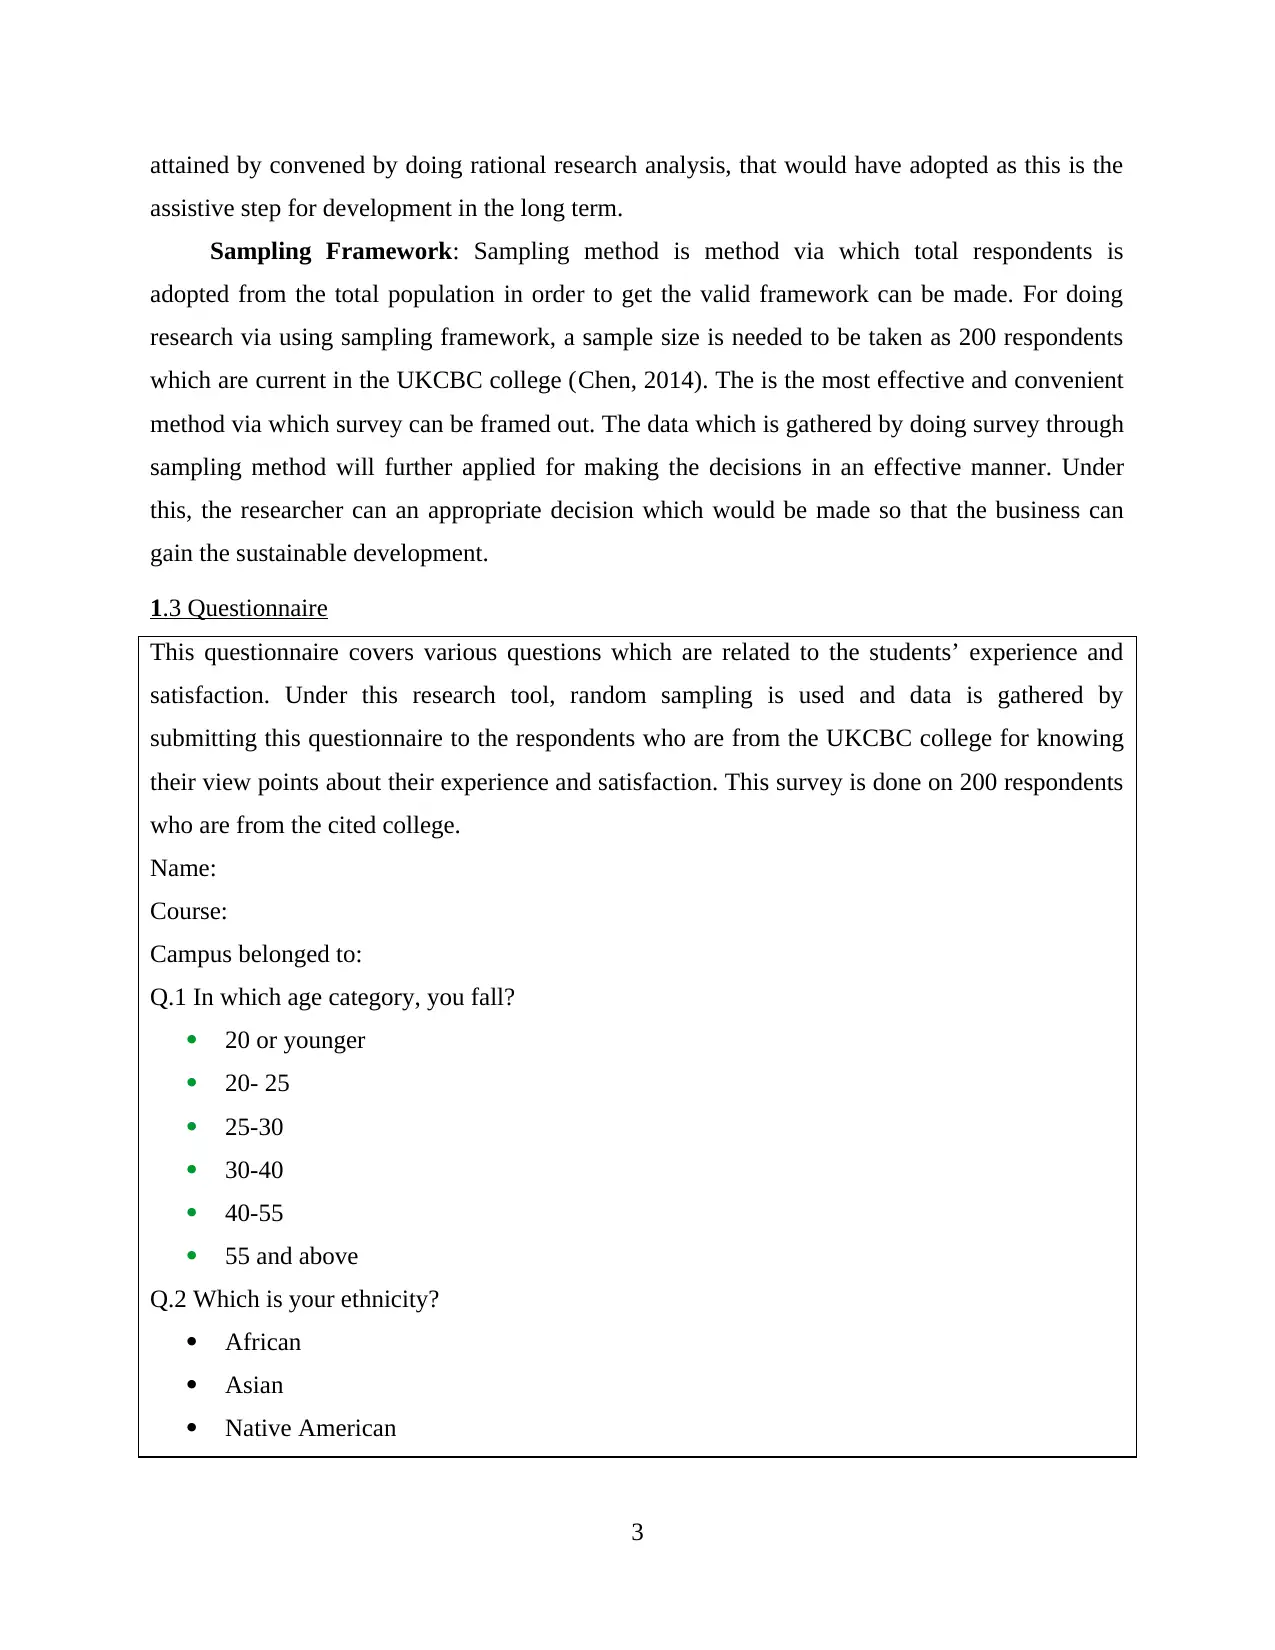
Sampling Framework: Sampling method is method via which total respondents is
adopted from the total population in order to get the valid framework can be made. For doing
research via using sampling framework, a sample size is needed to be taken as 200 respondents
which are current in the UKCBC college (Chen, 2014). The is the most effective and convenient
method via which survey can be framed out. The data which is gathered by doing survey through
sampling method will further applied for making the decisions in an effective manner. Under
this, the researcher can an appropriate decision which would be made so that the business can
gain the sustainable development.
1.3 Questionnaire
This questionnaire covers various questions which are related to the students’ experience and
satisfaction. Under this research tool, random sampling is used and data is gathered by
submitting this questionnaire to the respondents who are from the UKCBC college for knowing
their view points about their experience and satisfaction. This survey is done on 200 respondents
who are from the cited college.
Name:
Course:
Campus belonged to:
Q.1 In which age category, you fall?
20 or younger
20- 25
25-30
30-40
40-55
55 and above
Q.2 Which is your ethnicity?
African
Asian
Native American
3
assistive step for development in the long term.
Sampling Framework: Sampling method is method via which total respondents is
adopted from the total population in order to get the valid framework can be made. For doing
research via using sampling framework, a sample size is needed to be taken as 200 respondents
which are current in the UKCBC college (Chen, 2014). The is the most effective and convenient
method via which survey can be framed out. The data which is gathered by doing survey through
sampling method will further applied for making the decisions in an effective manner. Under
this, the researcher can an appropriate decision which would be made so that the business can
gain the sustainable development.
1.3 Questionnaire
This questionnaire covers various questions which are related to the students’ experience and
satisfaction. Under this research tool, random sampling is used and data is gathered by
submitting this questionnaire to the respondents who are from the UKCBC college for knowing
their view points about their experience and satisfaction. This survey is done on 200 respondents
who are from the cited college.
Name:
Course:
Campus belonged to:
Q.1 In which age category, you fall?
20 or younger
20- 25
25-30
30-40
40-55
55 and above
Q.2 Which is your ethnicity?
African
Asian
Native American
3
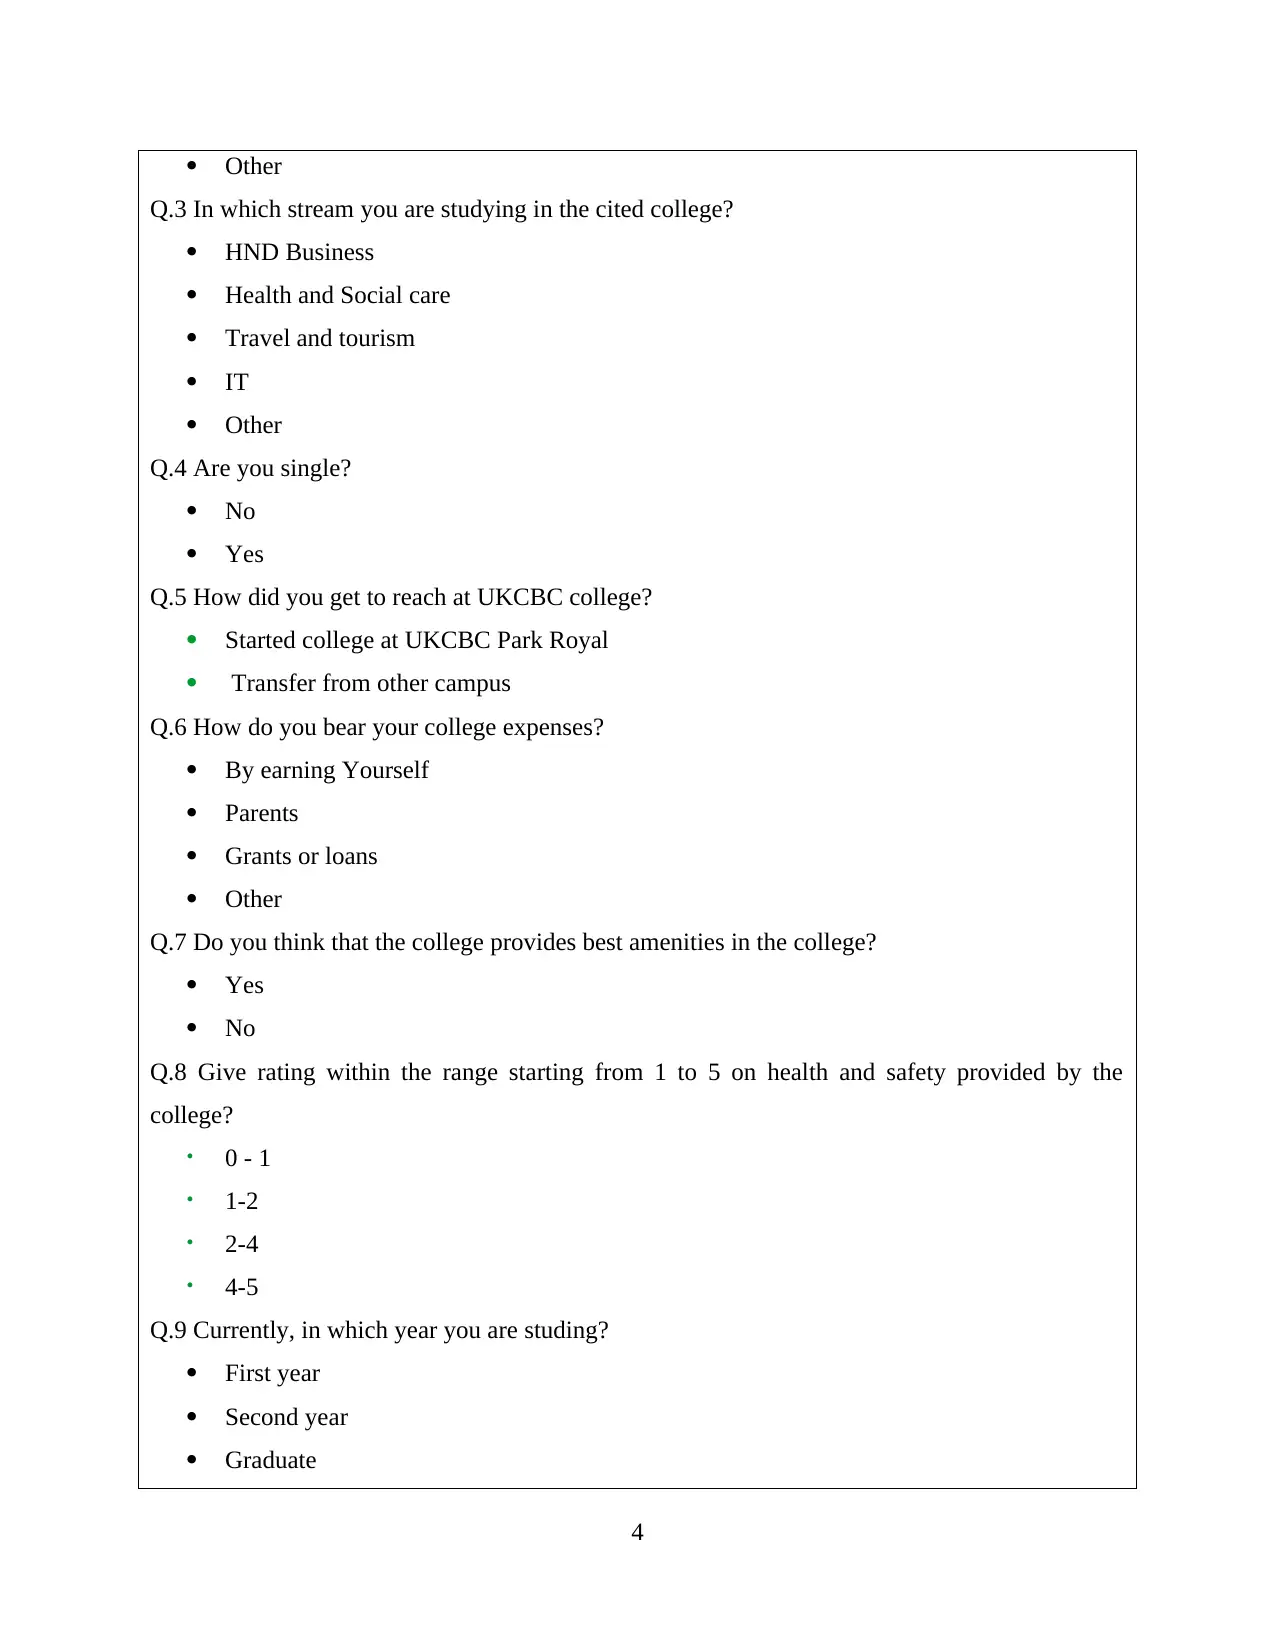
Other
Q.3 In which stream you are studying in the cited college?
HND Business
Health and Social care
Travel and tourism
IT
Other
Q.4 Are you single?
No
Yes
Q.5 How did you get to reach at UKCBC college?
Started college at UKCBC Park Royal
Transfer from other campus
Q.6 How do you bear your college expenses?
By earning Yourself
Parents
Grants or loans
Other
Q.7 Do you think that the college provides best amenities in the college?
Yes
No
Q.8 Give rating within the range starting from 1 to 5 on health and safety provided by the
college?
0 - 1
1-2
2-4
4-5
Q.9 Currently, in which year you are studing?
First year
Second year
Graduate
4
⊘ This is a preview!⊘
Do you want full access?
Subscribe today to unlock all pages.
Trusted by 1+ million students worldwide
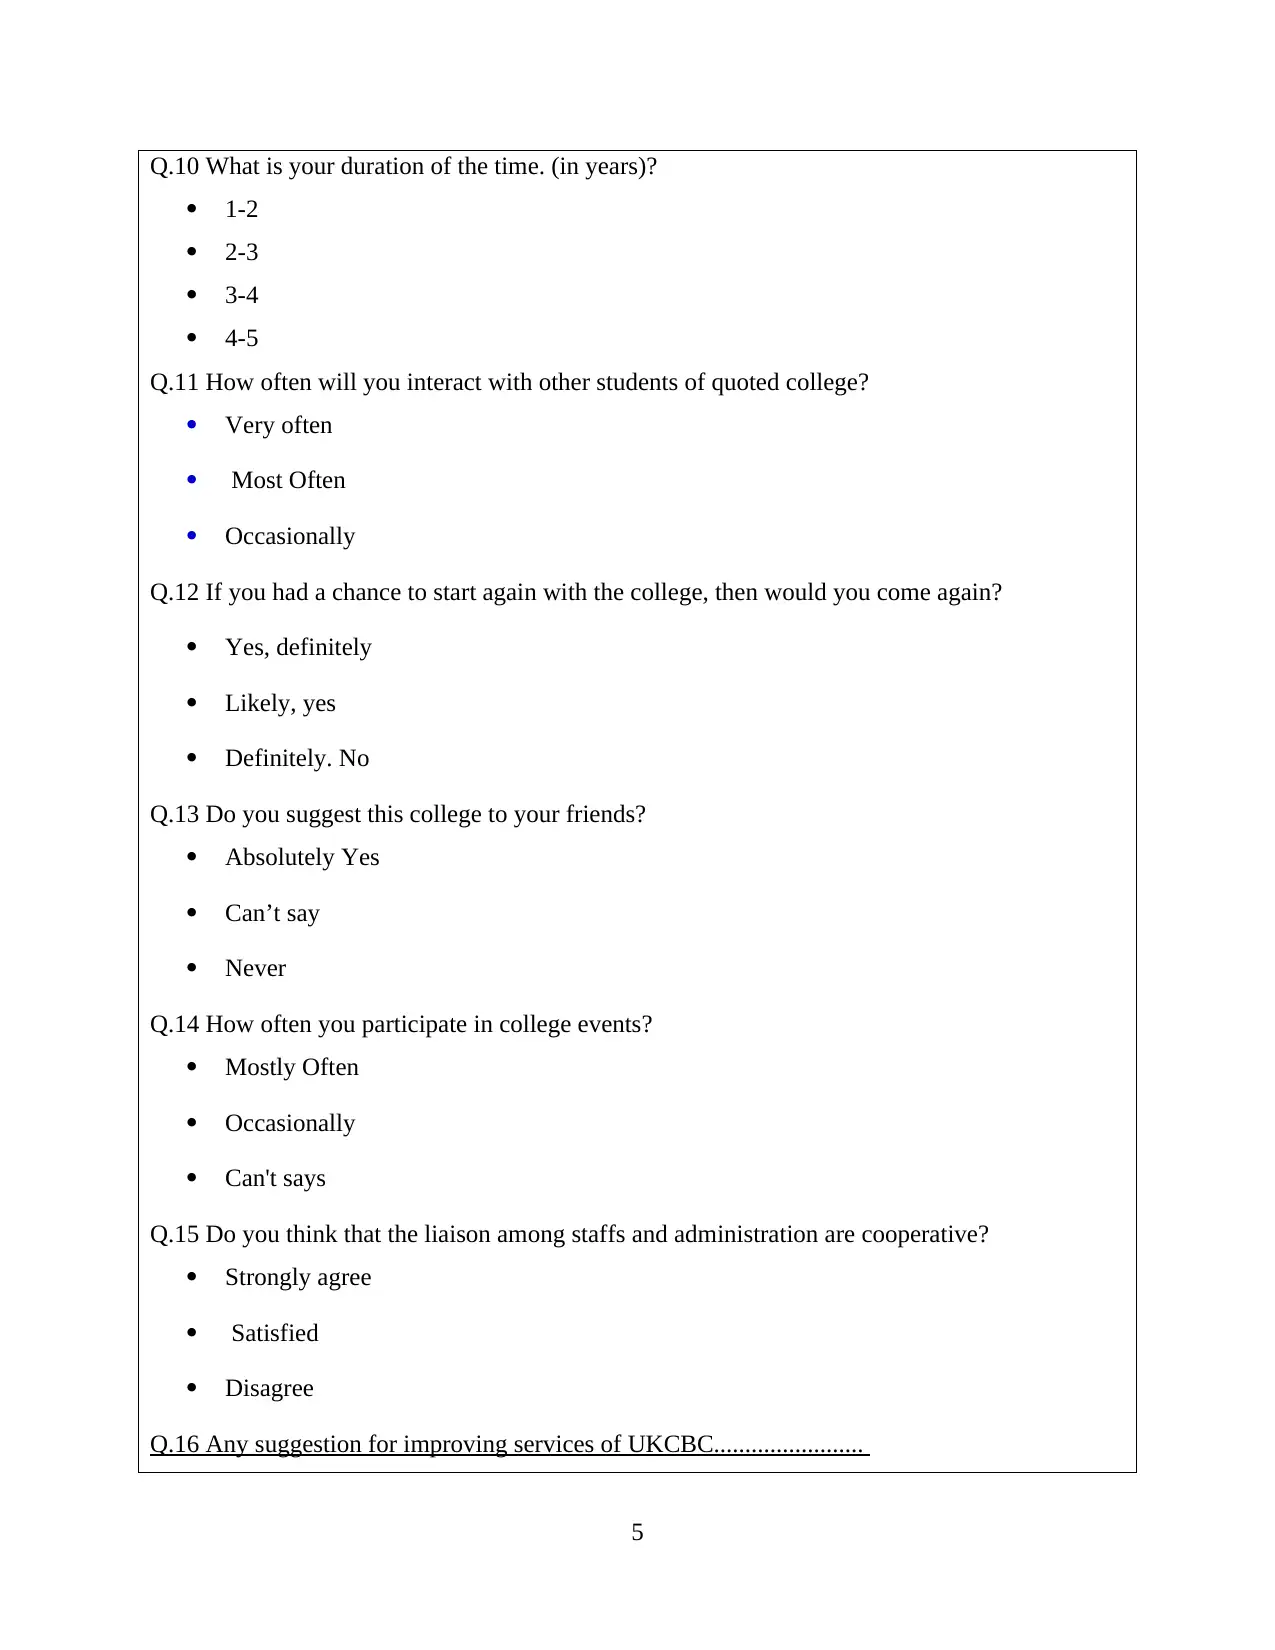
Q.10 What is your duration of the time. (in years)?
1-2
2-3
3-4
4-5
Q.11 How often will you interact with other students of quoted college?
Very often
Most Often
Occasionally
Q.12 If you had a chance to start again with the college, then would you come again?
Yes, definitely
Likely, yes
Definitely. No
Q.13 Do you suggest this college to your friends?
Absolutely Yes
Can’t say
Never
Q.14 How often you participate in college events?
Mostly Often
Occasionally
Can't says
Q.15 Do you think that the liaison among staffs and administration are cooperative?
Strongly agree
Satisfied
Disagree
Q.16 Any suggestion for improving services of UKCBC........................
5
Paraphrase This Document
Need a fresh take? Get an instant paraphrase of this document with our AI Paraphraser
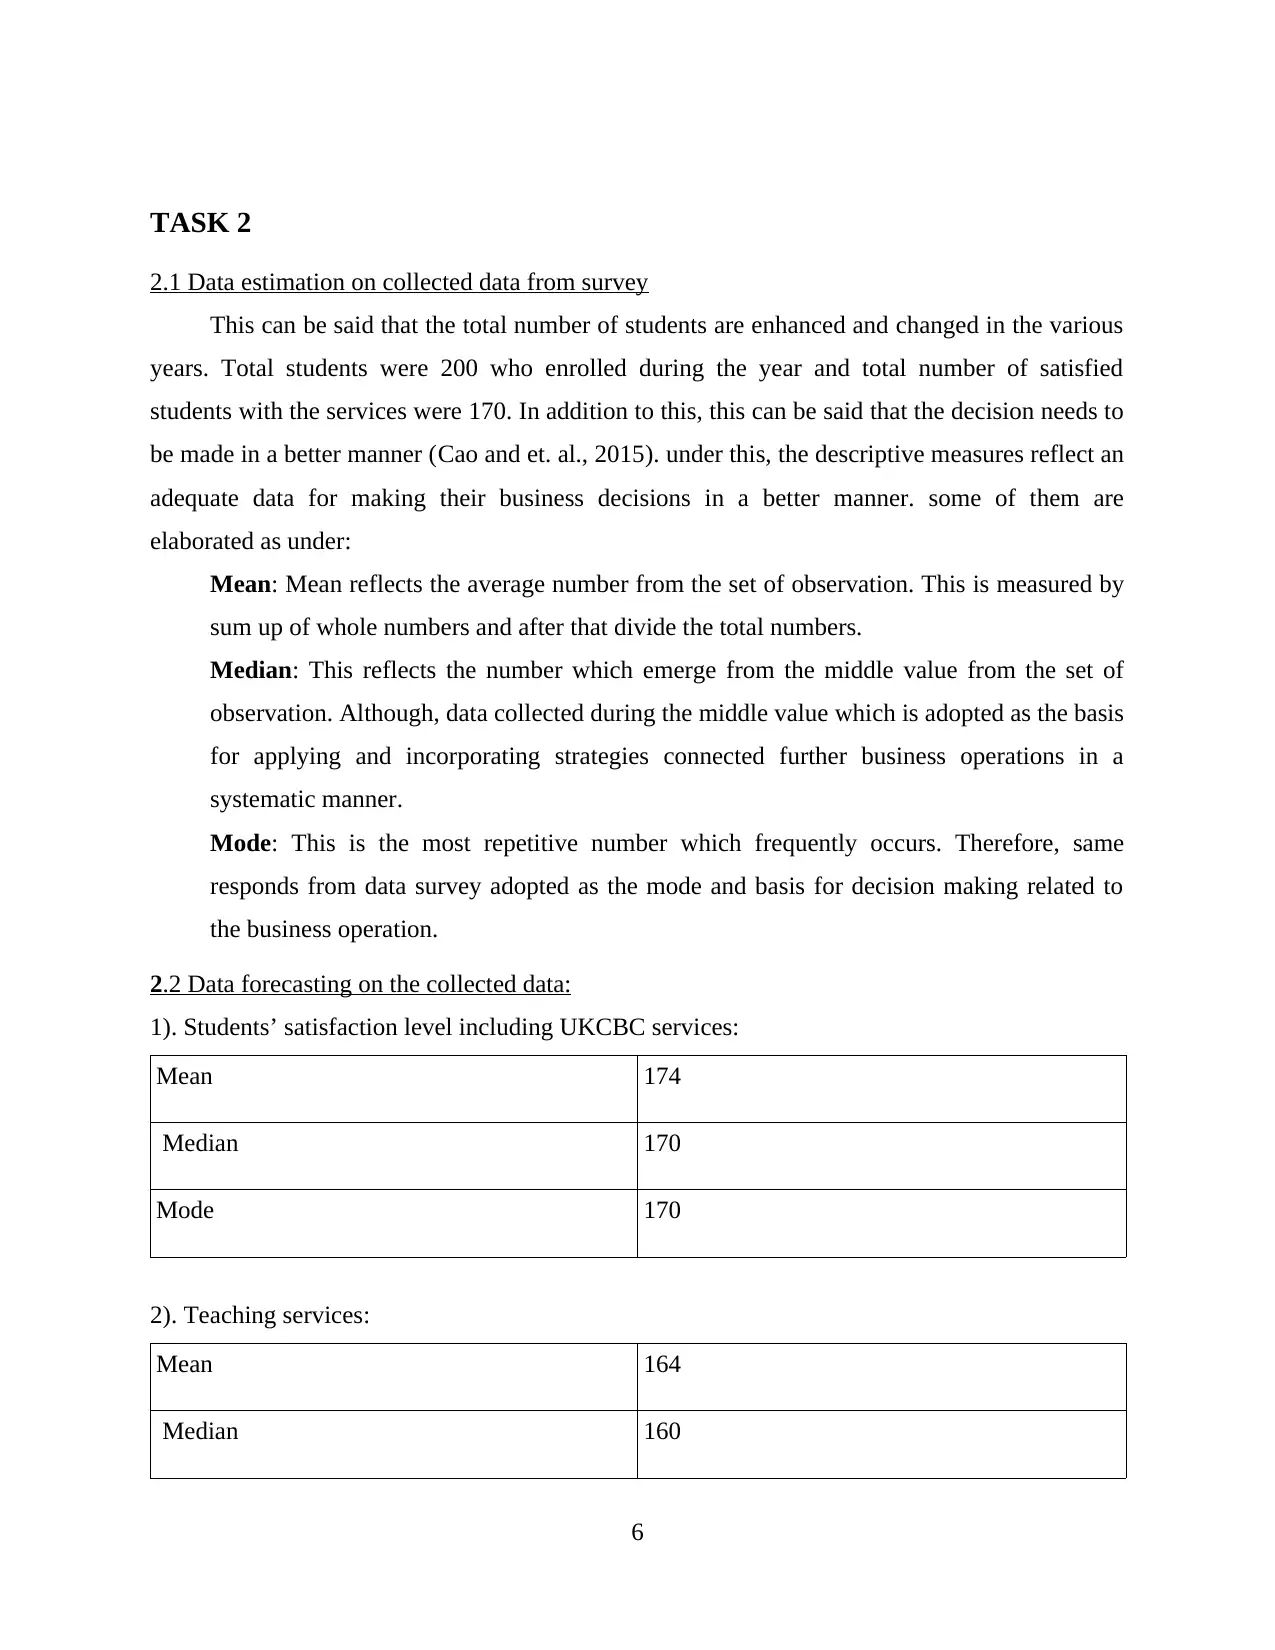
TASK 2
2.1 Data estimation on collected data from survey
This can be said that the total number of students are enhanced and changed in the various
years. Total students were 200 who enrolled during the year and total number of satisfied
students with the services were 170. In addition to this, this can be said that the decision needs to
be made in a better manner (Cao and et. al., 2015). under this, the descriptive measures reflect an
adequate data for making their business decisions in a better manner. some of them are
elaborated as under:
Mean: Mean reflects the average number from the set of observation. This is measured by
sum up of whole numbers and after that divide the total numbers.
Median: This reflects the number which emerge from the middle value from the set of
observation. Although, data collected during the middle value which is adopted as the basis
for applying and incorporating strategies connected further business operations in a
systematic manner.
Mode: This is the most repetitive number which frequently occurs. Therefore, same
responds from data survey adopted as the mode and basis for decision making related to
the business operation.
2.2 Data forecasting on the collected data:
1). Students’ satisfaction level including UKCBC services:
Mean 174
Median 170
Mode 170
2). Teaching services:
Mean 164
Median 160
6
Mode 160
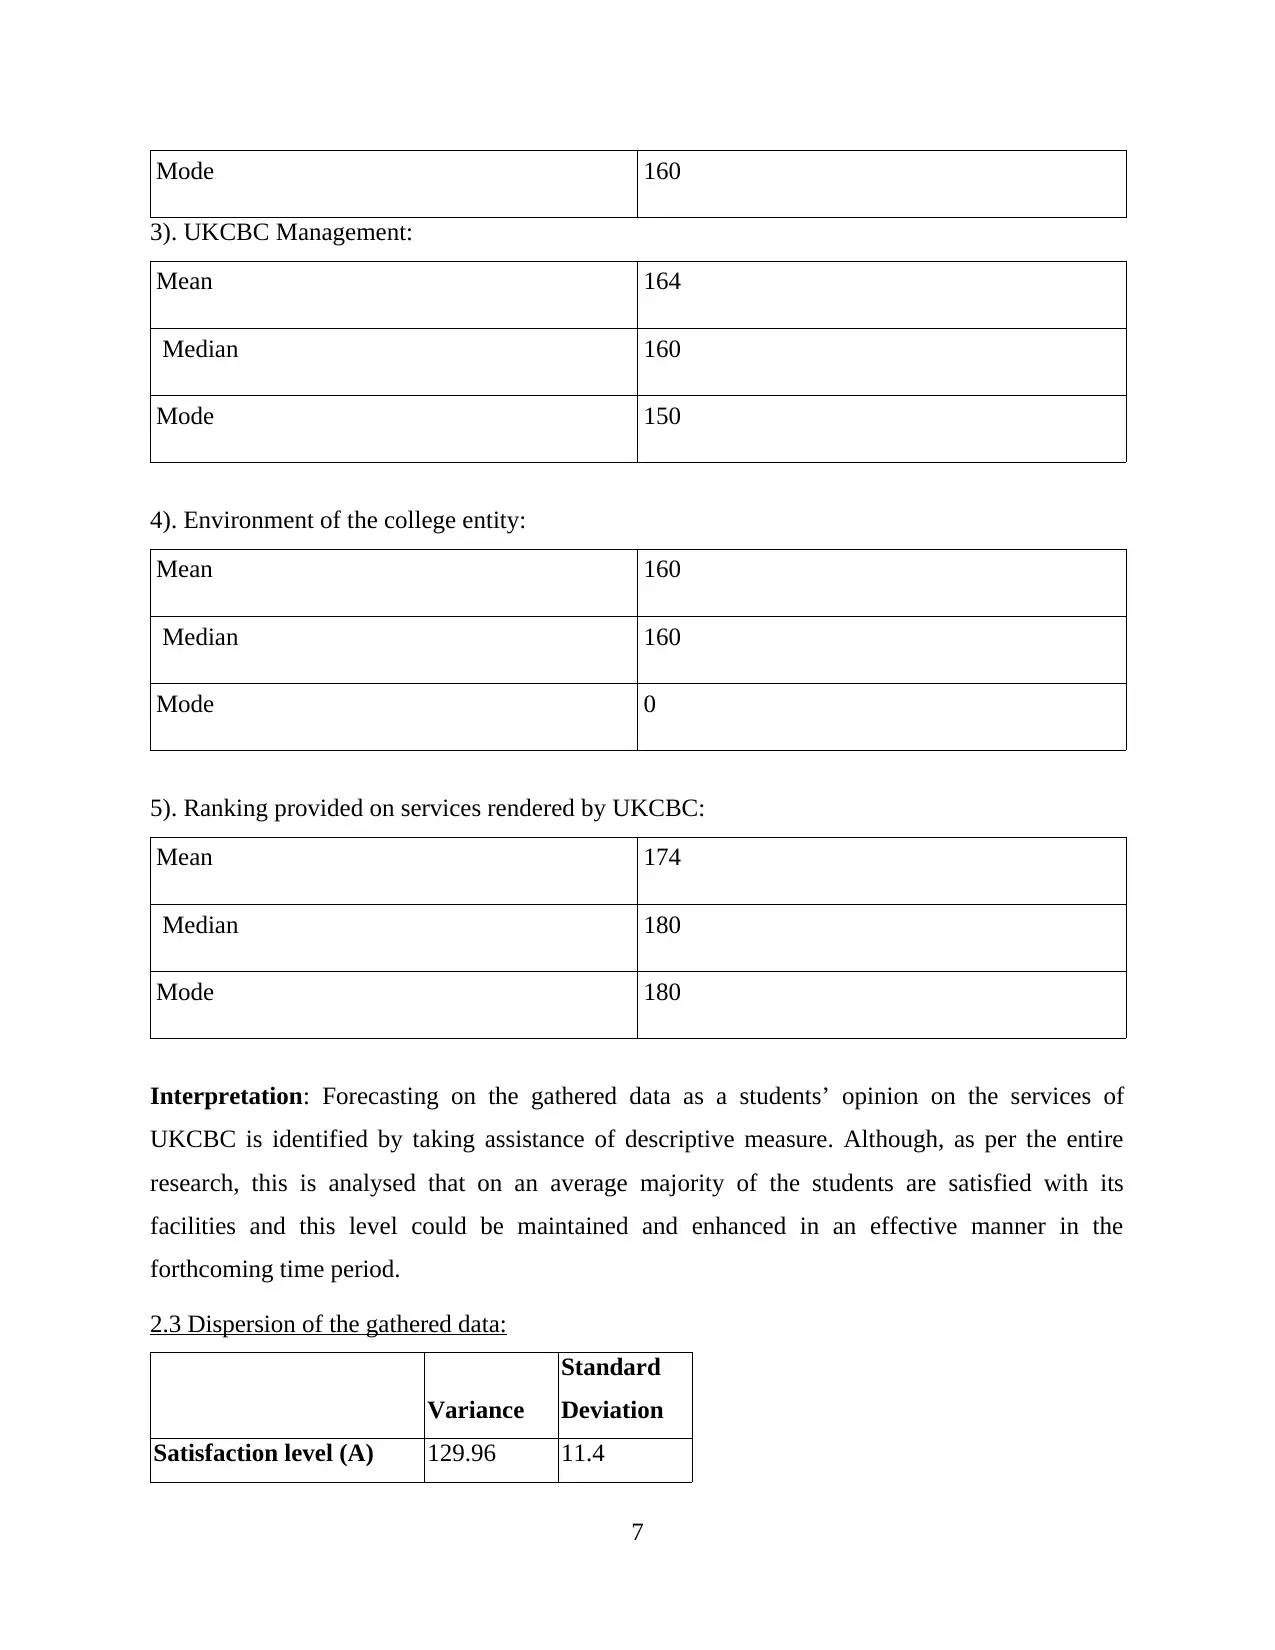
3). UKCBC Management:
Mean 164
Median 160
Mode 150
4). Environment of the college entity:
Mean 160
Median 160
Mode 0
5). Ranking provided on services rendered by UKCBC:
Mean 174
Median 180
Mode 180
Interpretation: Forecasting on the gathered data as a students’ opinion on the services of
UKCBC is identified by taking assistance of descriptive measure. Although, as per the entire
research, this is analysed that on an average majority of the students are satisfied with its
facilities and this level could be maintained and enhanced in an effective manner in the
forthcoming time period.
2.3 Dispersion of the gathered data:
Variance
Standard
Deviation
Satisfaction level (A) 129.96 11.4
7
⊘ This is a preview!⊘
Do you want full access?
Subscribe today to unlock all pages.
Trusted by 1+ million students worldwide
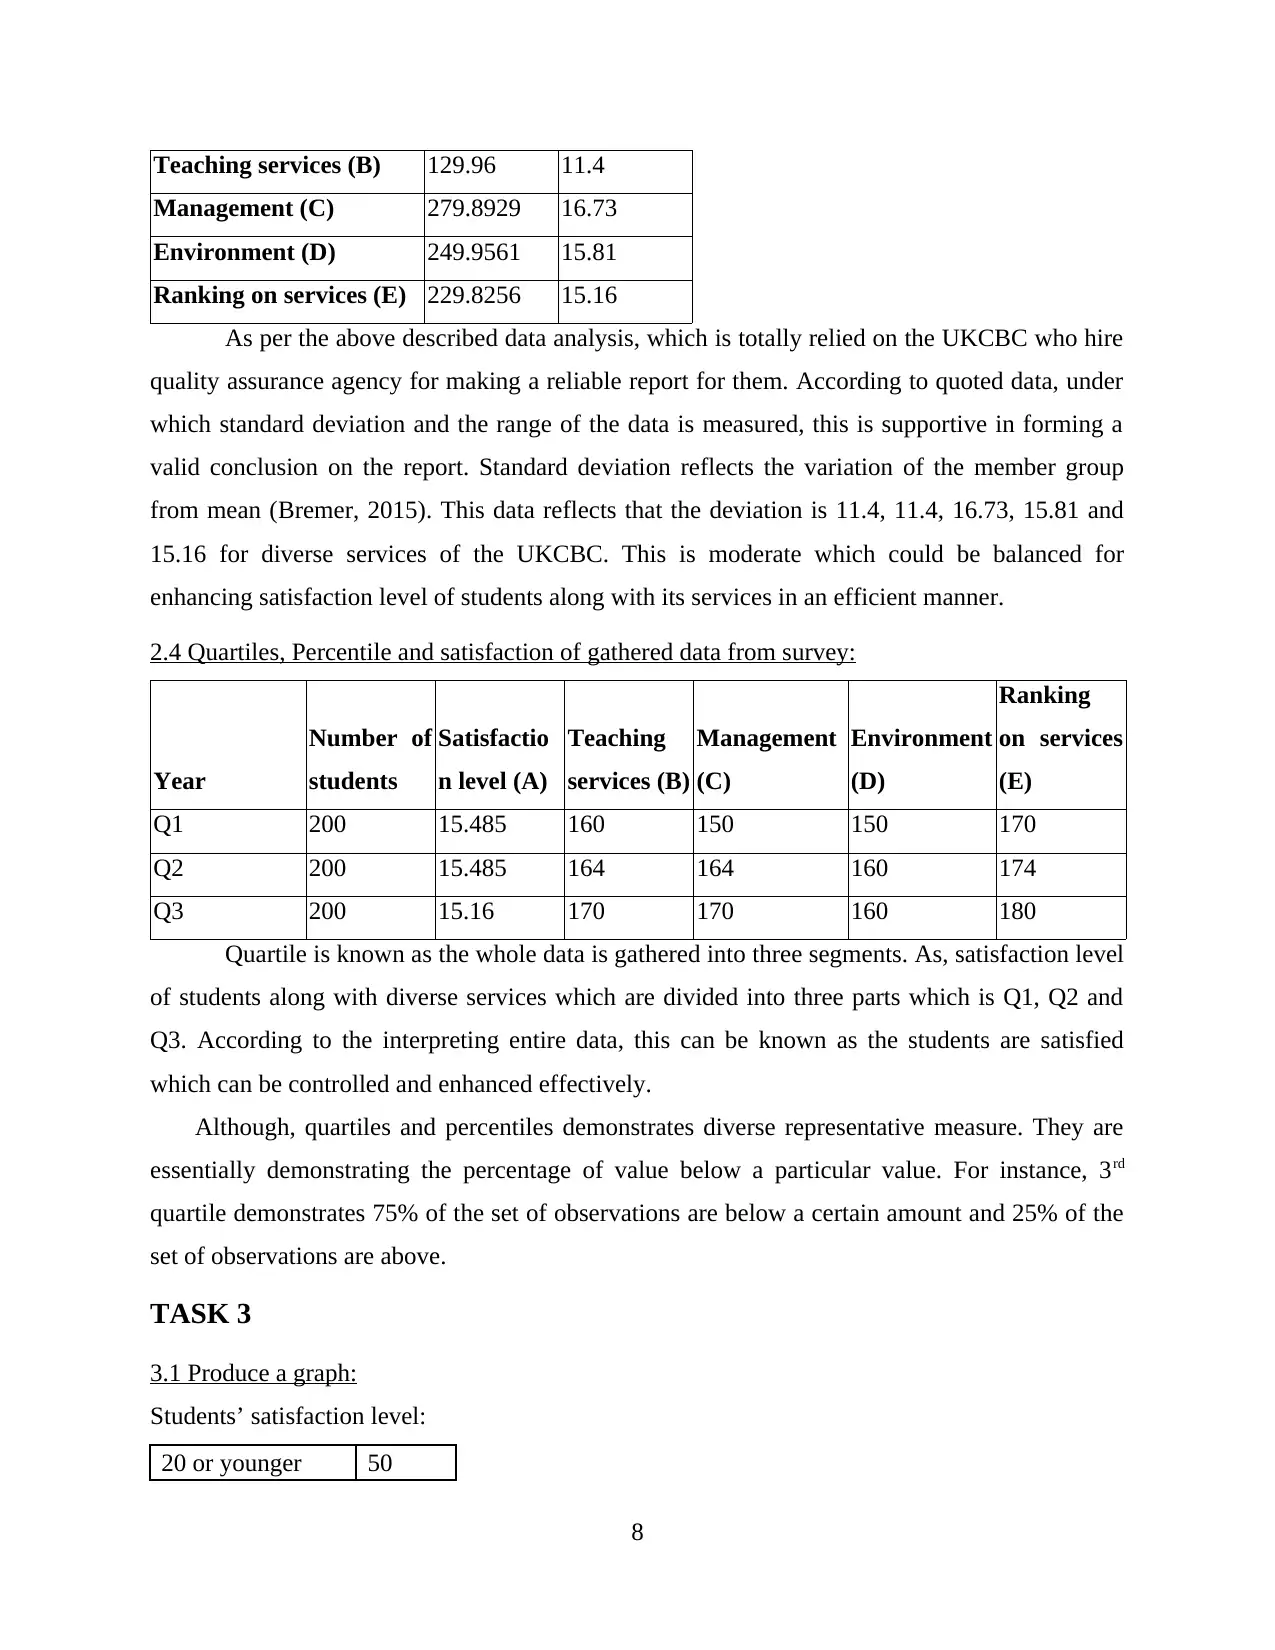
Teaching services (B) 129.96 11.4
Management (C) 279.8929 16.73
Environment (D) 249.9561 15.81
Ranking on services (E) 229.8256 15.16
As per the above described data analysis, which is totally relied on the UKCBC who hire
quality assurance agency for making a reliable report for them. According to quoted data, under
which standard deviation and the range of the data is measured, this is supportive in forming a
valid conclusion on the report. Standard deviation reflects the variation of the member group
from mean (Bremer, 2015). This data reflects that the deviation is 11.4, 11.4, 16.73, 15.81 and
15.16 for diverse services of the UKCBC. This is moderate which could be balanced for
enhancing satisfaction level of students along with its services in an efficient manner.
2.4 Quartiles, Percentile and satisfaction of gathered data from survey:
Year
Number of
students
Satisfactio
n level (A)
Teaching
services (B)
Management
(C)
Environment
(D)
Ranking
on services
(E)
Q1 200 15.485 160 150 150 170
Q2 200 15.485 164 164 160 174
Q3 200 15.16 170 170 160 180
Quartile is known as the whole data is gathered into three segments. As, satisfaction level
of students along with diverse services which are divided into three parts which is Q1, Q2 and
Q3. According to the interpreting entire data, this can be known as the students are satisfied
which can be controlled and enhanced effectively.
Although, quartiles and percentiles demonstrates diverse representative measure. They are
essentially demonstrating the percentage of value below a particular value. For instance, 3rd
quartile demonstrates 75% of the set of observations are below a certain amount and 25% of the
set of observations are above.
TASK 3
3.1 Produce a graph:
Students’ satisfaction level:
20 or younger 50
8
Paraphrase This Document
Need a fresh take? Get an instant paraphrase of this document with our AI Paraphraser
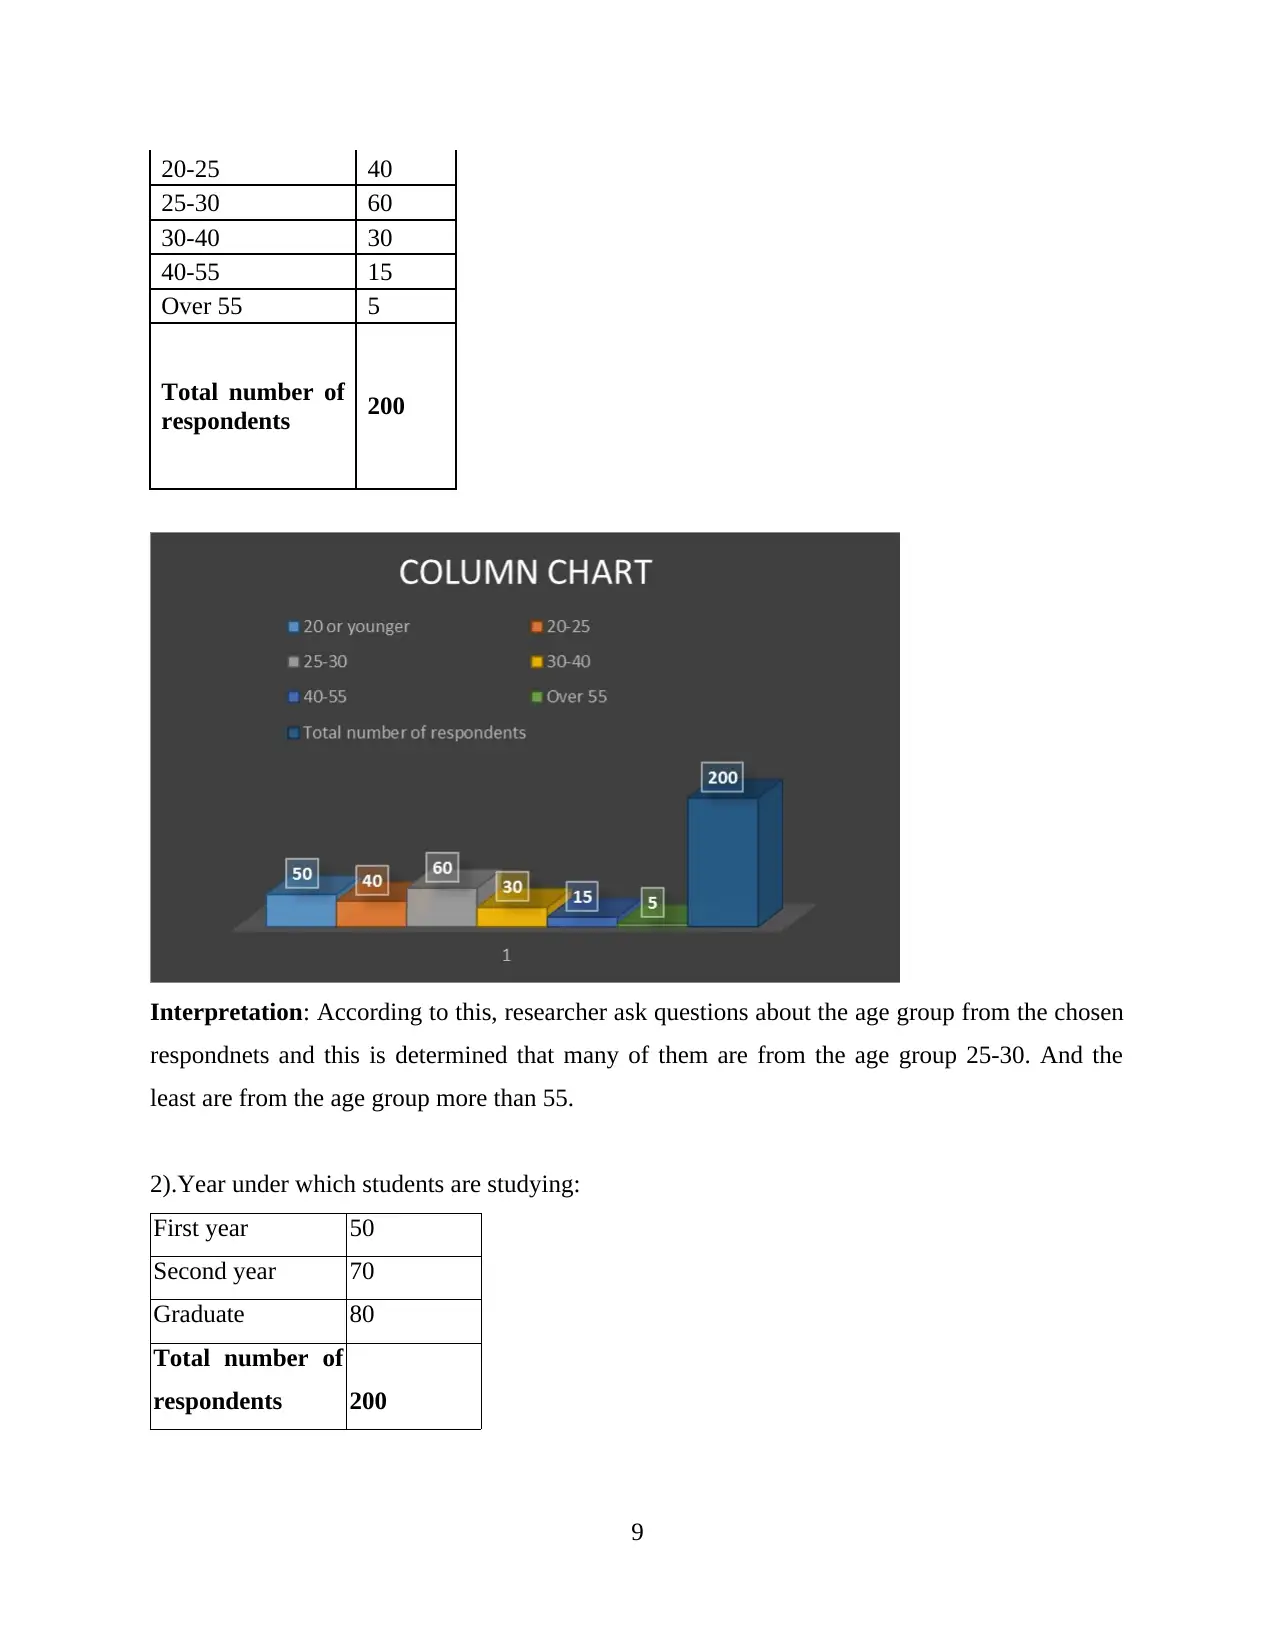
20-25 40
25-30 60
30-40 30
40-55 15
Over 55 5
Total number of
respondents 200
Interpretation: According to this, researcher ask questions about the age group from the chosen
respondnets and this is determined that many of them are from the age group 25-30. And the
least are from the age group more than 55.
2).Year under which students are studying:
First year 50
Second year 70
Graduate 80
Total number of
respondents 200
9
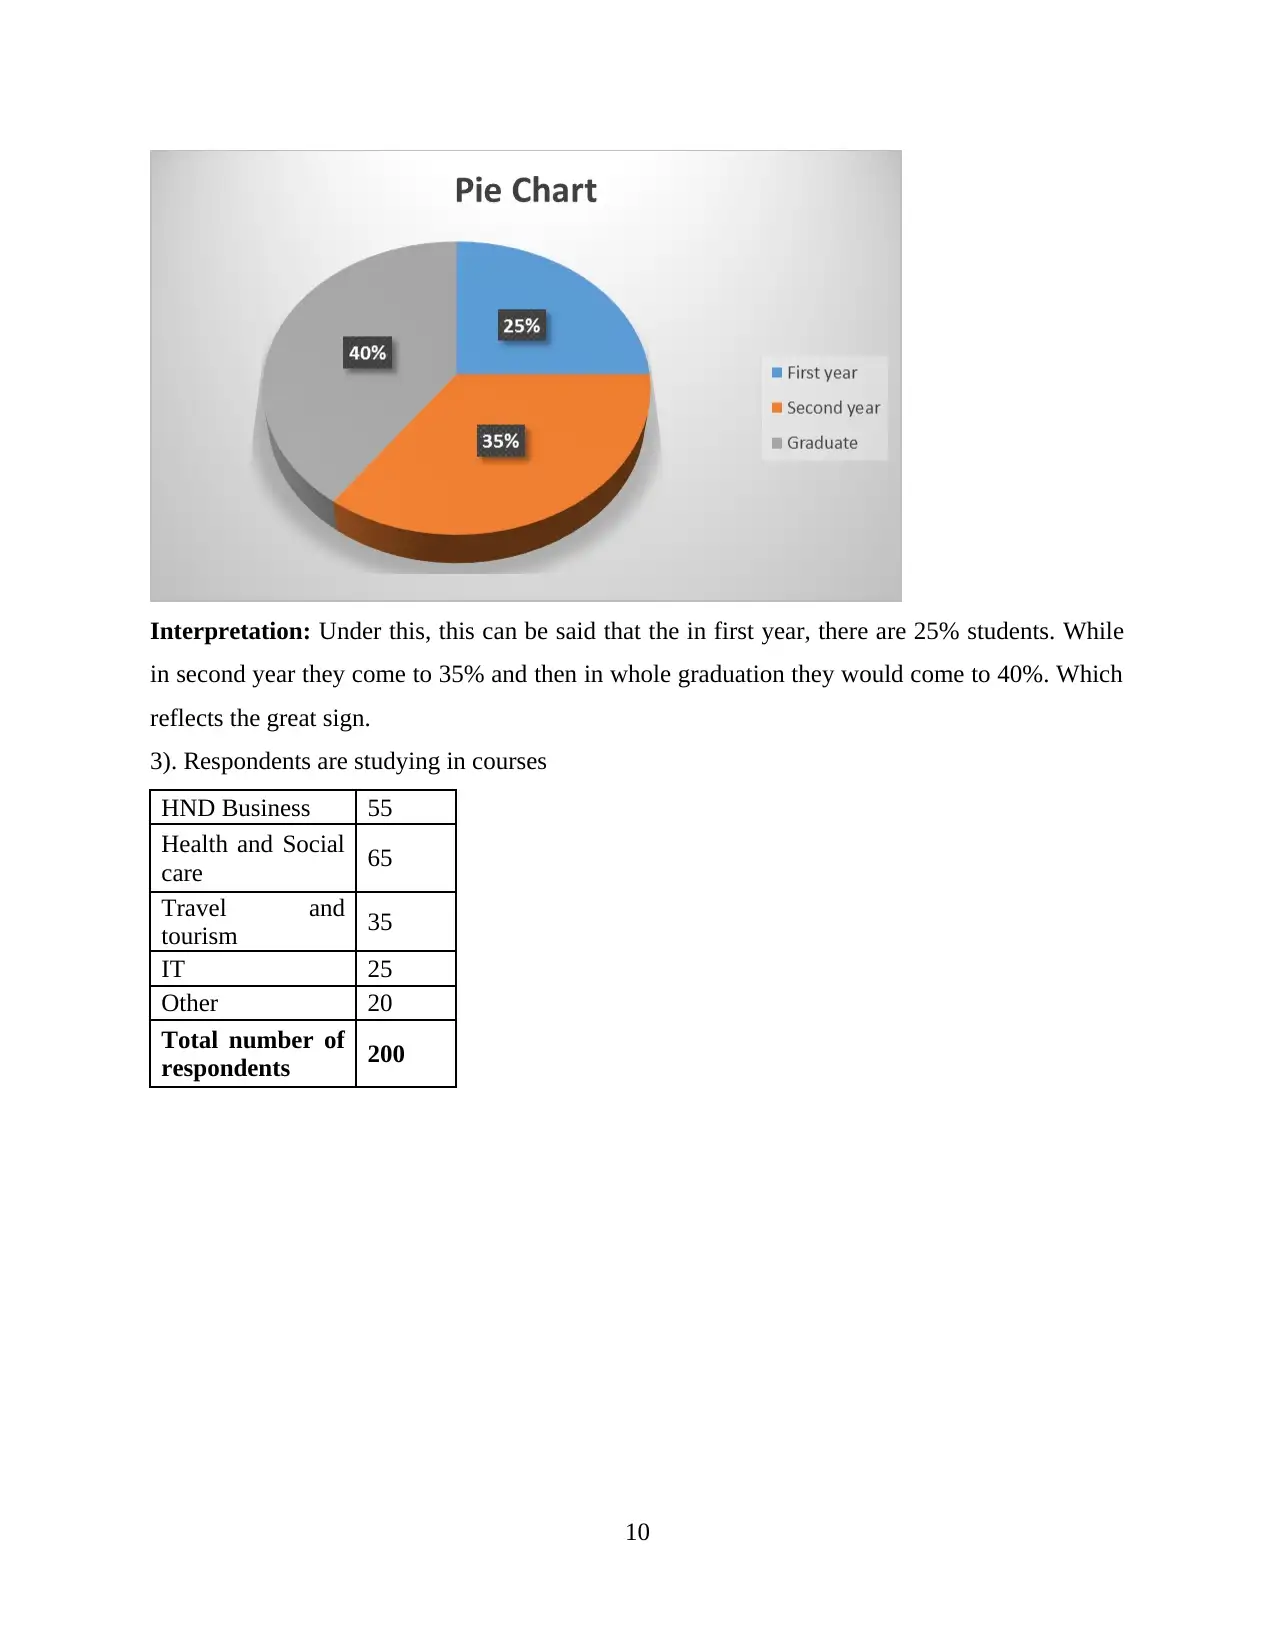
Interpretation: Under this, this can be said that the in first year, there are 25% students. While
in second year they come to 35% and then in whole graduation they would come to 40%. Which
reflects the great sign.
3). Respondents are studying in courses
HND Business 55
Health and Social
care 65
Travel and
tourism 35
IT 25
Other 20
Total number of
respondents 200
10
in second year they come to 35% and then in whole graduation they would come to 40%. Which
reflects the great sign.
3). Respondents are studying in courses
HND Business 55
Health and Social
care 65
Travel and
tourism 35
IT 25
Other 20
Total number of
respondents 200
10
⊘ This is a preview!⊘
Do you want full access?
Subscribe today to unlock all pages.
Trusted by 1+ million students worldwide
1 out of 21
Related Documents


Your All-in-One AI-Powered Toolkit for Academic Success.
+13062052269
info@desklib.com
Available 24*7 on WhatsApp / Email
![[object Object]](/_next/static/media/star-bottom.7253800d.svg)
Unlock your academic potential
Copyright © 2020–2026 A2Z Services. All Rights Reserved. Developed and managed by ZUCOL.