Business Decision Making Report
VerifiedAdded on 2020/02/12
|29
|4527
|119
Report
AI Summary
This report analyzes the business decision-making process for Black Friars Restaurant, focusing on data collection, analysis, and financial tools to support the establishment of a new outlet in London. It includes methodologies for primary and secondary data collection, statistical analysis, and recommendations based on financial evaluations. The report aims to provide insights into customer preferences and operational strategies to enhance business performance.
BUSINESS DECISION
MAKING
MAKING
Paraphrase This Document
Need a fresh take? Get an instant paraphrase of this document with our AI Paraphraser
Table of Contents
INTRODUCTION...........................................................................................................................1
TASK 1............................................................................................................................................1
1.1 Collection of primary and secondary data for given business problem................................1
1.2 Survey methodology and sampling frame.............................................................................2
1.3 Questionnaire to collect and provide justification................................................................2
TASK 2............................................................................................................................................4
2.1 Information for decision-making with collecting data and summarising.............................4
2.2 Calculation of mean, median and mode with description.....................................................5
2.3 Analysis of collected data.....................................................................................................6
2.4 Calculation of quartile, percentile and correlation coefficient..............................................6
TASK 3............................................................................................................................................7
3.1 Effectively present the findings ...........................................................................................7
3.2 Create trend analysis to forecasting....................................................................................10
3.3 Business presentation .........................................................................................................11
3.4 Formal business report........................................................................................................11
TASK 4..........................................................................................................................................12
4.1 and 4.2 Prepare project plan and determines activities such as right location and lay out of
restaurant...................................................................................................................................12
4.3 Financial tool for decision-making.....................................................................................14
CONCLUSION..............................................................................................................................16
REFERENCES..............................................................................................................................17
INTRODUCTION
In order to accomplish desire results, every business take decisions that is the crucial
element that defines as the selection of the best option from various alternatives. In this aspect,
goals and targets has been achieved to make choice with conduct management functions of
decisions (Crane and Matten, 2016). For analysis the present report, Black friars Restaurant
which is located in London and plan for establish new venture in that area. For gaining insight
knowledge of the company, report covers plan for collect primary and secondary sources for
assess the business problem. Furthermore, it includes calculation of mean, median and mode
which assist to analysis useful and realistic conclusion. Moreover, it creates trend analysis graph
that helpful to forecasting business with specified information. At last, financial tools are used
that assist to describe decision-making with calculating cash flow and NPV for
recommendations.
TASK 1
1.1 Collection of primary and secondary data for given business problem
Data collection is an important element which preparing plan for research. Systematic
gathering of data assist to complete purpose from various elements which organise in effective
aspect such as observed, recording and so on. In respect to assess the business problem, there are
two types of data can be gathered such as primary and secondary (Karmarkar, Shiv and Knutson,
2015).
Primary data: Primary data is collecting through control and supervision of an investigator.
These are original data that has been collected first time for specific problem and purpose. For
example questionnaire. These data collected through various resources such as survey,
experiments and simulation, etc. (Bera, 2016).
⊘ This is a preview!⊘
Do you want full access?
Subscribe today to unlock all pages.
Trusted by 1+ million students worldwide
Secondary data: Data gathered and recorded that are collected previously for someone else
issues or purposes. With the help of secondary data, researcher can make their findings and
analysis on less time, cost and efforts, etc. These type of data can also reused for another purpose
and issue in different aspect. For example data collection from a book. Through internal and
external sources, secondary data can be collected from different areas (Beersma, Greer and De
Dreu, 2016).
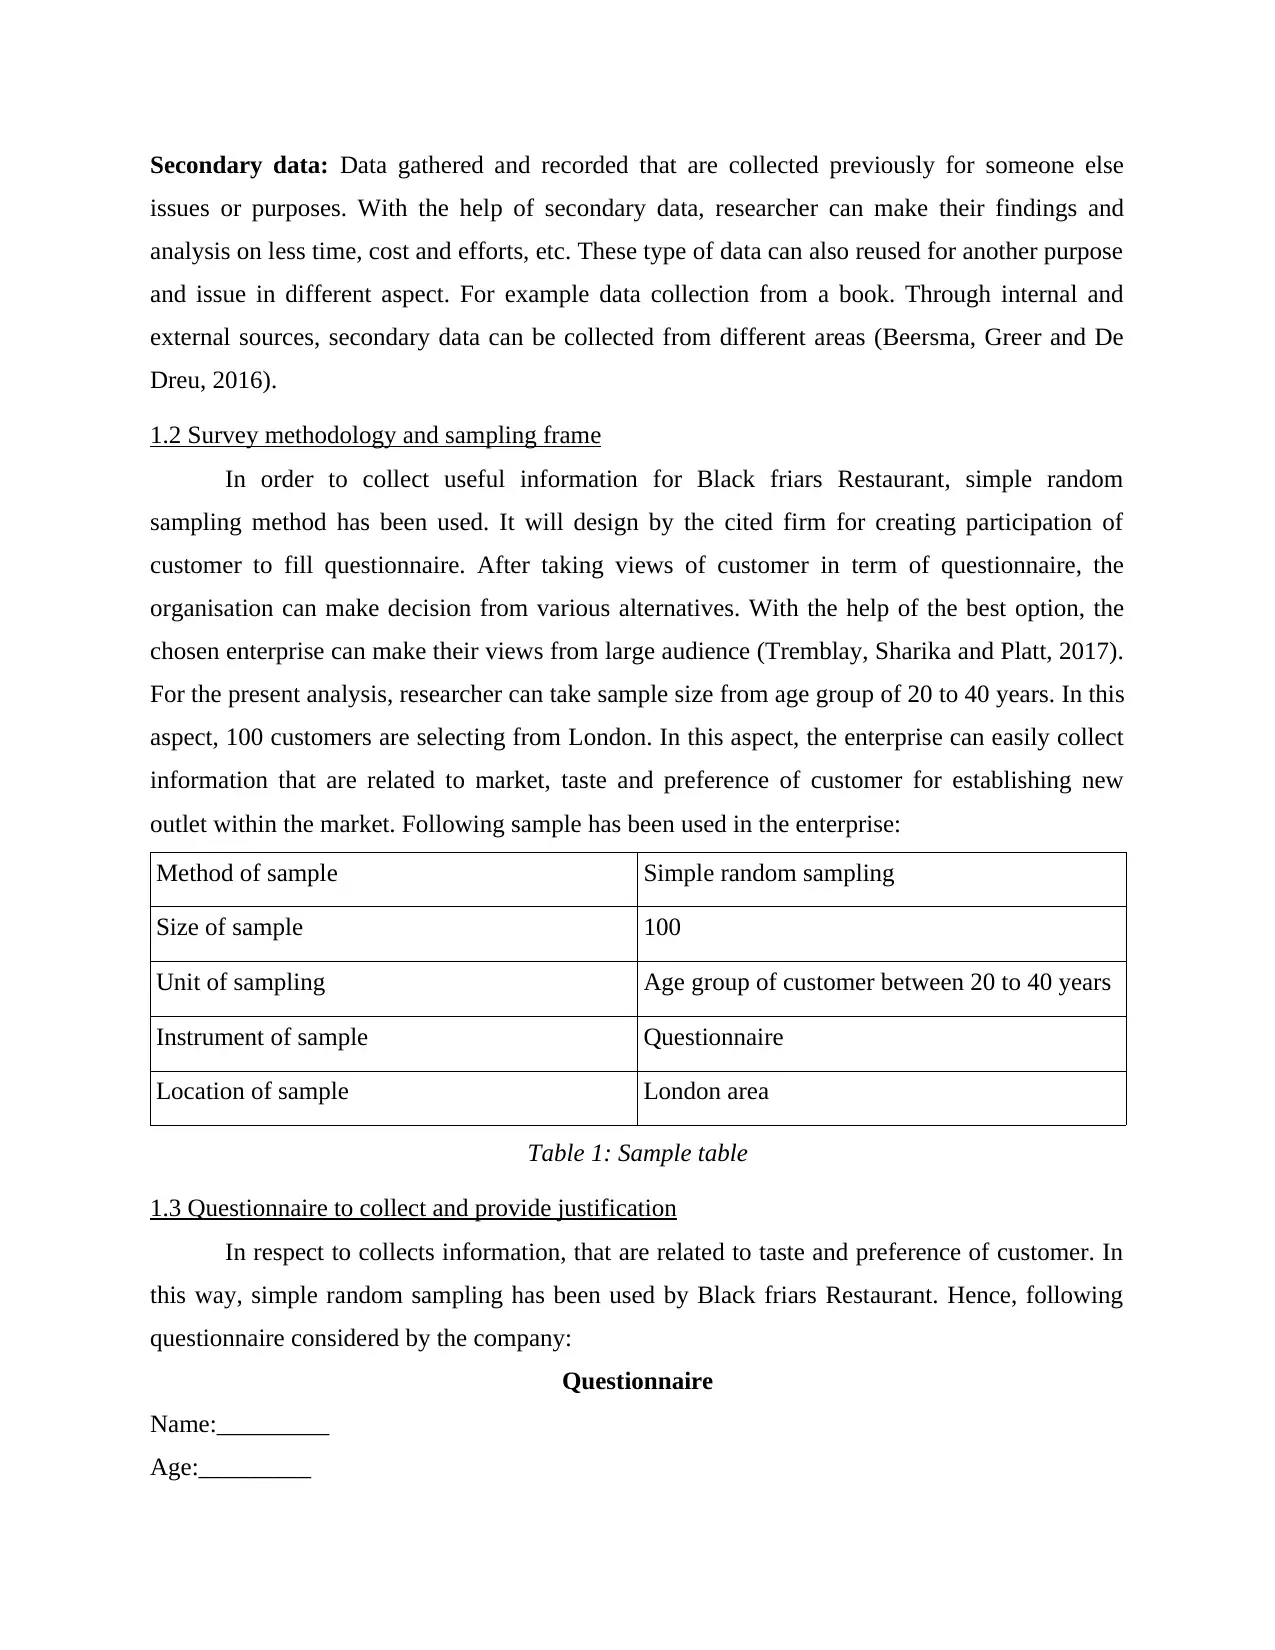
1.2 Survey methodology and sampling frame
In order to collect useful information for Black friars Restaurant, simple random
sampling method has been used. It will design by the cited firm for creating participation of
customer to fill questionnaire. After taking views of customer in term of questionnaire, the
organisation can make decision from various alternatives. With the help of the best option, the
chosen enterprise can make their views from large audience (Tremblay, Sharika and Platt, 2017).
For the present analysis, researcher can take sample size from age group of 20 to 40 years. In this
aspect, 100 customers are selecting from London. In this aspect, the enterprise can easily collect
information that are related to market, taste and preference of customer for establishing new
outlet within the market. Following sample has been used in the enterprise:
Method of sample Simple random sampling
Size of sample 100
Unit of sampling Age group of customer between 20 to 40 years
Instrument of sample Questionnaire
Location of sample London area
Table 1: Sample table
1.3 Questionnaire to collect and provide justification
In respect to collects information, that are related to taste and preference of customer. In
this way, simple random sampling has been used by Black friars Restaurant. Hence, following
questionnaire considered by the company:
Questionnaire
Name:_________
Age:_________
issues or purposes. With the help of secondary data, researcher can make their findings and
analysis on less time, cost and efforts, etc. These type of data can also reused for another purpose
and issue in different aspect. For example data collection from a book. Through internal and
external sources, secondary data can be collected from different areas (Beersma, Greer and De
Dreu, 2016).
1.2 Survey methodology and sampling frame
In order to collect useful information for Black friars Restaurant, simple random
sampling method has been used. It will design by the cited firm for creating participation of
customer to fill questionnaire. After taking views of customer in term of questionnaire, the
organisation can make decision from various alternatives. With the help of the best option, the
chosen enterprise can make their views from large audience (Tremblay, Sharika and Platt, 2017).
For the present analysis, researcher can take sample size from age group of 20 to 40 years. In this
aspect, 100 customers are selecting from London. In this aspect, the enterprise can easily collect
information that are related to market, taste and preference of customer for establishing new
outlet within the market. Following sample has been used in the enterprise:
Method of sample Simple random sampling
Size of sample 100
Unit of sampling Age group of customer between 20 to 40 years
Instrument of sample Questionnaire
Location of sample London area
Table 1: Sample table
1.3 Questionnaire to collect and provide justification
In respect to collects information, that are related to taste and preference of customer. In
this way, simple random sampling has been used by Black friars Restaurant. Hence, following
questionnaire considered by the company:
Questionnaire
Name:_________
Age:_________
Paraphrase This Document
Need a fresh take? Get an instant paraphrase of this document with our AI Paraphraser
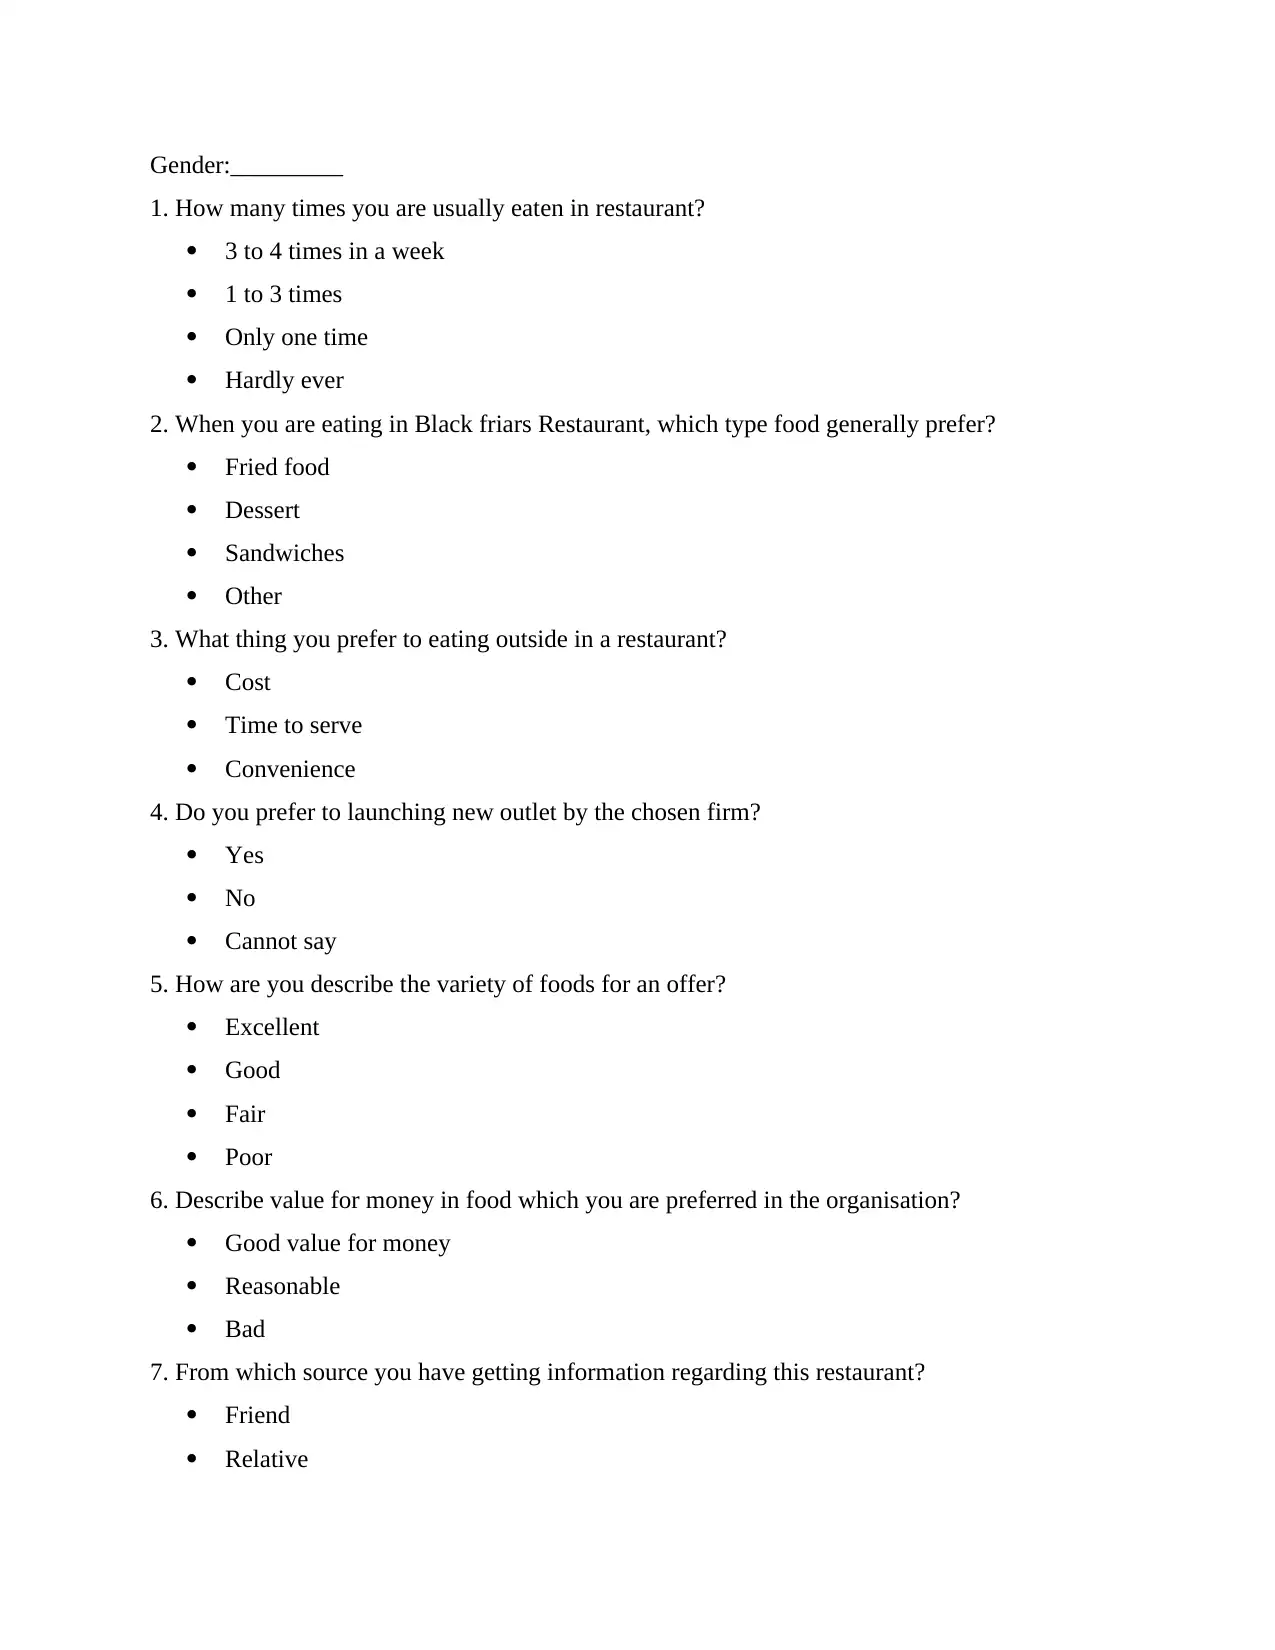
Gender:_________
1. How many times you are usually eaten in restaurant?
3 to 4 times in a week
1 to 3 times
Only one time
Hardly ever
2. When you are eating in Black friars Restaurant, which type food generally prefer?
Fried food
Dessert
Sandwiches
Other
3. What thing you prefer to eating outside in a restaurant?
Cost
Time to serve
Convenience
4. Do you prefer to launching new outlet by the chosen firm?
Yes
No
Cannot say
5. How are you describe the variety of foods for an offer?
Excellent
Good
Fair
Poor
6. Describe value for money in food which you are preferred in the organisation?
Good value for money
Reasonable
Bad
7. From which source you have getting information regarding this restaurant?
Friend
Relative
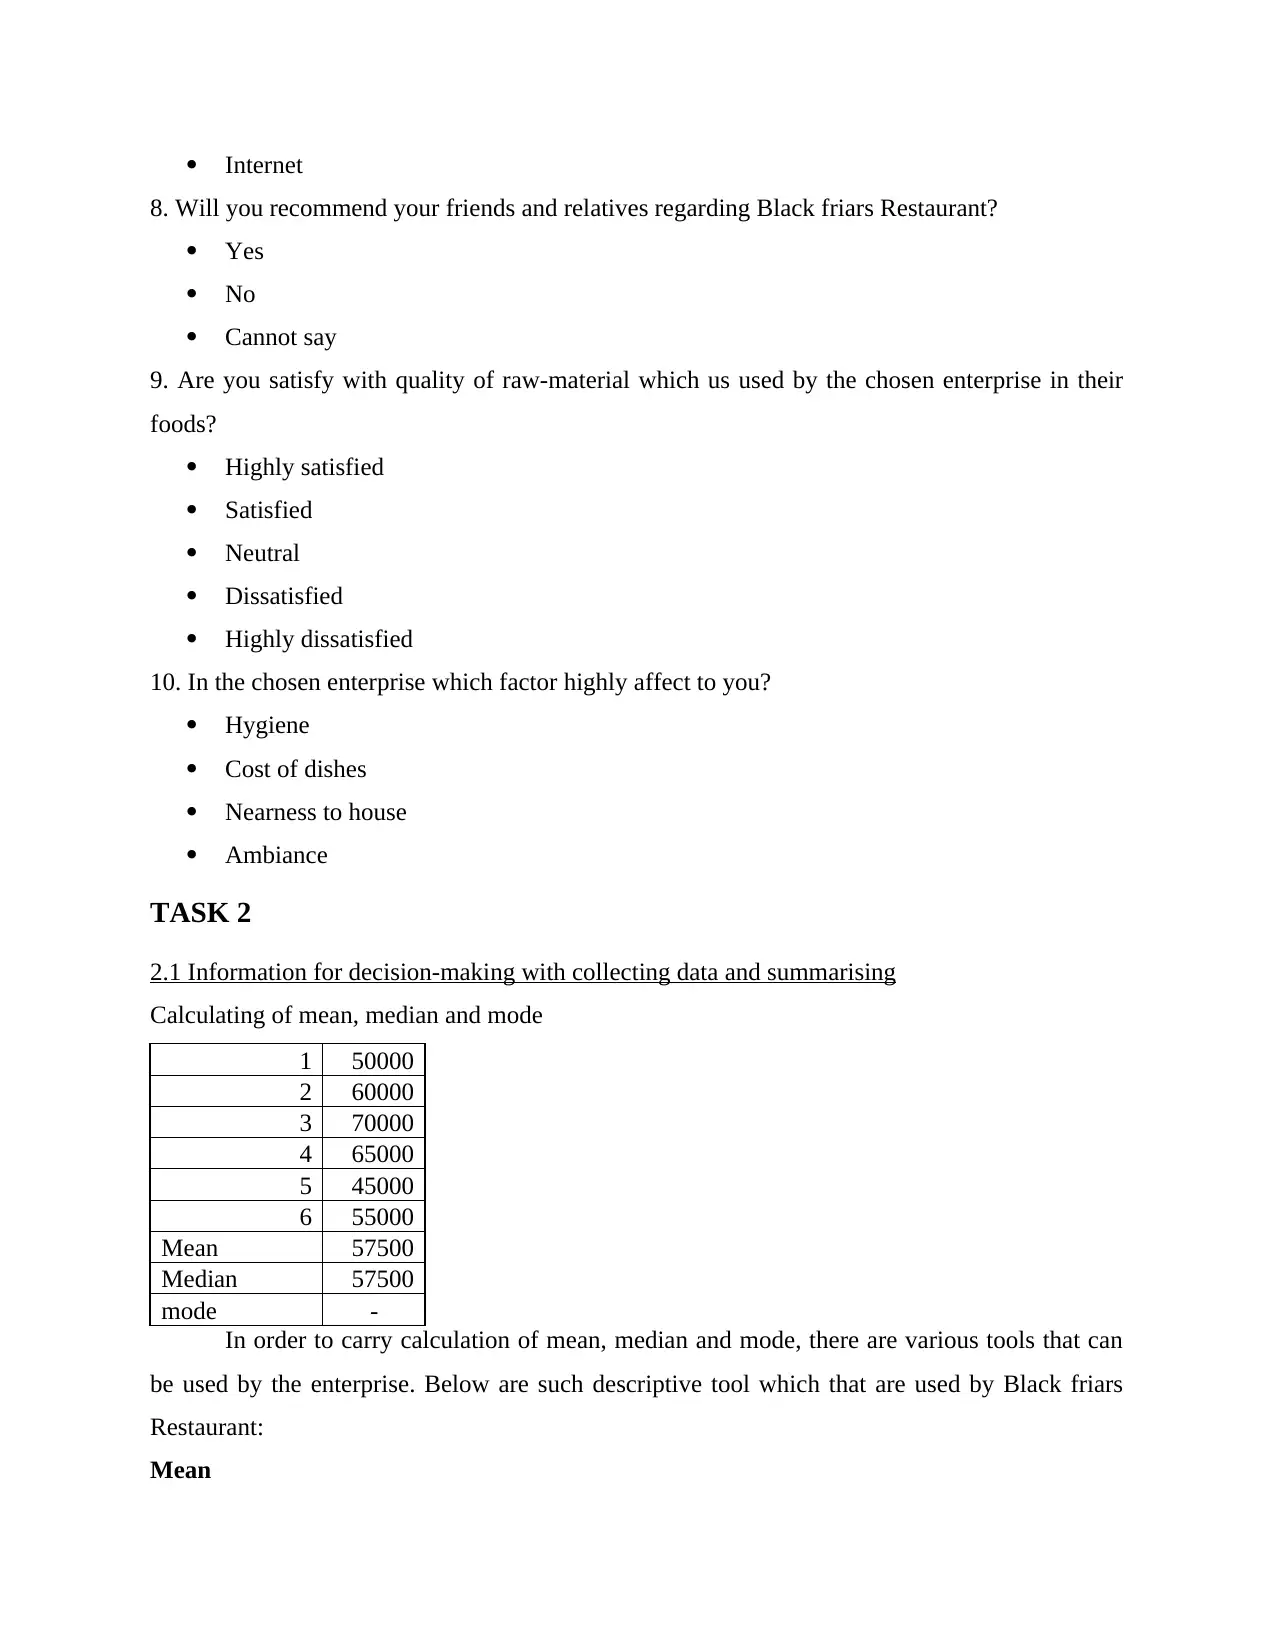
Internet
8. Will you recommend your friends and relatives regarding Black friars Restaurant?
Yes
No
Cannot say
9. Are you satisfy with quality of raw-material which us used by the chosen enterprise in their
foods?
Highly satisfied
Satisfied
Neutral
Dissatisfied
Highly dissatisfied
10. In the chosen enterprise which factor highly affect to you?
Hygiene
Cost of dishes
Nearness to house
Ambiance
TASK 2
2.1 Information for decision-making with collecting data and summarising
Calculating of mean, median and mode
1 50000
2 60000
3 70000
4 65000
5 45000
6 55000
Mean 57500
Median 57500
mode -
In order to carry calculation of mean, median and mode, there are various tools that can
be used by the enterprise. Below are such descriptive tool which that are used by Black friars
Restaurant:
Mean
⊘ This is a preview!⊘
Do you want full access?
Subscribe today to unlock all pages.
Trusted by 1+ million students worldwide
This is important tool which demonstrate every data in scientific way that analysis by
researcher. When manager of Black friars Restaurant is trying to solve their business issue, it can
be applied in systematic way. Hence, advance method has been used that can be describes
through series analysis and regression that are used by the researcher (De Hauw and Greenhaus,
2015). It will assist to analysis relationship in different variables within the business
environment. With the help of mean, researcher can easily calculate different descriptive
elements in scientific aspect. After determining application of tool, the enterprise will easily
make profitability that assist to enhance performances.
Median
In addition to calculating mean, median is another very essential element that is used to
assess descriptive research. It is describing the facts that are related to enterprise and their
functions (Guerrero-Baena, Gómez-Limón and Fruet Cardozo, 2014). Therefore, trend analysis
not easily describes single view of the data which is important to classify in different activities
set. With the help of trend analysis, huge set of figures understand in effective aspect.
Mode
Mode is determining the value that is helpful to assess more specific outcomes and results
with different resources. Hence, the organisation can analysis their performances for undertake
results and positive aspects with repeating values. In a value series, trends are specifically
conducted through mode (Chen, Lee and Paulraj, 2014).
2.2 Calculation of mean, median and mode with description
Following results has been made with different tools of descriptive analysis:
Mean
In Black friars Restaurant, mean is analysis as 57500 that describes average sales of the
organisation. Hence, it could be stated that average sales of the company is describes with
specific time period. Recent sales of the enterprise is 55000 that can be reflect to volume of the
business with its current position. From the above analysis, it has been detected that current
position of the company is not effective which generate adverse impact on performances (Liao,
Xu and Zeng, 2014). It not makes positive and effective picture of the enterprise in front of
customer. Hence, the company is fails to ascertain average sales that reflect to it.
Median
Paraphrase This Document
Need a fresh take? Get an instant paraphrase of this document with our AI Paraphraser
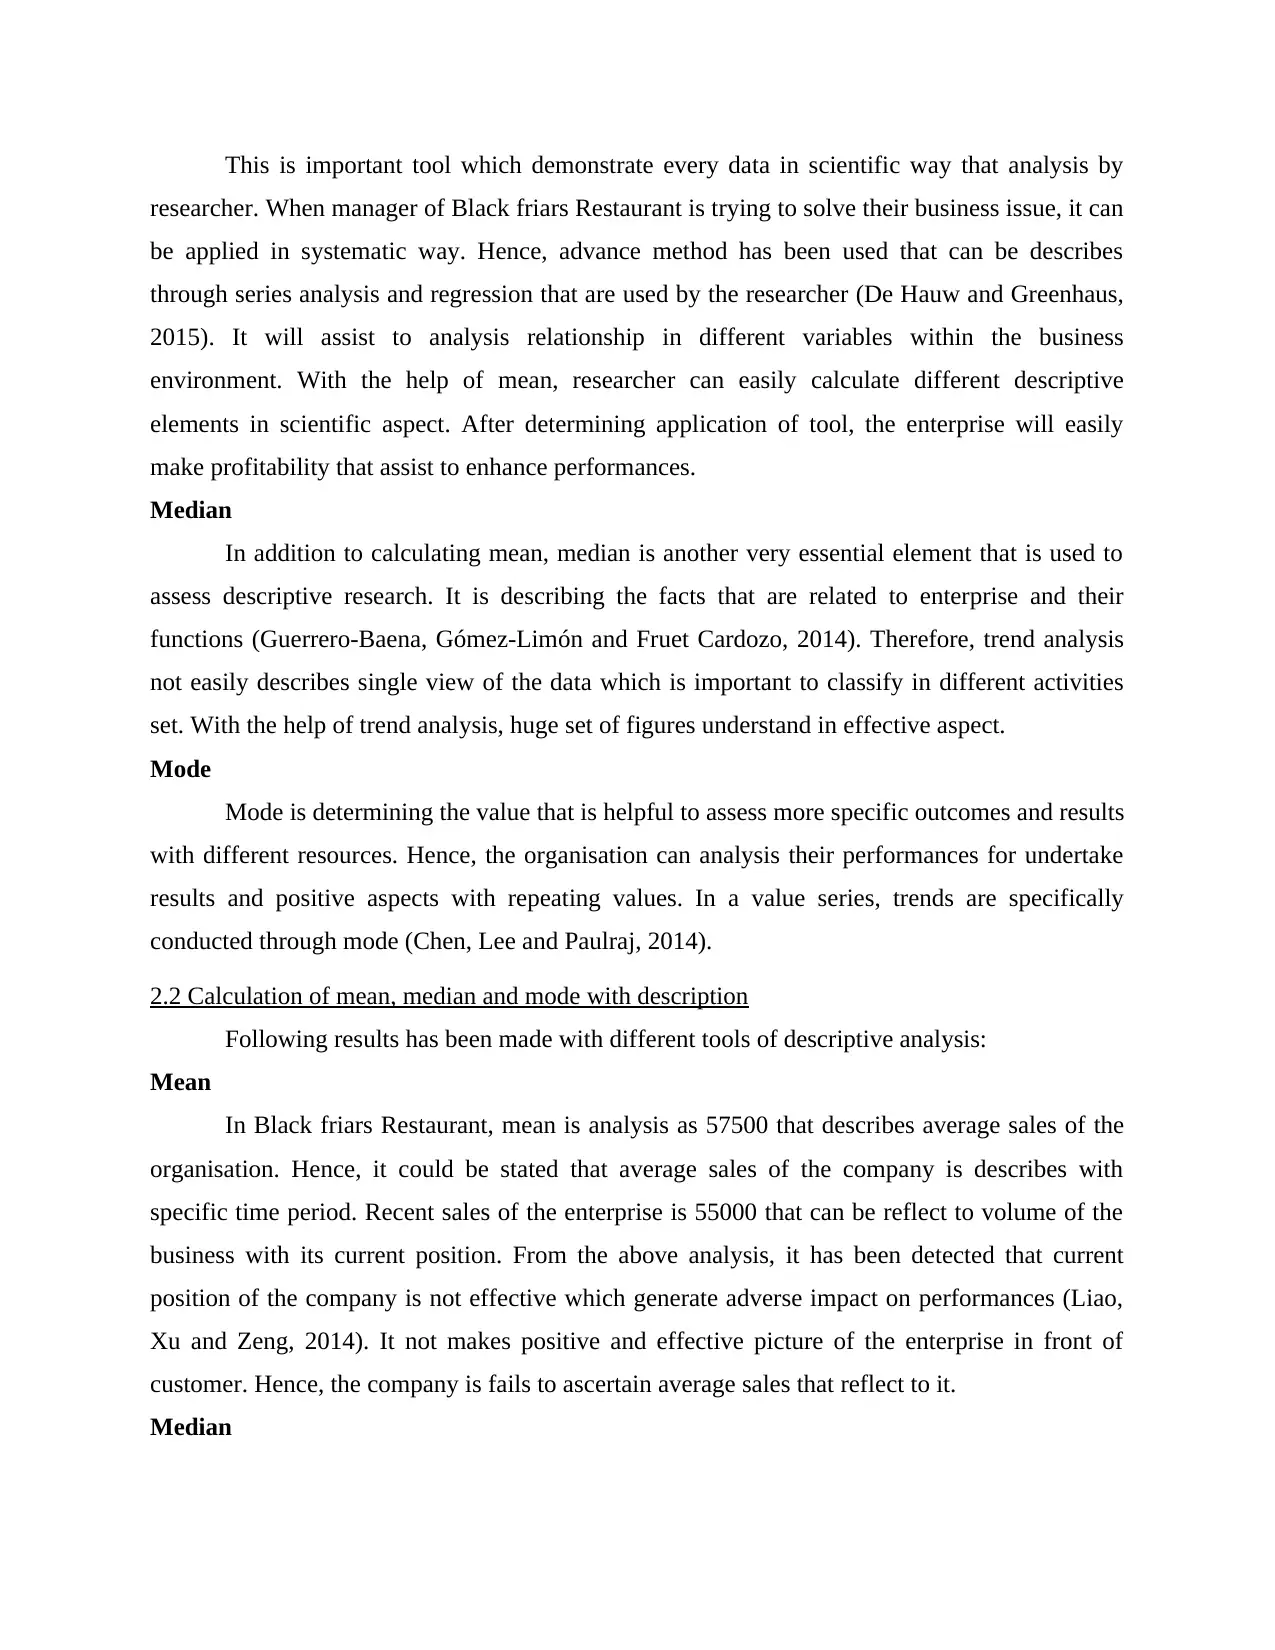
Median is 57500 that is determining entire set of figure in various part of the enterprise.
Hence, it has been analysis that sales of the enterprise enhance their products rates which reduce
performances. In addition to this, it makes crucial picture of Black friars Restaurant that create
impact on its operations. Hence, the cited firm need to increase their performances for making
positive outcomes (Gumus, Egilmez and Park, 2016).
Percentage of changes in sales
Mode
In this type of analysis, it has been measure that data has not been valued in mode
perspective. Hence, it could be stated that vales in data set occurring in various terms. Due to
this, value of mode is not take place (Van Knippenberg, Dahlander and George, 2015).
2.3 Analysis of collected data
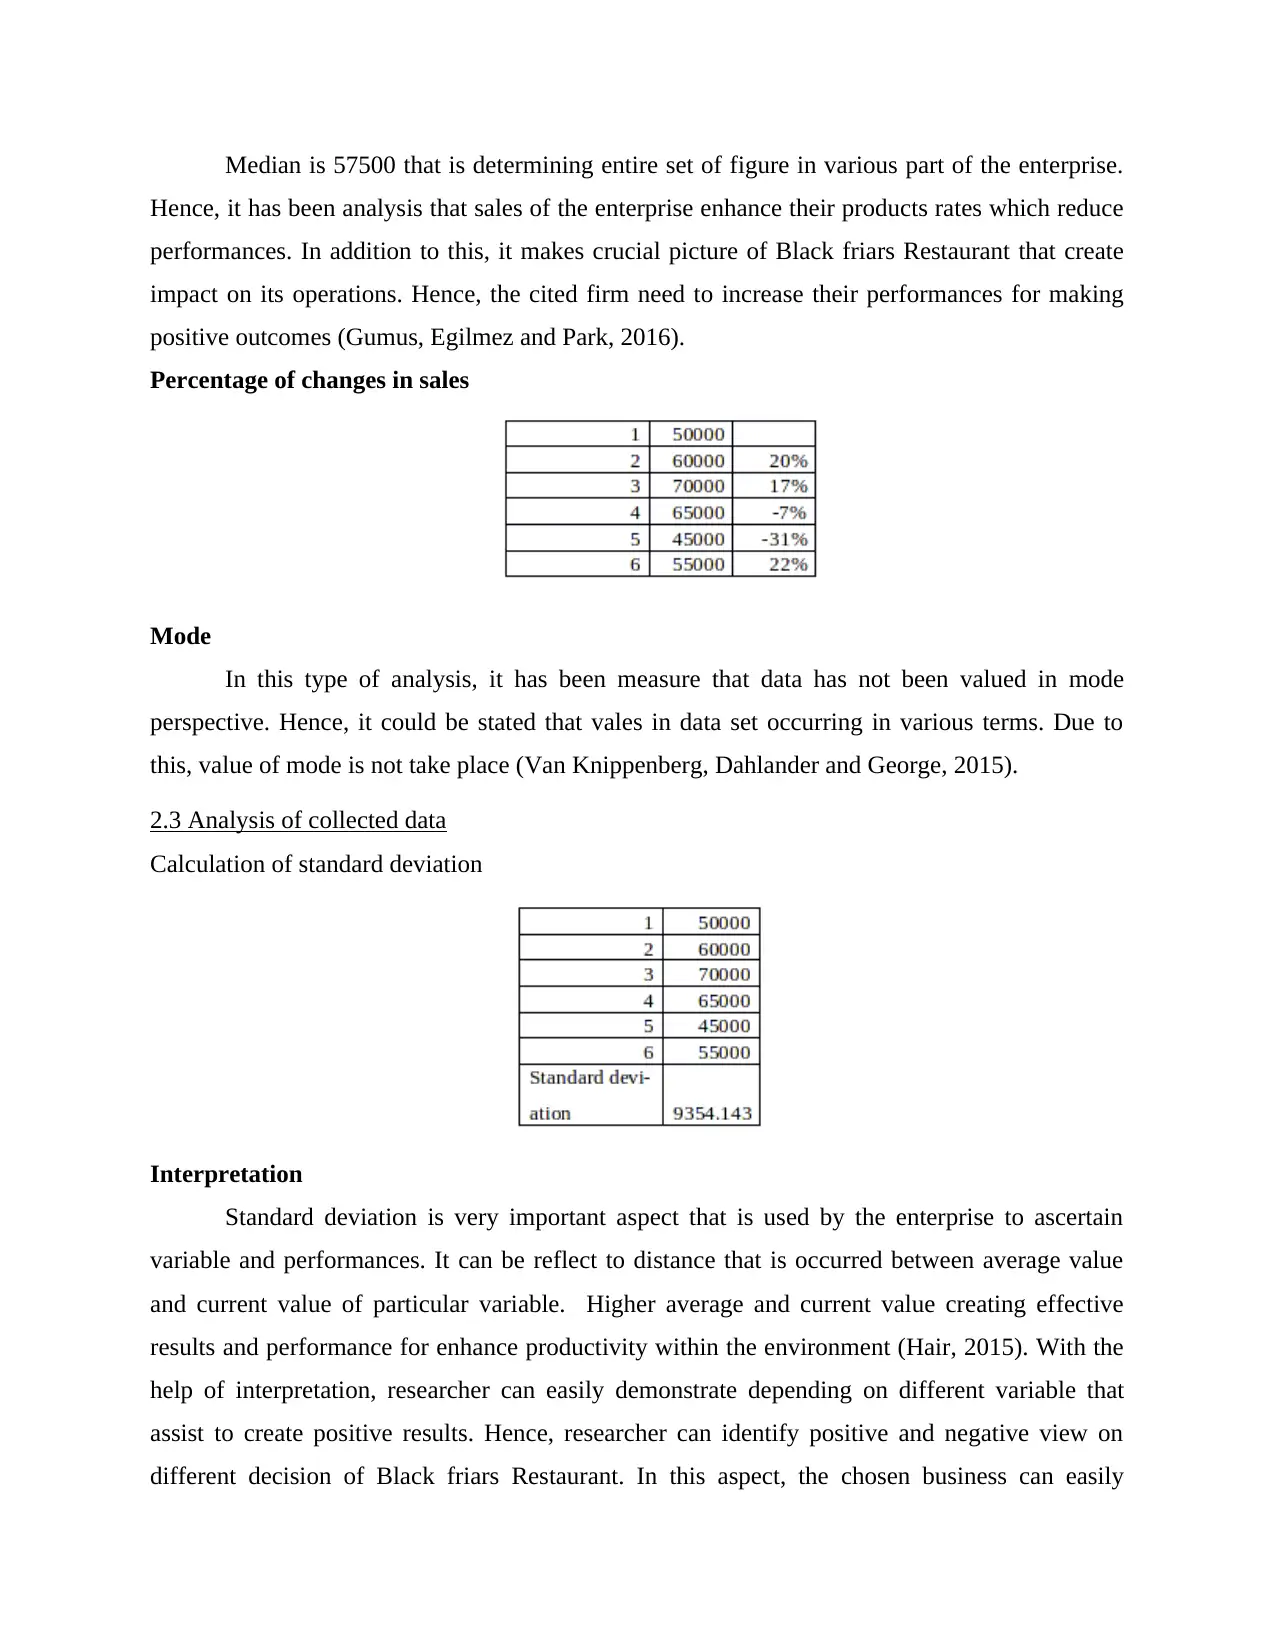
Calculation of standard deviation
Interpretation
Standard deviation is very important aspect that is used by the enterprise to ascertain
variable and performances. It can be reflect to distance that is occurred between average value
and current value of particular variable. Higher average and current value creating effective
results and performance for enhance productivity within the environment (Hair, 2015). With the
help of interpretation, researcher can easily demonstrate depending on different variable that
assist to create positive results. Hence, researcher can identify positive and negative view on
different decision of Black friars Restaurant. In this aspect, the chosen business can easily
Hence, it has been analysis that sales of the enterprise enhance their products rates which reduce
performances. In addition to this, it makes crucial picture of Black friars Restaurant that create
impact on its operations. Hence, the cited firm need to increase their performances for making
positive outcomes (Gumus, Egilmez and Park, 2016).
Percentage of changes in sales
Mode
In this type of analysis, it has been measure that data has not been valued in mode
perspective. Hence, it could be stated that vales in data set occurring in various terms. Due to
this, value of mode is not take place (Van Knippenberg, Dahlander and George, 2015).
2.3 Analysis of collected data
Calculation of standard deviation
Interpretation
Standard deviation is very important aspect that is used by the enterprise to ascertain
variable and performances. It can be reflect to distance that is occurred between average value
and current value of particular variable. Higher average and current value creating effective
results and performance for enhance productivity within the environment (Hair, 2015). With the
help of interpretation, researcher can easily demonstrate depending on different variable that
assist to create positive results. Hence, researcher can identify positive and negative view on
different decision of Black friars Restaurant. In this aspect, the chosen business can easily
describe average value. It describes good and bad thing for develop outcomes that is related to
performances and fluctuation of the business resources.
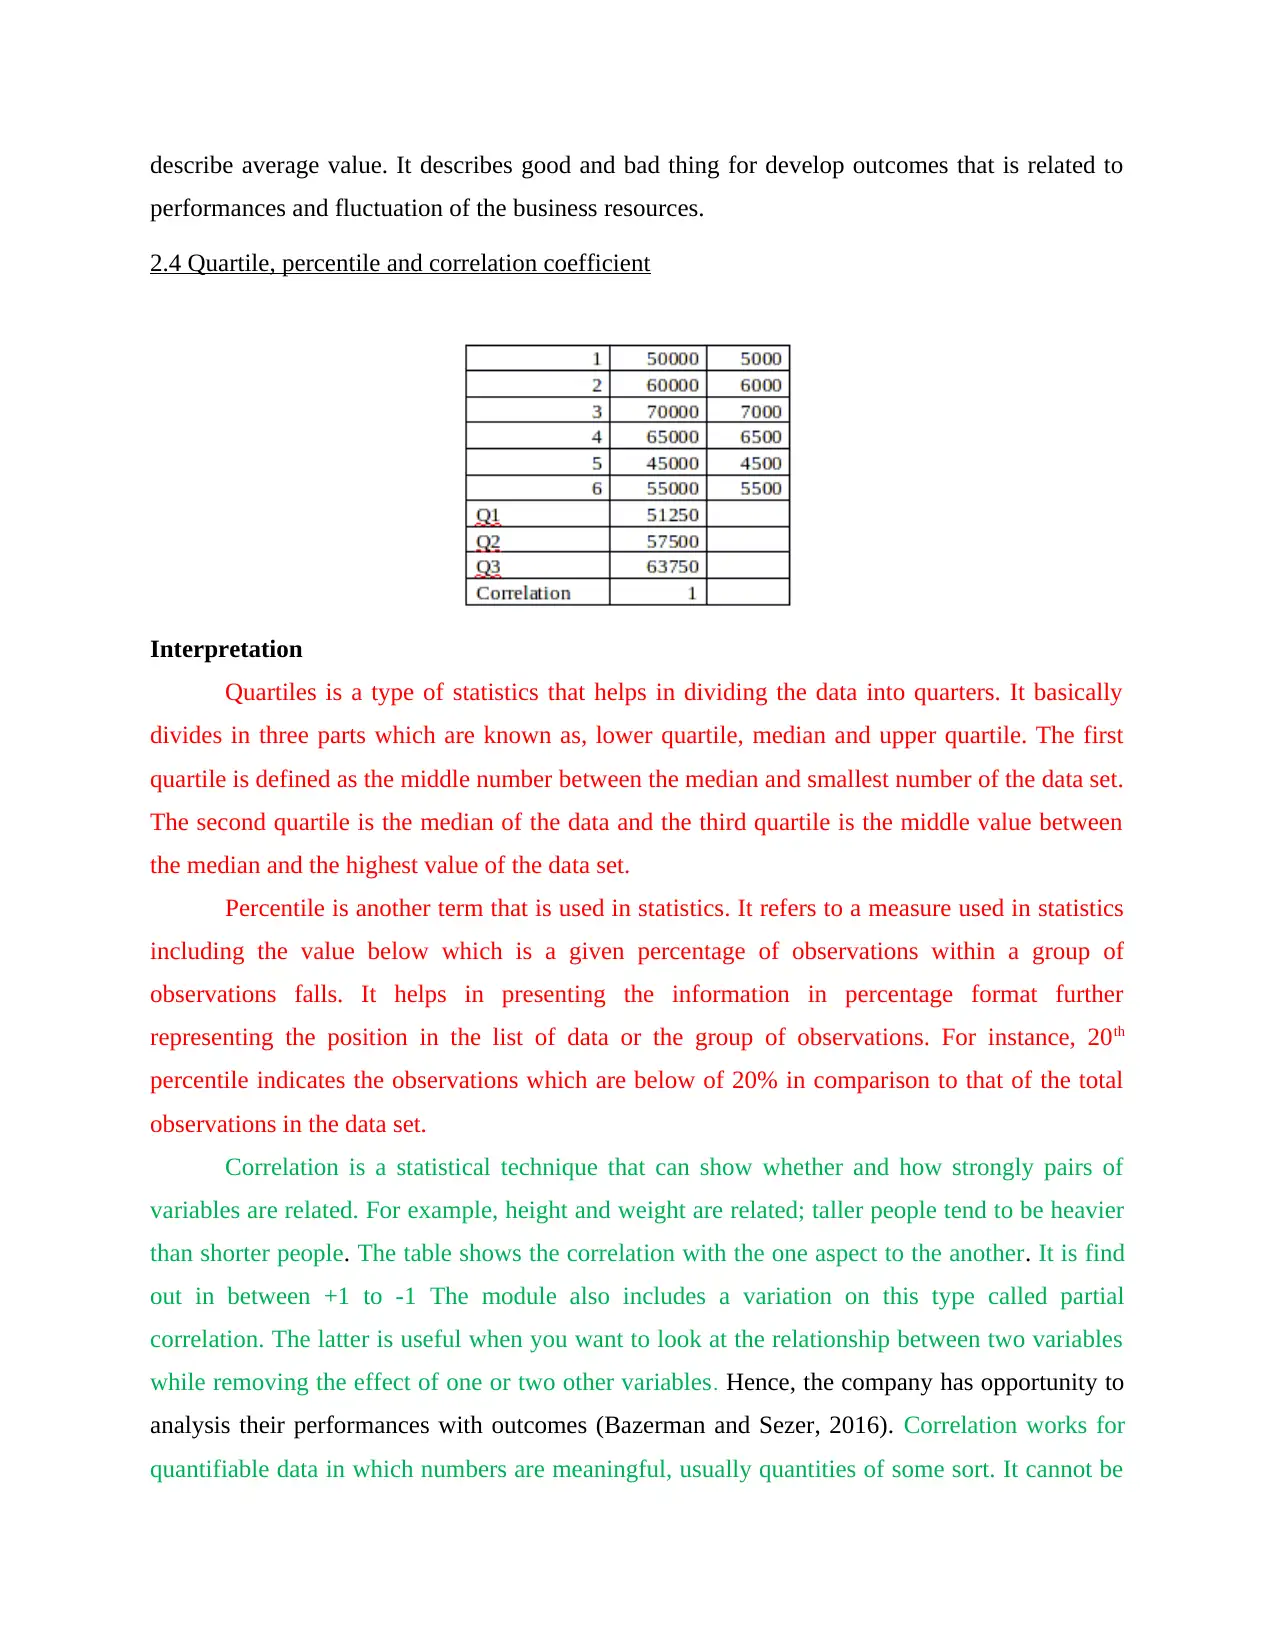
2.4 Quartile, percentile and correlation coefficient
Interpretation
Quartiles is a type of statistics that helps in dividing the data into quarters. It basically
divides in three parts which are known as, lower quartile, median and upper quartile. The first
quartile is defined as the middle number between the median and smallest number of the data set.
The second quartile is the median of the data and the third quartile is the middle value between
the median and the highest value of the data set.
Percentile is another term that is used in statistics. It refers to a measure used in statistics
including the value below which is a given percentage of observations within a group of
observations falls. It helps in presenting the information in percentage format further
representing the position in the list of data or the group of observations. For instance, 20th
percentile indicates the observations which are below of 20% in comparison to that of the total
observations in the data set.
Correlation is a statistical technique that can show whether and how strongly pairs of
variables are related. For example, height and weight are related; taller people tend to be heavier
than shorter people. The table shows the correlation with the one aspect to the another. It is find
out in between +1 to -1 The module also includes a variation on this type called partial
correlation. The latter is useful when you want to look at the relationship between two variables
while removing the effect of one or two other variables. Hence, the company has opportunity to
analysis their performances with outcomes (Bazerman and Sezer, 2016). Correlation works for
quantifiable data in which numbers are meaningful, usually quantities of some sort. It cannot be
performances and fluctuation of the business resources.
2.4 Quartile, percentile and correlation coefficient
Interpretation
Quartiles is a type of statistics that helps in dividing the data into quarters. It basically
divides in three parts which are known as, lower quartile, median and upper quartile. The first
quartile is defined as the middle number between the median and smallest number of the data set.
The second quartile is the median of the data and the third quartile is the middle value between
the median and the highest value of the data set.
Percentile is another term that is used in statistics. It refers to a measure used in statistics
including the value below which is a given percentage of observations within a group of
observations falls. It helps in presenting the information in percentage format further
representing the position in the list of data or the group of observations. For instance, 20th
percentile indicates the observations which are below of 20% in comparison to that of the total
observations in the data set.
Correlation is a statistical technique that can show whether and how strongly pairs of
variables are related. For example, height and weight are related; taller people tend to be heavier
than shorter people. The table shows the correlation with the one aspect to the another. It is find
out in between +1 to -1 The module also includes a variation on this type called partial
correlation. The latter is useful when you want to look at the relationship between two variables
while removing the effect of one or two other variables. Hence, the company has opportunity to
analysis their performances with outcomes (Bazerman and Sezer, 2016). Correlation works for
quantifiable data in which numbers are meaningful, usually quantities of some sort. It cannot be
⊘ This is a preview!⊘
Do you want full access?
Subscribe today to unlock all pages.
Trusted by 1+ million students worldwide
used for purely categorical data, such as gender, brands purchased, or favourite colour.
Therefore, the chosen firm need to enhance their outcomes and performances for increase future
profit.
It has been presented that relationship develops among the two factors that assists to
collect the data in systematic work. For instance, revenue and profits, expenses and revenue, etc.
On the other hand, correlation between two different aspect considered relationship among the
customer dealing and accommodation for the effective results at workplace.
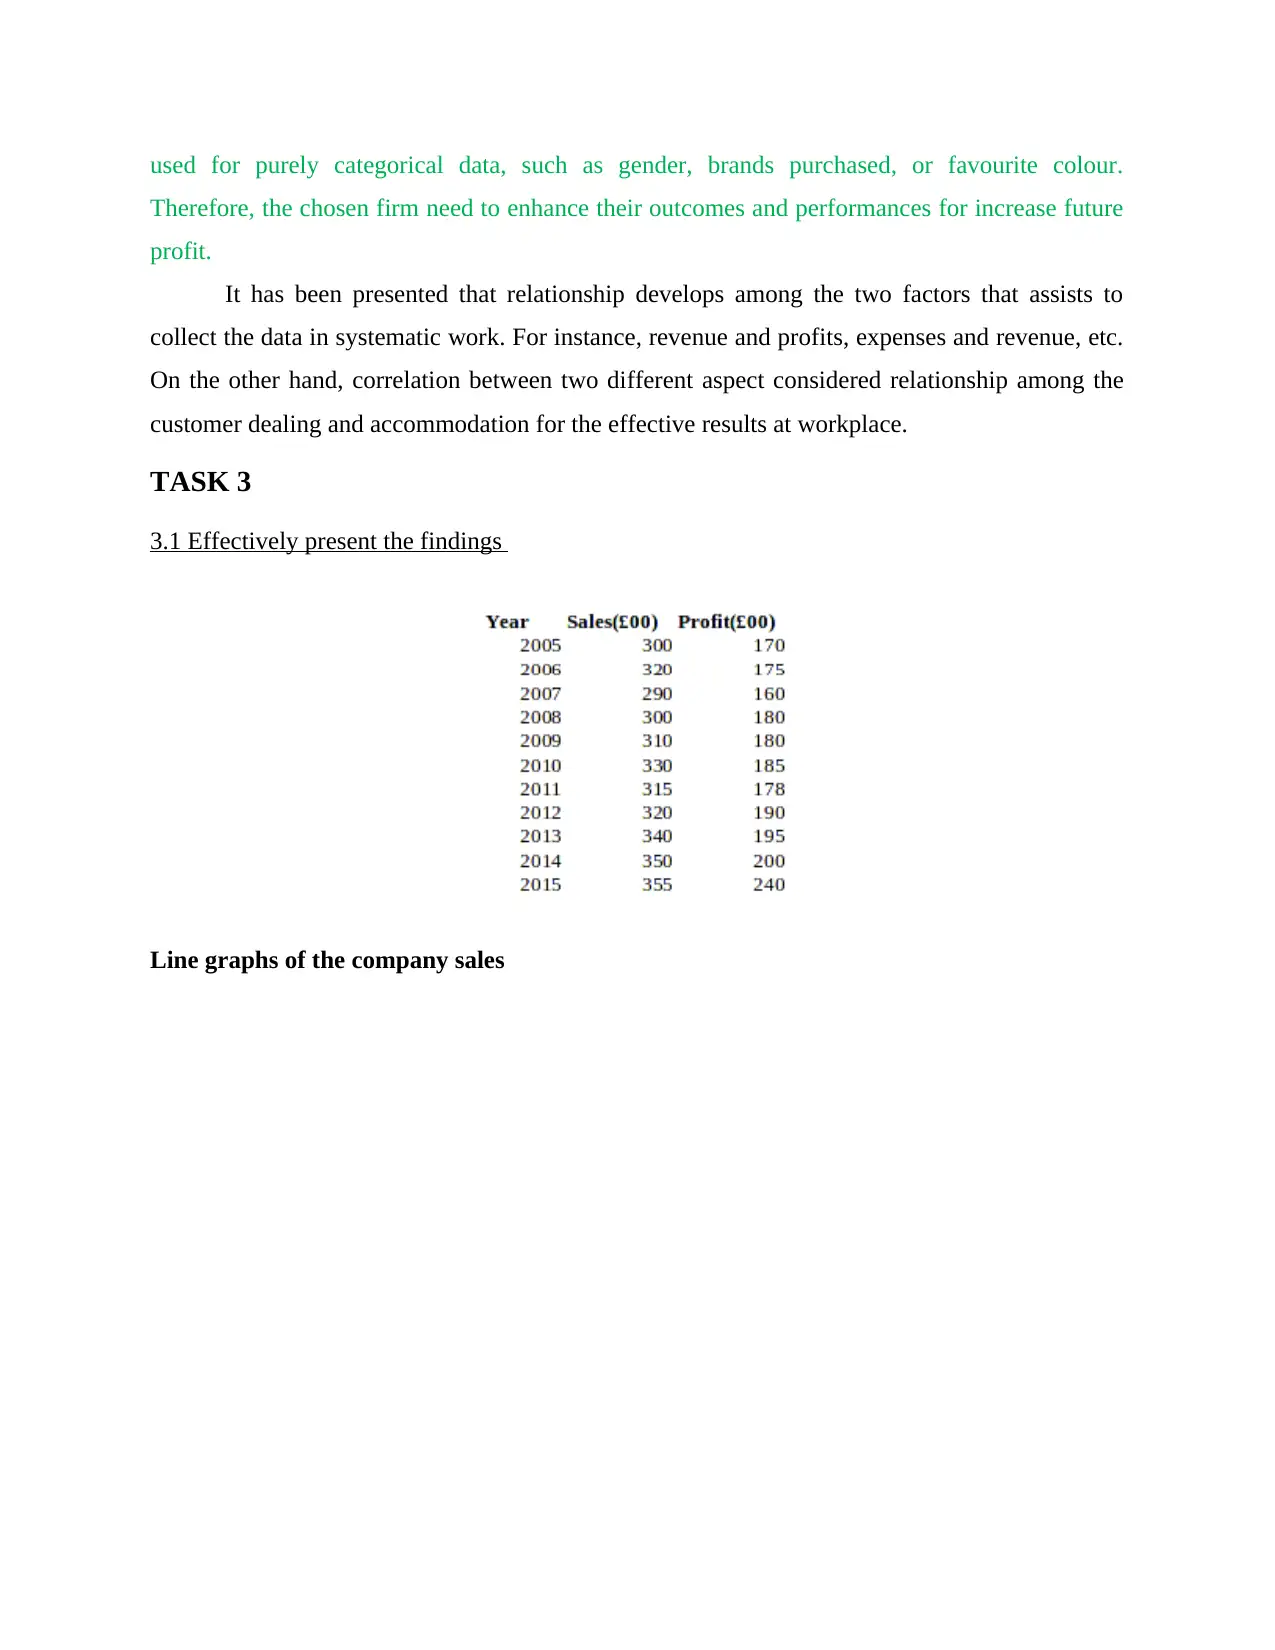
TASK 3
3.1 Effectively present the findings
Line graphs of the company sales
Therefore, the chosen firm need to enhance their outcomes and performances for increase future
profit.
It has been presented that relationship develops among the two factors that assists to
collect the data in systematic work. For instance, revenue and profits, expenses and revenue, etc.
On the other hand, correlation between two different aspect considered relationship among the
customer dealing and accommodation for the effective results at workplace.
TASK 3
3.1 Effectively present the findings
Line graphs of the company sales
Paraphrase This Document
Need a fresh take? Get an instant paraphrase of this document with our AI Paraphraser
2005 2006 2007 2008 2009 2010 2011 2012 2013 2014 2015
0
50
100
150
200
250
300
350
400
300 320
290 300 310 330 315 320 340 350 355
S a le s ( 0 0 )
S a le s (00)
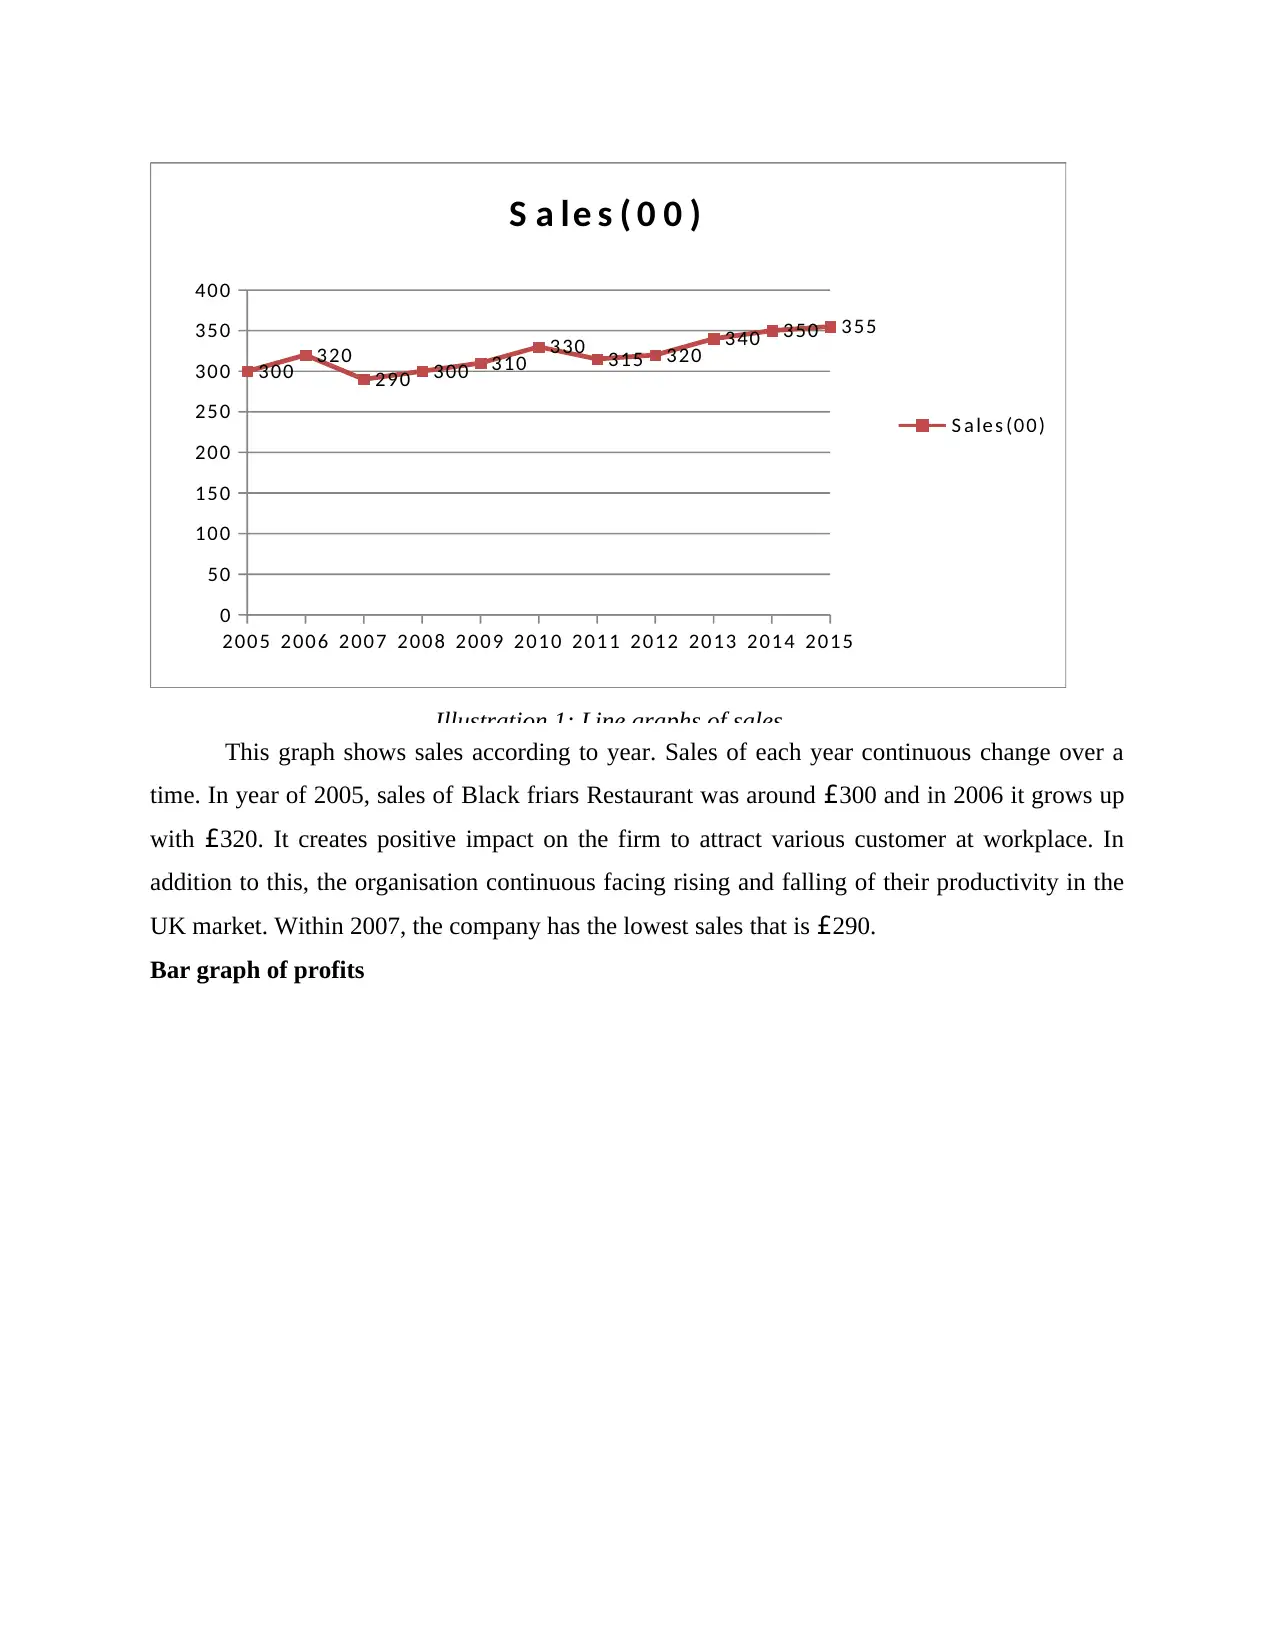
Illustration 1: Line graphs of sales
This graph shows sales according to year. Sales of each year continuous change over a
time. In year of 2005, sales of Black friars Restaurant was around £300 and in 2006 it grows up
with £320. It creates positive impact on the firm to attract various customer at workplace. In
addition to this, the organisation continuous facing rising and falling of their productivity in the
UK market. Within 2007, the company has the lowest sales that is £290.
Bar graph of profits
0
50
100
150
200
250
300
350
400
300 320
290 300 310 330 315 320 340 350 355
S a le s ( 0 0 )
S a le s (00)
Illustration 1: Line graphs of sales
This graph shows sales according to year. Sales of each year continuous change over a
time. In year of 2005, sales of Black friars Restaurant was around £300 and in 2006 it grows up
with £320. It creates positive impact on the firm to attract various customer at workplace. In
addition to this, the organisation continuous facing rising and falling of their productivity in the
UK market. Within 2007, the company has the lowest sales that is £290.
Bar graph of profits
2005 2006 2007 2008 2009 2010 2011 2012 2013 2014 2015
0
50
100
150
200
250
170 175
160
180 180 185 178 190 195 200
240
P r o fi t ( 0 0 )
Profi t(00)
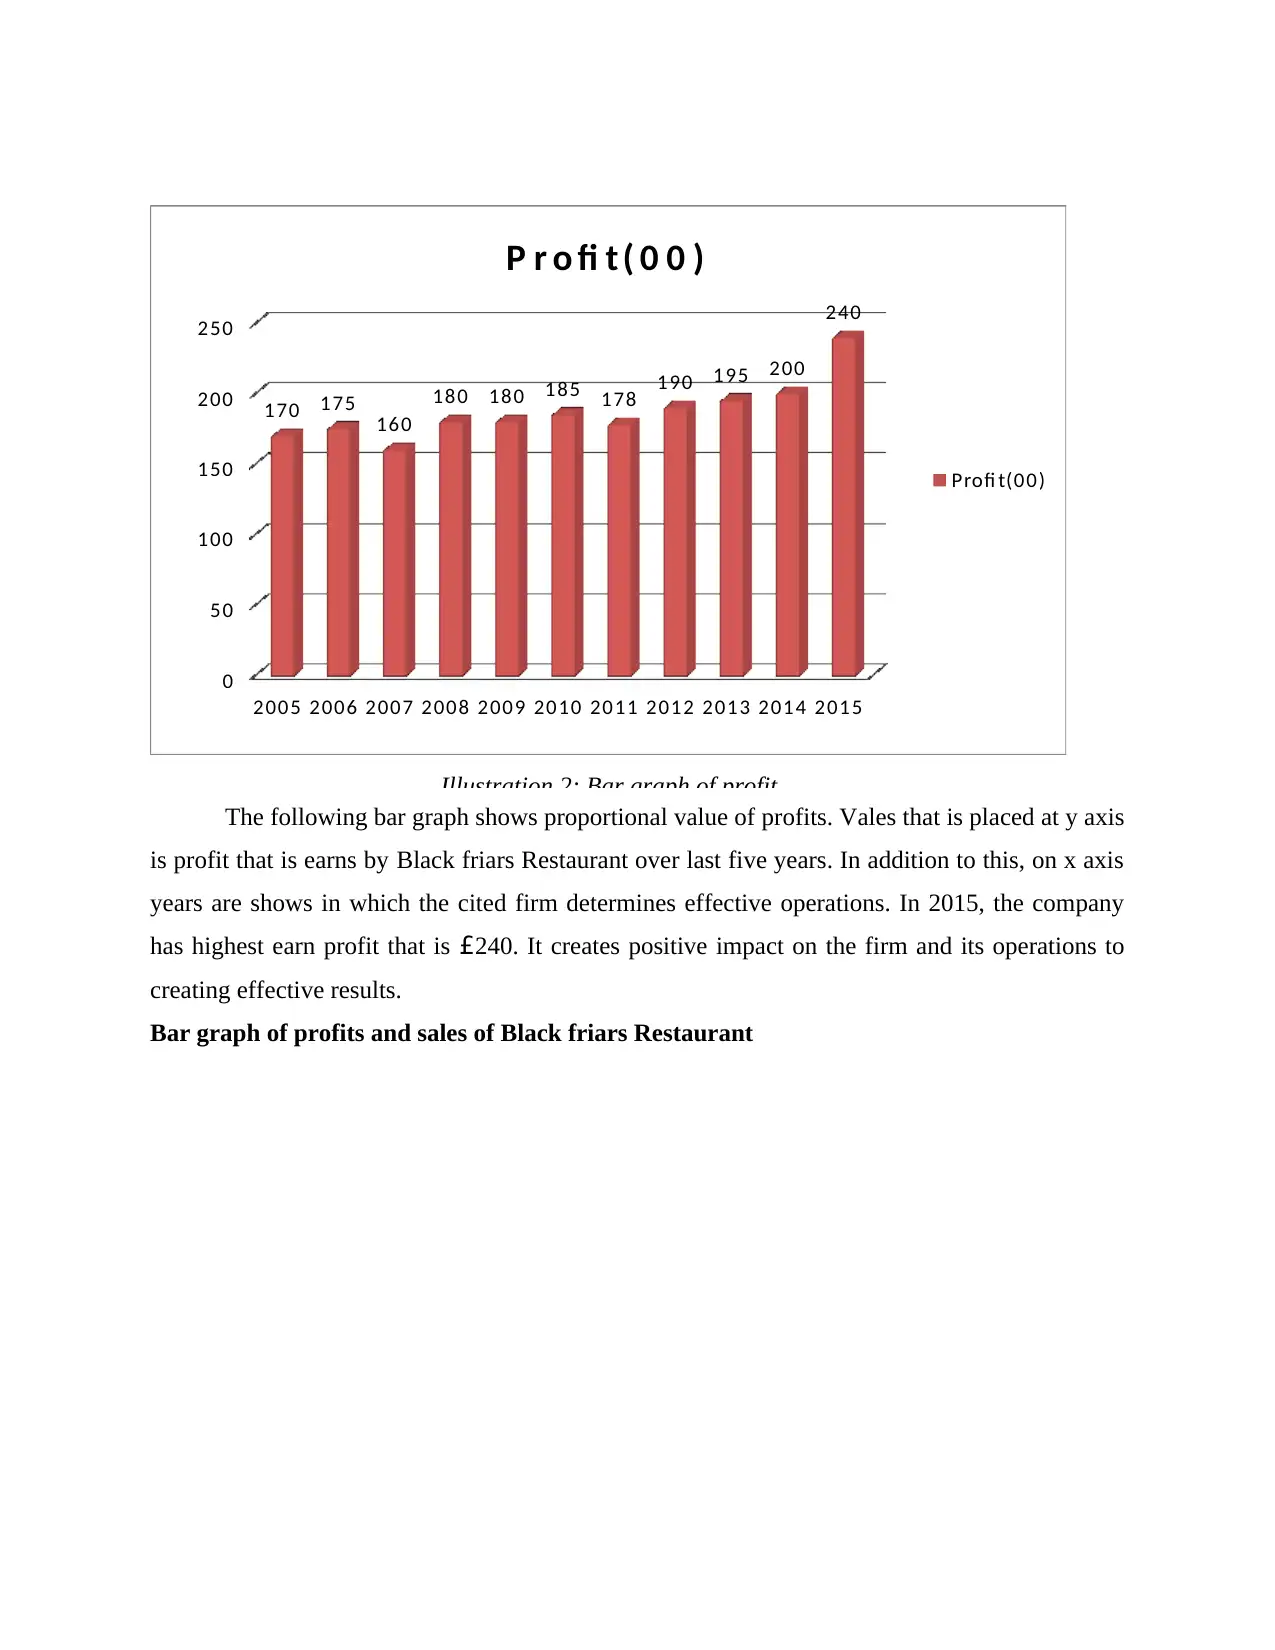
Illustration 2: Bar graph of profit
The following bar graph shows proportional value of profits. Vales that is placed at y axis
is profit that is earns by Black friars Restaurant over last five years. In addition to this, on x axis
years are shows in which the cited firm determines effective operations. In 2015, the company
has highest earn profit that is £240. It creates positive impact on the firm and its operations to
creating effective results.
Bar graph of profits and sales of Black friars Restaurant
0
50
100
150
200
250
170 175
160
180 180 185 178 190 195 200
240
P r o fi t ( 0 0 )
Profi t(00)
Illustration 2: Bar graph of profit
The following bar graph shows proportional value of profits. Vales that is placed at y axis
is profit that is earns by Black friars Restaurant over last five years. In addition to this, on x axis
years are shows in which the cited firm determines effective operations. In 2015, the company
has highest earn profit that is £240. It creates positive impact on the firm and its operations to
creating effective results.
Bar graph of profits and sales of Black friars Restaurant
⊘ This is a preview!⊘
Do you want full access?
Subscribe today to unlock all pages.
Trusted by 1+ million students worldwide
1 out of 29
Related Documents


Your All-in-One AI-Powered Toolkit for Academic Success.
+13062052269
info@desklib.com
Available 24*7 on WhatsApp / Email
![[object Object]](/_next/static/media/star-bottom.7253800d.svg)
Unlock your academic potential
Copyright © 2020–2026 A2Z Services. All Rights Reserved. Developed and managed by ZUCOL.