Business Decision Making Report: Food for Friends Expansion in London
VerifiedAdded on 2021/01/02
|25
|4330
|341
Report
AI Summary
This report provides a detailed analysis of business decision-making for Food for Friends, a restaurant chain considering expansion. The report begins with an introduction to decision-making and its importance in organizational contexts, particularly within the context of the restaurant business. The report explores the application of primary and secondary research methods for gathering data, including the design of questionnaires and sample frameworks. It then presents the collected data, summarizing it using representative values like mean, median, and mode. The report further analyzes the data by evaluating measures of dispersion, such as range and standard deviation, and uses these to make informed business decisions. Various graphs, charts, and trend lines are used to visually represent the data and assess future growth, while financial tools like investment appraisal are applied to make informed decisions. The conclusion summarizes the key findings and recommendations based on the analysis.

Business Decision
Making
Making
Paraphrase This Document
Need a fresh take? Get an instant paraphrase of this document with our AI Paraphraser
Table of Contents
INTRODUCTION...........................................................................................................................1
TASK 1............................................................................................................................................1
1.1 Data collection sources and creation of plan.........................................................................1
1.2 Research methodologies and sample designing....................................................................2
1.3 Questionnaire designing........................................................................................................3
TASK 2............................................................................................................................................5
2.1: Creating data by summarising information with the help of representative value..............5
2.2: Analysis of data by collected from the research..................................................................7
2.3: Evaluating measure of dispersion........................................................................................8
2.4: Benefits of using quartile, percentile and coefficient correlation........................................9
TASK 3............................................................................................................................................9
3.1: Various graphs and charts....................................................................................................9
3.2: Trend line...........................................................................................................................14
3.3: Covered in PPT..................................................................................................................15
TASK 4..........................................................................................................................................16
4.1: Use of data methods in decision making...........................................................................16
4.2: Critical path........................................................................................................................16
4.3: Investment appraisal tools..................................................................................................18
CONCLUSION..............................................................................................................................18
REFERENCES..............................................................................................................................20
INTRODUCTION
Decision making is important aspect which helps in selection of the best alternative from
large number of choices. In organisational context, it helps in to identify the most profitable part
of organisation and reduction of unnecessary expenses through providing more emphasis on such
activities. Research is such factor which contributes their effort in improvement of decision-
making. This would helps in collection of large number of information through application of
primary and secondary methods of data collection. Appropriate results and conclusions are
gathered by the organisation through adoption of different statistical and accounting methods.
Food for Friends is restaurant which which operates their business activities in London with the
aim of expanding new branch in London (Aharoni, Tihanyi and Connelly, 2011).
In the present report explain about, application of primary and secondary method for
creation of plan, designing of survey methodologies and sample framing, formulation of
questionnaire for business issues, interpretation of data with the helps of the methods like mean,
median, mode, correlation coefficient etc. Also, presentation of the results with the help of
graphs and pie charts, trend lines are used to assess the future growth of restaurant and
application of the information and financial tools to take better decisions.
TASK 1
1.1 Data collection sources and creation of plan
For ascertaining the viability of move regarding expansion of operations and opening of
new branch in London, views of respondents and market information are required to gathered. In
this regard, main role is played by the research activities which includes the use of different
method to collection information from different sources. There are two method which are
majorly used to collect the information which are known as primary and secondary methods.
Primary method is used to gather the views of respondents and secondary method is used to
collect information from the market which is in published form in different sources. It provides
the opportunity to the management of Food for Friends is to accomplish their objectives within
given frame of time and provide services as per their needs to improve sales and profitability.
Primary sources: This method is used to collect the first hand information from the
respondents. Here, respondents provides their on views and feedbacks on different aspects which
are asked to them. The information which is collected from the use of different tools which
1
⊘ This is a preview!⊘
Do you want full access?
Subscribe today to unlock all pages.
Trusted by 1+ million students worldwide
comes under primary method is true and correct in nature and free from bias. So, the results
which are gathered from analysis of the information is accurate. The different tools which are
comes under includes interview, questionnaire, online etc. which re defined below:
Interview: This method includes collection of information through getting face to face
interaction with respondents. It helps to gather the information through analyse their gestures and
behaviour also.
Questionnaire: It includes formulation of questions are are further asked to respondents
to ascertain their views in form of answers (Ferrell and Fraedrich, 2015).
Online: This includes use of digital platform to collect information like websites, online
poll etc.
Secondary method: It is used to collect the second hand information which is contained
by different sources like articles, magazines and newspapers etc. All the information is not
directly related to research topic but gathered in less period of time.
1.2 Research methodologies and sample designing
Food for Friends is a restaurant which provides various kind of dishes to attract the large
number of customers and satisfy their different requirements. The main aim of the management
of restaurant is to open new branch in London for expand their operations and capture large
market share. In this regard, need to conduct research which helps to take informed decisions
which provides the opportunity is to higher number of results. To perform their research
activities in effective manner need to outline the design which guides in researcher to perform
functions in effective manner to achieve desired results.
Survey methodologies: This includes about the determination of the method is used
regarding collection of information. To carry out their research activities in effective manner,
researcher of Food for Friends is decided to use questionnaire tool under primary method. Here,
close-ended questionnaire is prepared which contains 10 different questions attached with the
answers from the one is selected as per their choice by the respondents. It helps to know the
viability of their move about opening of new branch in London and ascertain desired results.
Sample framework: Here the procedure is started regarding selection of the respondents
from total population. There are many method are present such as cluster, stratifies and random.
Due to having the limited period of time the researcher of Food for Friends decided to use
2
Paraphrase This Document
Need a fresh take? Get an instant paraphrase of this document with our AI Paraphraser
random sampling method to select 60 respondents from total population to ask the research
questions which are framed while preparing questionnaire.
In the present reports information is gathered regarding:
Existing performance of Food for Friends
Viability of move of opening new branch in London
Pricing policies
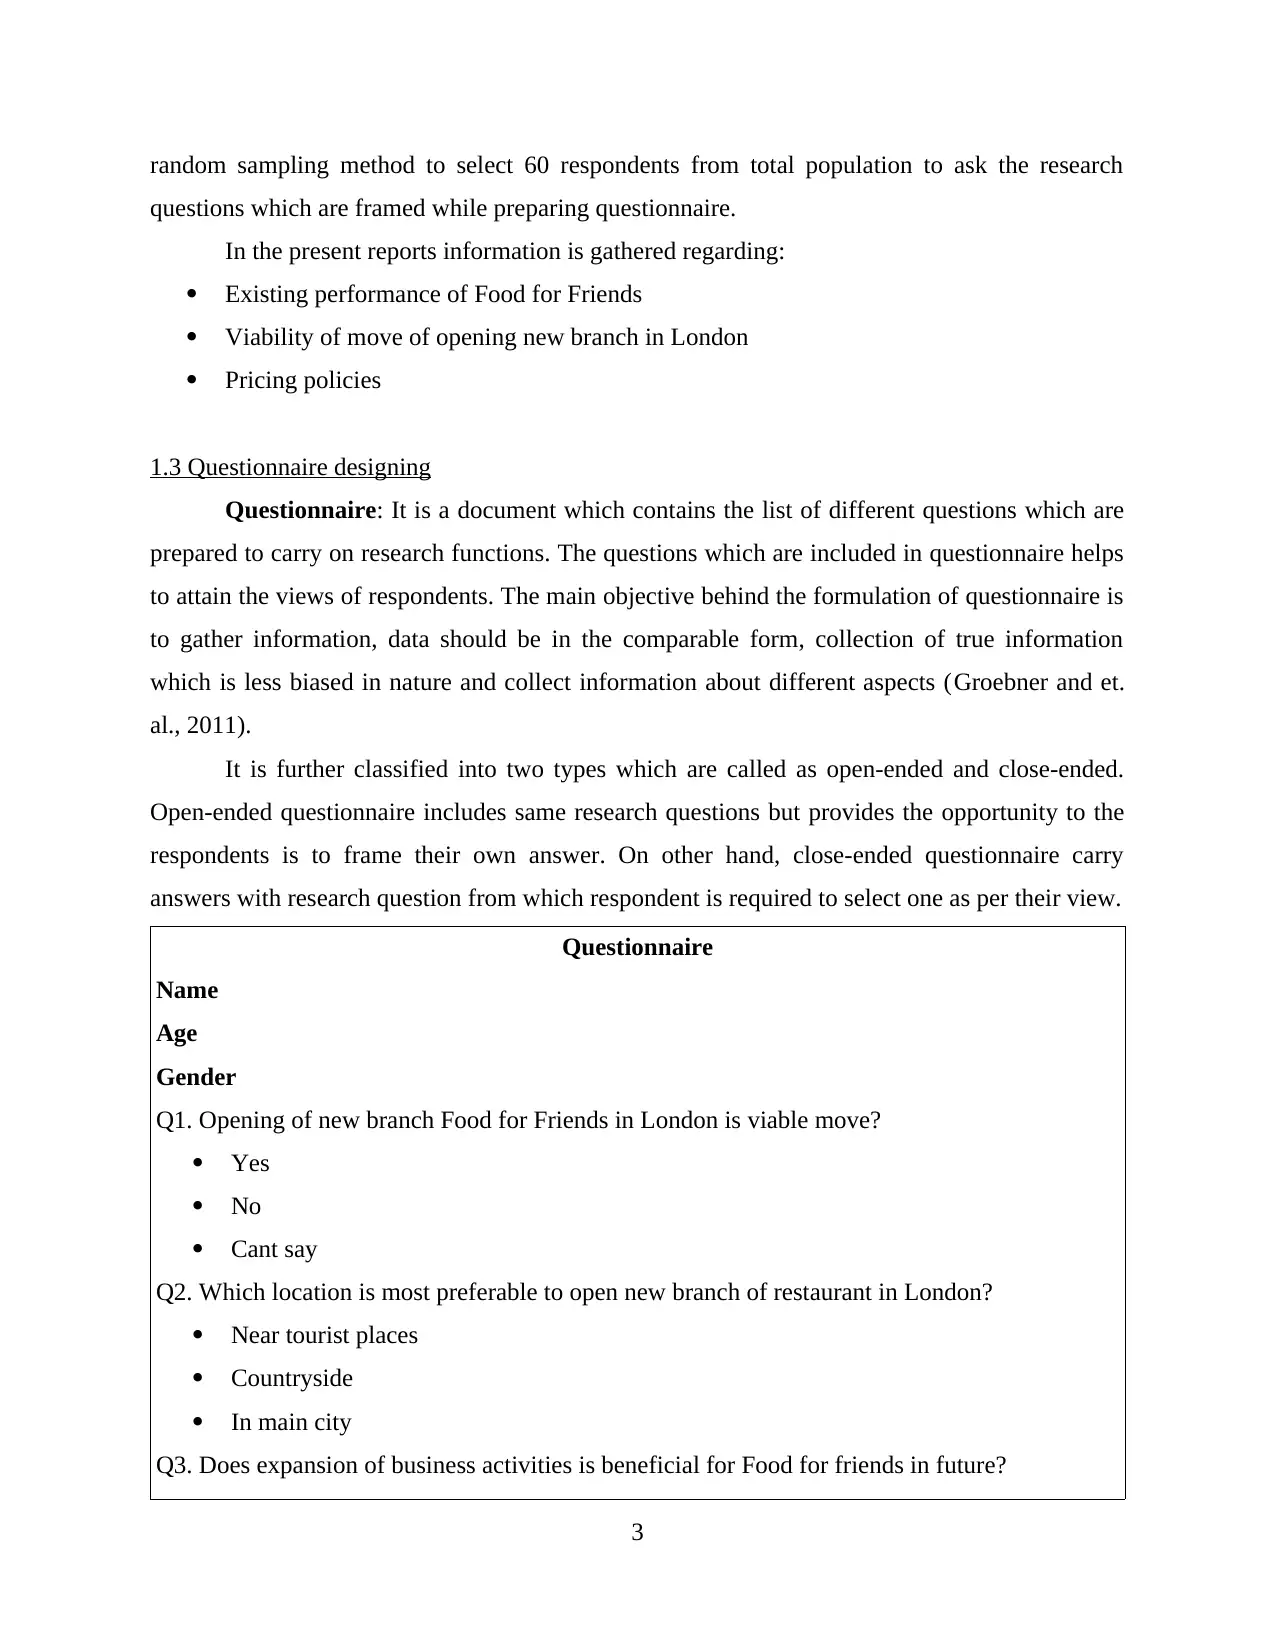
1.3 Questionnaire designing
Questionnaire: It is a document which contains the list of different questions which are
prepared to carry on research functions. The questions which are included in questionnaire helps
to attain the views of respondents. The main objective behind the formulation of questionnaire is
to gather information, data should be in the comparable form, collection of true information
which is less biased in nature and collect information about different aspects (Groebner and et.
al., 2011).
It is further classified into two types which are called as open-ended and close-ended.
Open-ended questionnaire includes same research questions but provides the opportunity to the
respondents is to frame their own answer. On other hand, close-ended questionnaire carry
answers with research question from which respondent is required to select one as per their view.
Questionnaire
Name
Age
Gender
Q1. Opening of new branch Food for Friends in London is viable move?
Yes
No
Cant say
Q2. Which location is most preferable to open new branch of restaurant in London?
Near tourist places
Countryside
In main city
Q3. Does expansion of business activities is beneficial for Food for friends in future?
3
questions which are framed while preparing questionnaire.
In the present reports information is gathered regarding:
Existing performance of Food for Friends
Viability of move of opening new branch in London
Pricing policies
1.3 Questionnaire designing
Questionnaire: It is a document which contains the list of different questions which are
prepared to carry on research functions. The questions which are included in questionnaire helps
to attain the views of respondents. The main objective behind the formulation of questionnaire is
to gather information, data should be in the comparable form, collection of true information
which is less biased in nature and collect information about different aspects (Groebner and et.
al., 2011).
It is further classified into two types which are called as open-ended and close-ended.
Open-ended questionnaire includes same research questions but provides the opportunity to the
respondents is to frame their own answer. On other hand, close-ended questionnaire carry
answers with research question from which respondent is required to select one as per their view.
Questionnaire
Name
Age
Gender
Q1. Opening of new branch Food for Friends in London is viable move?
Yes
No
Cant say
Q2. Which location is most preferable to open new branch of restaurant in London?
Near tourist places
Countryside
In main city
Q3. Does expansion of business activities is beneficial for Food for friends in future?
3
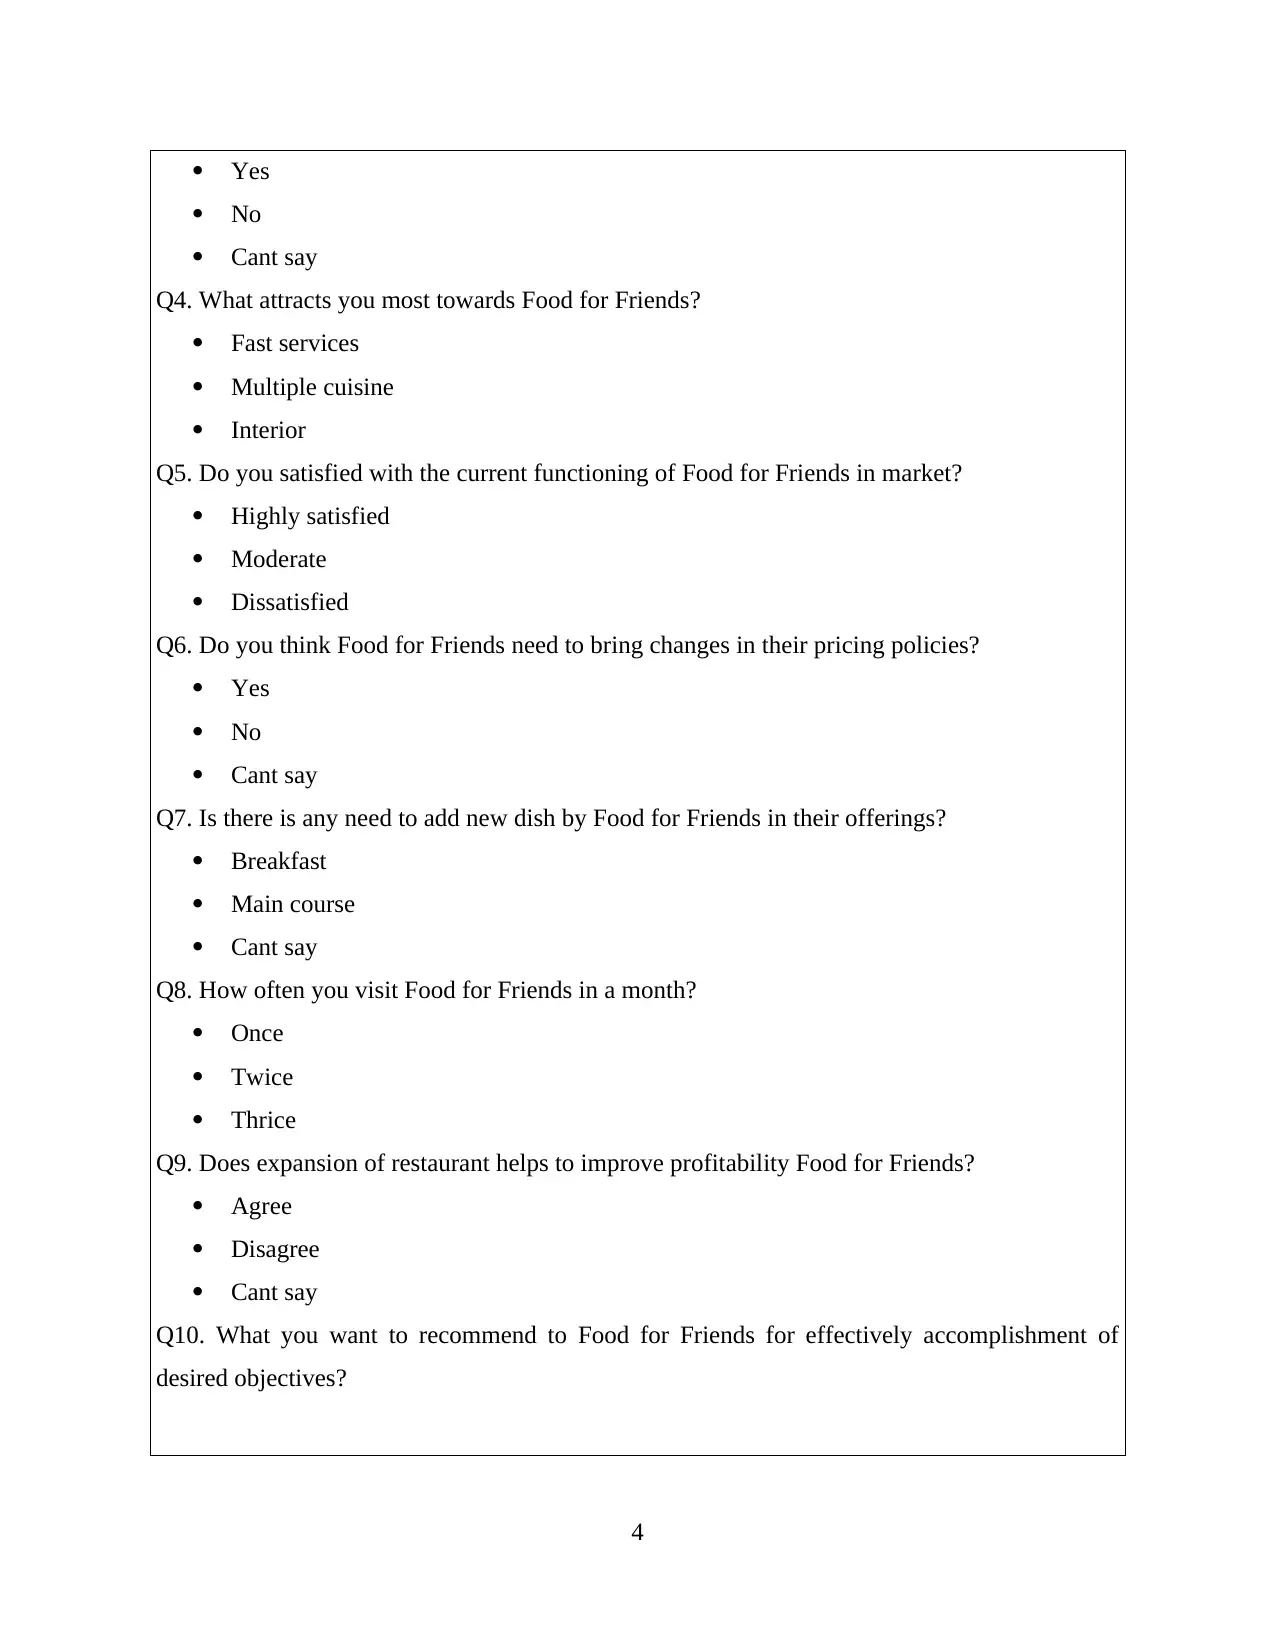
Yes
No
Cant say
Q4. What attracts you most towards Food for Friends?
Fast services
Multiple cuisine
Interior
Q5. Do you satisfied with the current functioning of Food for Friends in market?
Highly satisfied
Moderate
Dissatisfied
Q6. Do you think Food for Friends need to bring changes in their pricing policies?
Yes
No
Cant say
Q7. Is there is any need to add new dish by Food for Friends in their offerings?
Breakfast
Main course
Cant say
Q8. How often you visit Food for Friends in a month?
Once
Twice
Thrice
Q9. Does expansion of restaurant helps to improve profitability Food for Friends?
Agree
Disagree
Cant say
Q10. What you want to recommend to Food for Friends for effectively accomplishment of
desired objectives?
4
No
Cant say
Q4. What attracts you most towards Food for Friends?
Fast services
Multiple cuisine
Interior
Q5. Do you satisfied with the current functioning of Food for Friends in market?
Highly satisfied
Moderate
Dissatisfied
Q6. Do you think Food for Friends need to bring changes in their pricing policies?
Yes
No
Cant say
Q7. Is there is any need to add new dish by Food for Friends in their offerings?
Breakfast
Main course
Cant say
Q8. How often you visit Food for Friends in a month?
Once
Twice
Thrice
Q9. Does expansion of restaurant helps to improve profitability Food for Friends?
Agree
Disagree
Cant say
Q10. What you want to recommend to Food for Friends for effectively accomplishment of
desired objectives?
4
⊘ This is a preview!⊘
Do you want full access?
Subscribe today to unlock all pages.
Trusted by 1+ million students worldwide
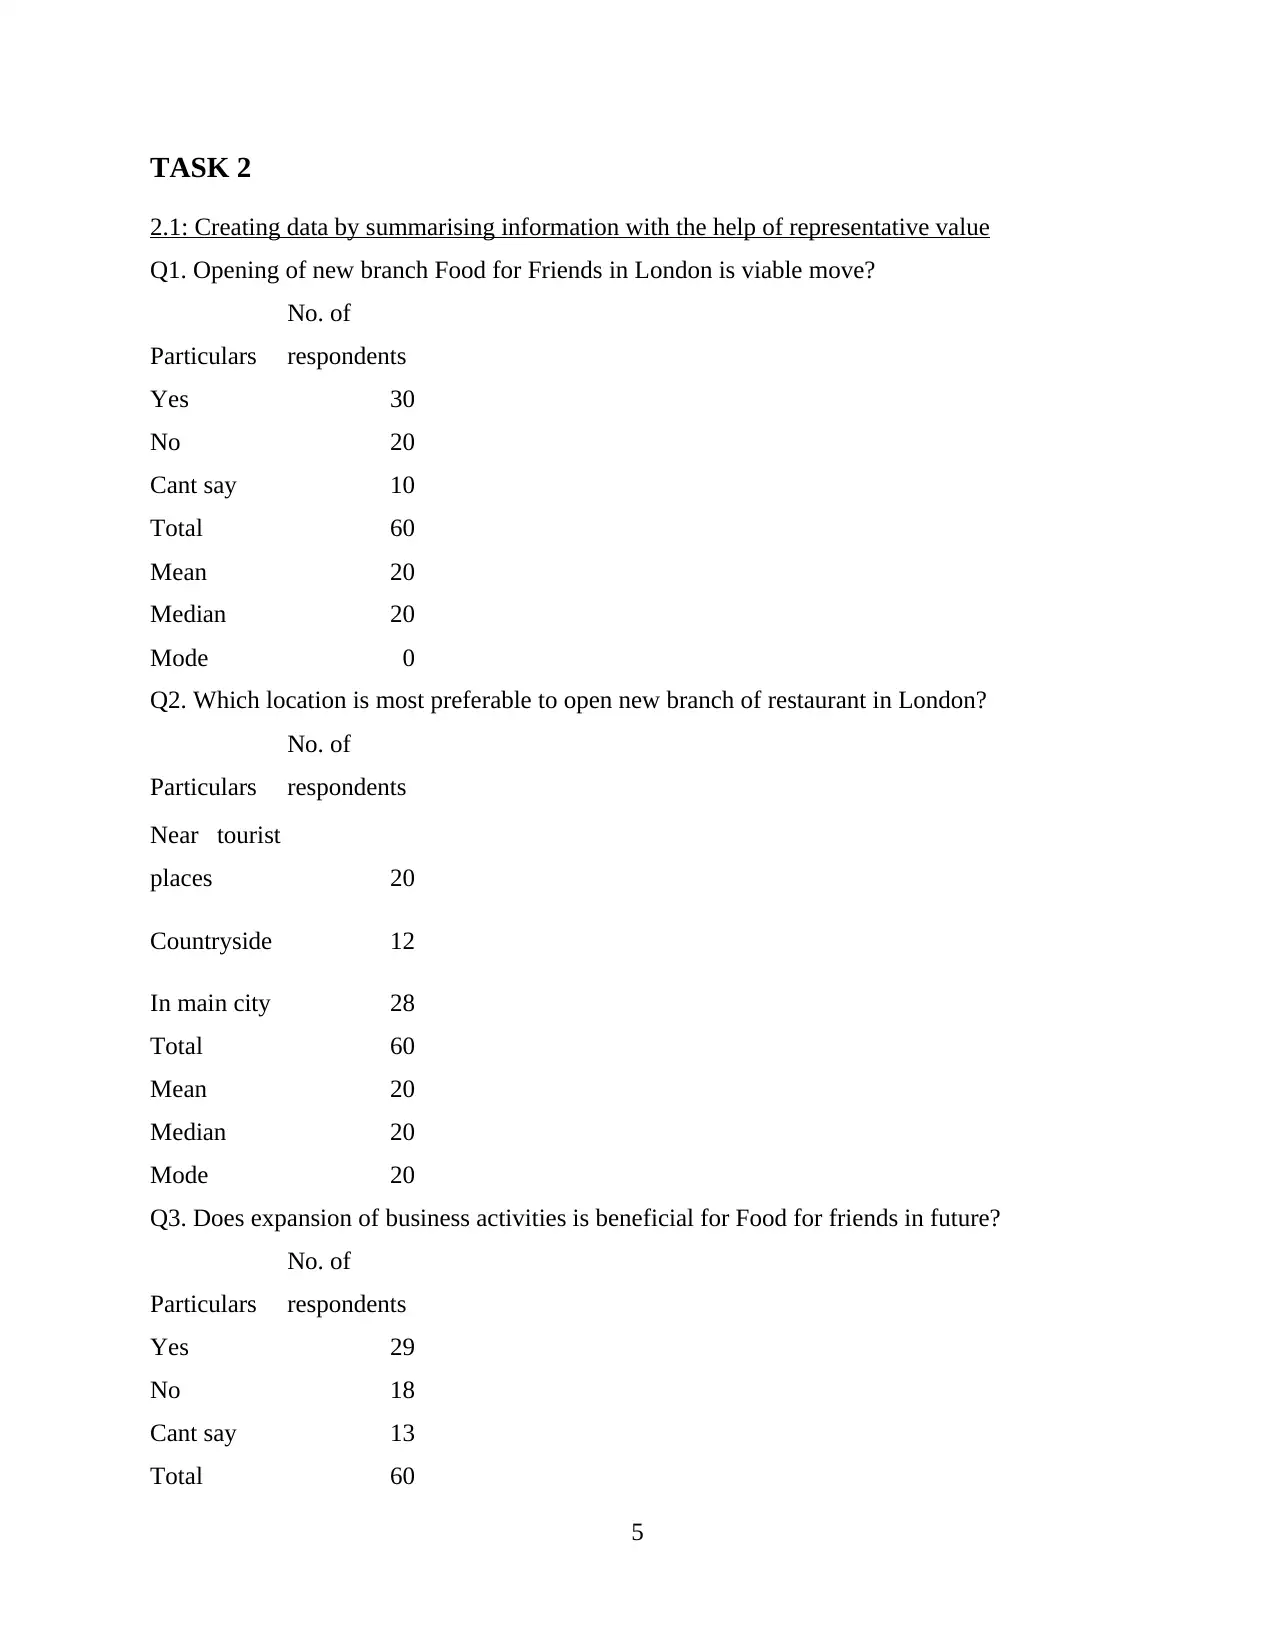
TASK 2
2.1: Creating data by summarising information with the help of representative value
Q1. Opening of new branch Food for Friends in London is viable move?
Particulars
No. of
respondents
Yes 30
No 20
Cant say 10
Total 60
Mean 20
Median 20
Mode 0
Q2. Which location is most preferable to open new branch of restaurant in London?
Particulars
No. of
respondents
Near tourist
places 20
Countryside 12
In main city 28
Total 60
Mean 20
Median 20
Mode 20
Q3. Does expansion of business activities is beneficial for Food for friends in future?
Particulars
No. of
respondents
Yes 29
No 18
Cant say 13
Total 60
5
Paraphrase This Document
Need a fresh take? Get an instant paraphrase of this document with our AI Paraphraser
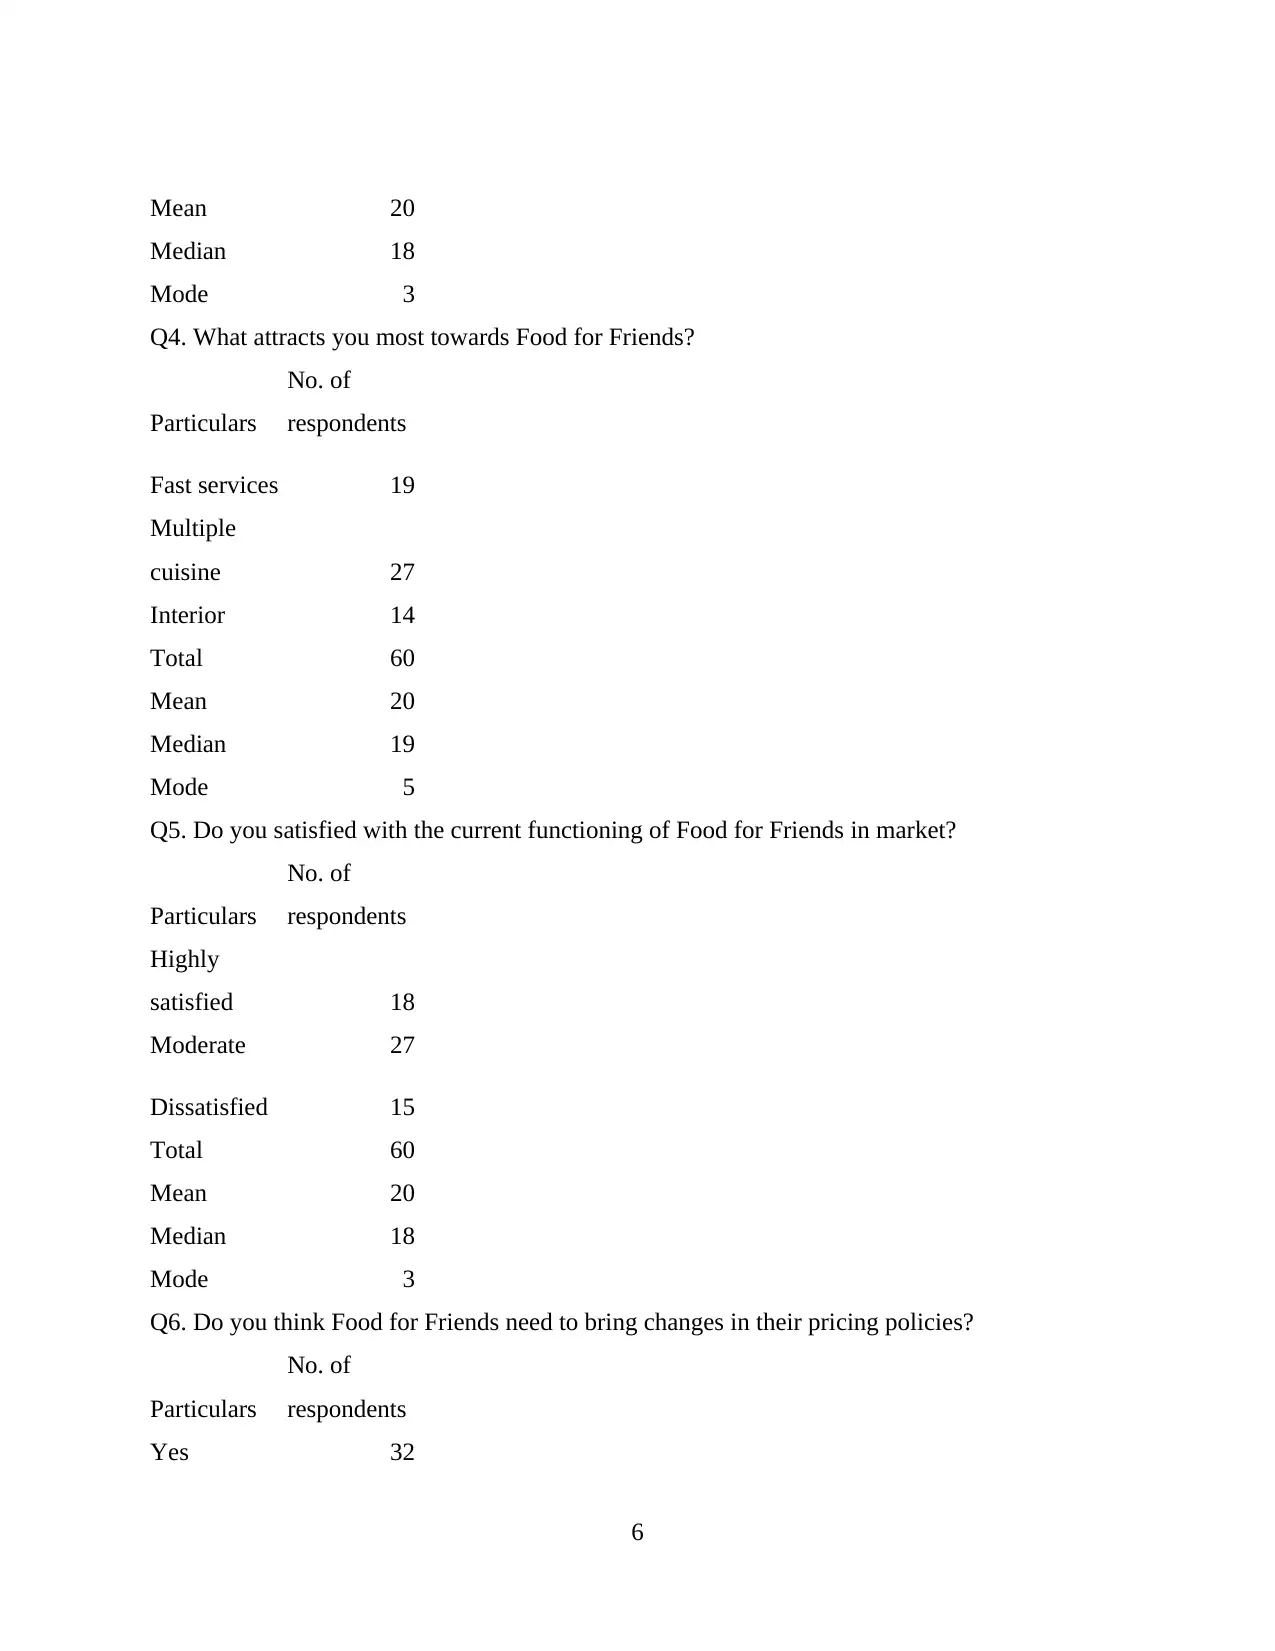
Mean 20
Median 18
Mode 3
Q4. What attracts you most towards Food for Friends?
Particulars
No. of
respondents
Fast services 19
Multiple
cuisine 27
Interior 14
Total 60
Mean 20
Median 19
Mode 5
Q5. Do you satisfied with the current functioning of Food for Friends in market?
Particulars
No. of
respondents
Highly
satisfied 18
Moderate 27
Dissatisfied 15
Total 60
Mean 20
Median 18
Mode 3
Q6. Do you think Food for Friends need to bring changes in their pricing policies?
Particulars
No. of
respondents
Yes 32
6
Median 18
Mode 3
Q4. What attracts you most towards Food for Friends?
Particulars
No. of
respondents
Fast services 19
Multiple
cuisine 27
Interior 14
Total 60
Mean 20
Median 19
Mode 5
Q5. Do you satisfied with the current functioning of Food for Friends in market?
Particulars
No. of
respondents
Highly
satisfied 18
Moderate 27
Dissatisfied 15
Total 60
Mean 20
Median 18
Mode 3
Q6. Do you think Food for Friends need to bring changes in their pricing policies?
Particulars
No. of
respondents
Yes 32
6
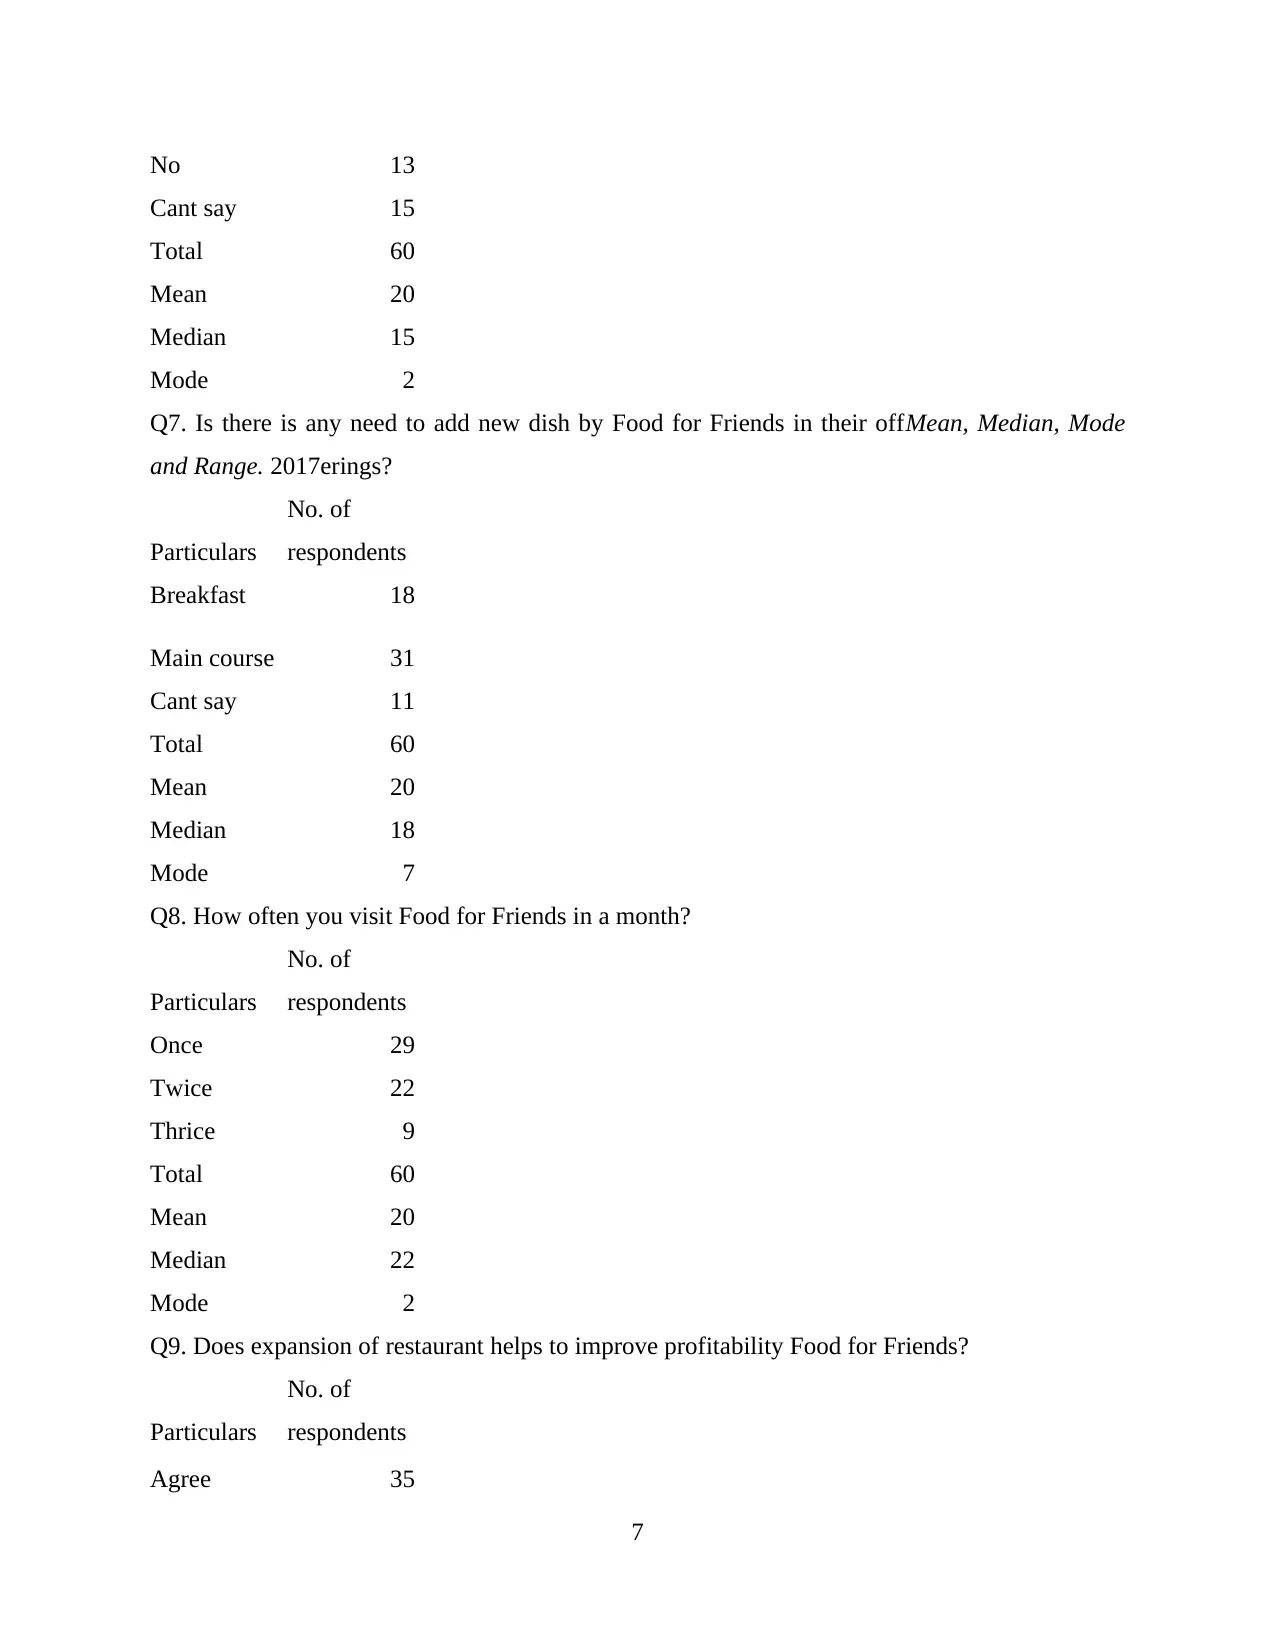
No 13
Cant say 15
Total 60
Mean 20
Median 15
Mode 2
Q7. Is there is any need to add new dish by Food for Friends in their offMean, Median, Mode
and Range. 2017erings?
Particulars
No. of
respondents
Breakfast 18
Main course 31
Cant say 11
Total 60
Mean 20
Median 18
Mode 7
Q8. How often you visit Food for Friends in a month?
Particulars
No. of
respondents
Once 29
Twice 22
Thrice 9
Total 60
Mean 20
Median 22
Mode 2
Q9. Does expansion of restaurant helps to improve profitability Food for Friends?
Particulars
No. of
respondents
Agree 35
7
⊘ This is a preview!⊘
Do you want full access?
Subscribe today to unlock all pages.
Trusted by 1+ million students worldwide
Disagree 18
Cant say 7
Total 60
Mean 20
Median 18
Mode 0
2.2: Analysis of data by collected from the research
Year Sales Net Profit
2008 3200 1150
2009 3300 1290
2010 3800 1450
2011 4100 1500
2012 4900 1650
2013 5500 1800
2014 5900 1950
2015 6150 2100
2016 6350 2200
2017 6500 2450
Mean 4970 1754
Median 5200 1725
Mode 3200 1150
Mean: It is refers as the process of calculating average of the figures which are present in
a series. The mean of sales and net profit from the above given series is calculated as 4970 and
1754.
8
Paraphrase This Document
Need a fresh take? Get an instant paraphrase of this document with our AI Paraphraser
Median: This will includes about calculation of middle value which is present in a series.
The different methods are applied in the case of even and odd number of present in a series. The
median of sales and net profit is 5200 and 1725 (Mean, Median, Mode and Range. 2017).
Mode: It is the number which present of the times in as series. The mode of sales and net
profit is 3200 and 1150 (Levy, 2015).
2.3: Evaluating measure of dispersion
Year Sales Net Profit
2008 3200 1150
2009 3300 1290
2010 3800 1450
2011 4100 1500
2012 4900 1650
2013 5500 1800
2014 5900 1950
2015 6150 2100
2016 6350 2200
2017 6500 2450
Minimum 3200 1150
Maximum 6500 2450
Standard
deviation
1283.91761
59102
420.507629
7366
Correlation
coefficient
0.97203698
27
Range: It is the method which includes calculation of minimum and maximum figures
from the above mentioned series of sales and net profit to interpret important results through its
comparison. The minimum range of sales and net profit is 3200 and 1150. The maximum range
of sales and net profit is 6500 and 2450.
Standard deviation: This method used by the management of Food for Friends to
identify the risks which are associated with their objective of opening new branch in London. It
9
helps to optimally utilise their given resources to attain maximum results. The standard deviation
of sales and net profit is 1283.9176159102 and 420.5076297366.
2.4: Benefits of using quartile, percentile and coefficient correlation
Quartile: It is a type of quantile where Q1 is mid number between smallest and median
of series. Q2 is median and Q3 is Mid number between median and highest value of series.
Percentile: This includes conversion of results in percentage form to get effective
conclusion through its comparison with other results. It improves decision making of manager.
Coefficient correlation: This includes identification of relation between two variables to
understand their impact upon each other (Pettigrew, 2014).
TASK 3
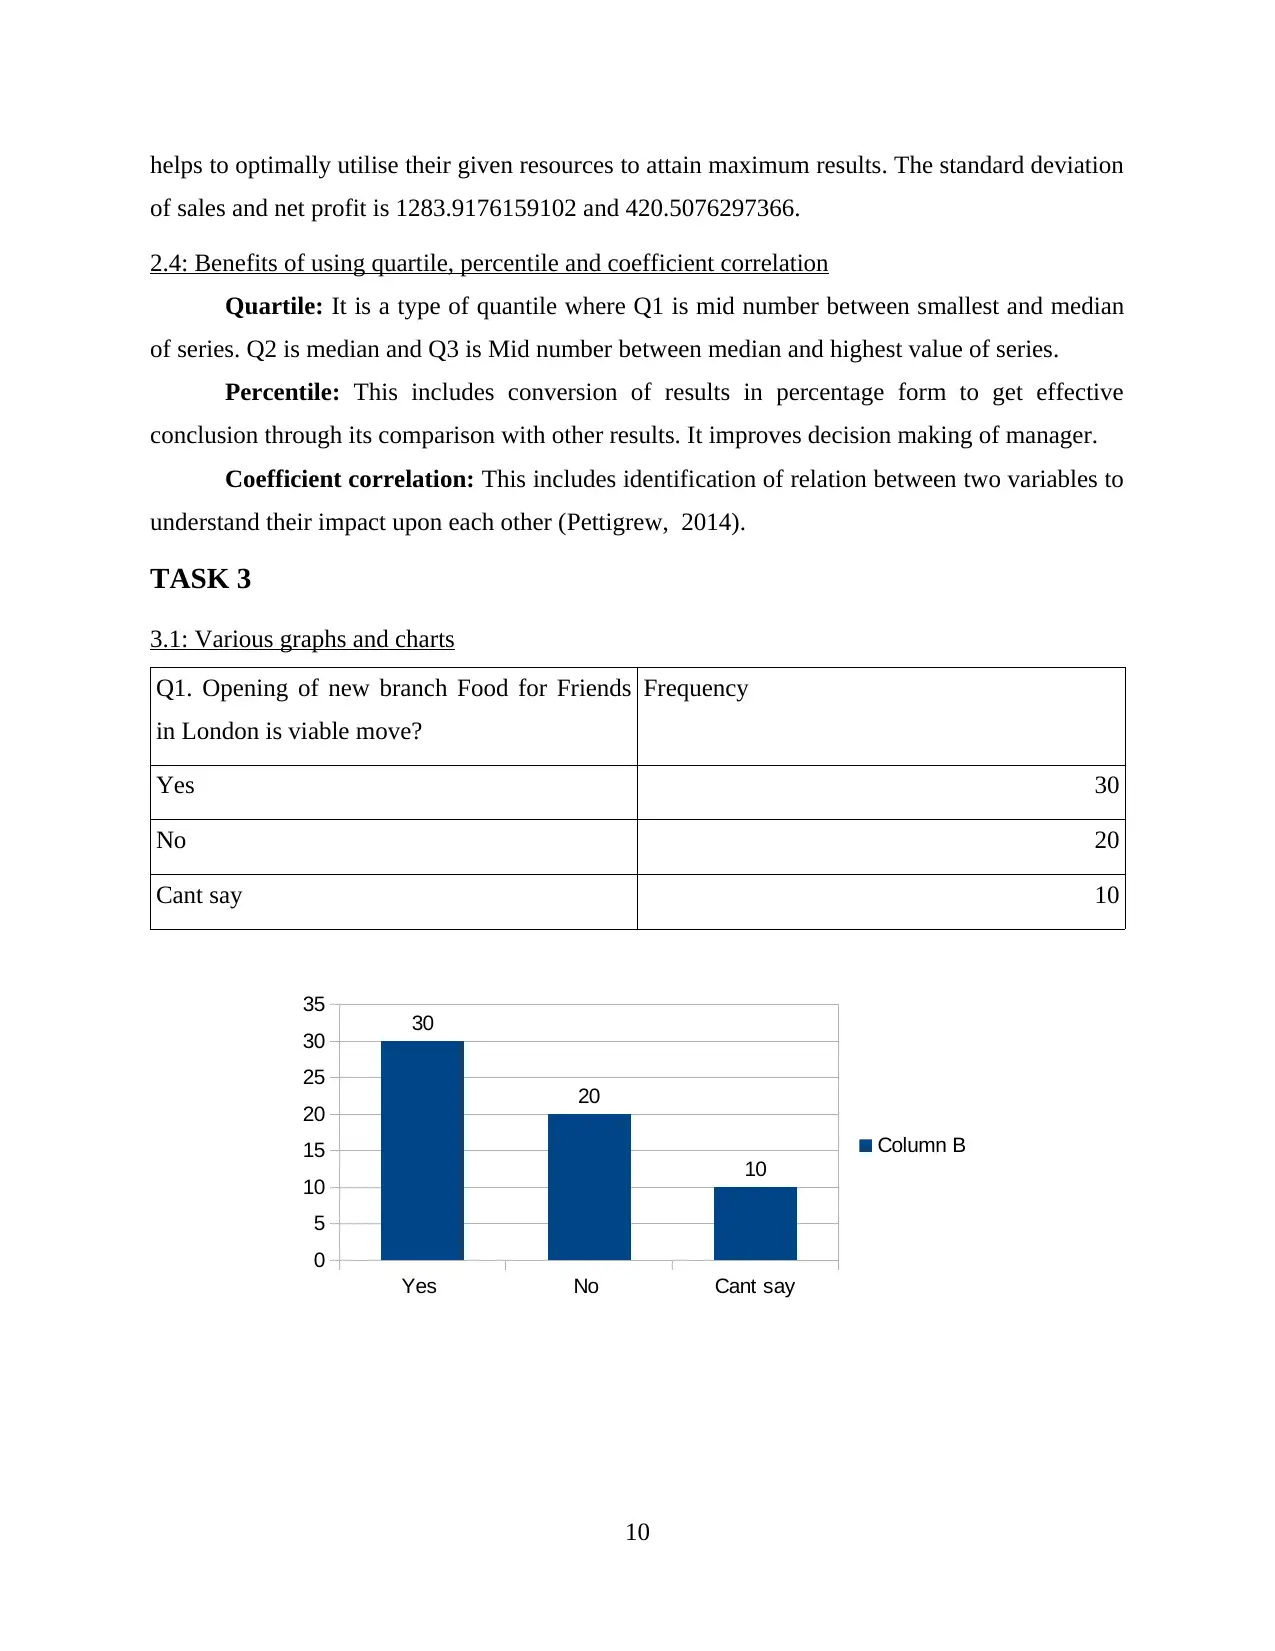
3.1: Various graphs and charts
Q1. Opening of new branch Food for Friends
in London is viable move?
Frequency
Yes 30
No 20
Cant say 10
10
Yes No Cant say
0
5
10
15
20
25
30
35 30
20
10
Column B
of sales and net profit is 1283.9176159102 and 420.5076297366.
2.4: Benefits of using quartile, percentile and coefficient correlation
Quartile: It is a type of quantile where Q1 is mid number between smallest and median
of series. Q2 is median and Q3 is Mid number between median and highest value of series.
Percentile: This includes conversion of results in percentage form to get effective
conclusion through its comparison with other results. It improves decision making of manager.
Coefficient correlation: This includes identification of relation between two variables to
understand their impact upon each other (Pettigrew, 2014).
TASK 3
3.1: Various graphs and charts
Q1. Opening of new branch Food for Friends
in London is viable move?
Frequency
Yes 30
No 20
Cant say 10
10
Yes No Cant say
0
5
10
15
20
25
30
35 30
20
10
Column B
⊘ This is a preview!⊘
Do you want full access?
Subscribe today to unlock all pages.
Trusted by 1+ million students worldwide
1 out of 25
Related Documents


Your All-in-One AI-Powered Toolkit for Academic Success.
+13062052269
info@desklib.com
Available 24*7 on WhatsApp / Email
![[object Object]](/_next/static/media/star-bottom.7253800d.svg)
Unlock your academic potential
Copyright © 2020–2026 A2Z Services. All Rights Reserved. Developed and managed by ZUCOL.