Business Decision Making Report: Data Analysis for Food for Friends UK
VerifiedAdded on 2020/06/06
|26
|4426
|47
Report
AI Summary
This report analyzes business decision-making for Food for Friends, a company planning a new venture in London. It covers primary and secondary data collection, including planning, sampling methods, and questionnaire design. The report uses statistical tools like mean, median, and mode to analyze data and draw conclusions. It includes the creation of charts, graphs, and trend lines for forecasting and business presentations. The assignment also explores information processing tools, critical path management, and financial tools to aid beneficial decision-making. The report culminates in a formal business report to senior authorities, providing a detailed analysis to support strategic business decisions for the company's expansion.

Business Decision Making
Paraphrase This Document
Need a fresh take? Get an instant paraphrase of this document with our AI Paraphraser
Table of Contents
INTRODUCTION...........................................................................................................................1
TASK 1............................................................................................................................................1
1. 1 Use of plan in collecting data through primary and secondary format...........................1
1.2 Use of sampling method and survey methodology..........................................................2
1.3 Use of questionnaire in relation to data............................................................................3
2.1 Creation of information on the basis of questionnaire.....................................................4
2.2 Use of mean, median and mode and its analysis..............................................................5
2.3 Analysis of data using measure of dispersion with including standard deviation............6
2.4 Benefits of quartile, percentile and correlation coefficient in business context...............7
TASK 2............................................................................................................................................8
3.1 Preparation of charts, graphs in making a valid conclusion.............................................8
3.2 Creation of trend lines in future forecasting...................................................................12
3.3 Business presentation.....................................................................................................14
3.4 Formation of formal business report to senior authority................................................14
TASK 3..........................................................................................................................................14
4.1 Information processing tools advantages to beneficial decision making.......................14
4.2 Formation of critical path management..........................................................................15
4.3 Benefits of financial tools in relation to make beneficial decision................................16
CONCLUSION..............................................................................................................................17
REFERENCES..............................................................................................................................19
INTRODUCTION
Making a good decision in a business is not a easy task and its success is only depend on
the right decision framing. It is an essential duty of management to gather appropriate
information directly from the market and use them for concluding a better and effective decision.
This factor have to take in account by the management and many organisation specially at that
time when they are going to start a new venture (Bhattacharya and et. al., 2015). London is one
of the most suitable place for starting any business new venture which enable in increasing more
and more profitability. This assignment is based on Food for Friends who want to start a new
business venture in UK. In this report, several more things are going to discussed and for taking
better decision management have to conduct a research which get done through questionnaire
method. Along with this, suitable range of data have to use for analysing whole result in an
appropriate manner. Use various graphs, charts enable in making effective decision making.
Along with this, for identifying feasibility of project use of various financial tool have to take in
account.
TASK 1
1. 1 Use of plan in collecting data through primary and secondary format
Plan is a framework which advice to do all the operations according to list. It comprise all
operations which are related with project so that better and effective outcome can be gain. Every
research require to work according in a plan format so that every project get done in an
appropriate manner. Food for friends wants to open another outlet in London for which they
want to identify taste and preferences of their users (Franks and et. al., 2013). Along with this,
they also have to gain information for locations which is best for opening restaurant. Plan for
collecting primary and secondary data is as below:
a) Primary data: Such data which are collected for a specific problem or a cause for the first
time is consider under primary data. Primary data is helpful in gaining view of various
individuals at one time through personal interaction. For collecting the primary source of data,
researcher of Food for friends have to follow a plan which support them in their long term
context:
Time duration for analysing this fact is of 40 days.
Budget provided for organising a investigation is about 12000 euro.
1
⊘ This is a preview!⊘
Do you want full access?
Subscribe today to unlock all pages.
Trusted by 1+ million students worldwide
Scope of research is high as this will support in long term context.
Risk of accurate data is high as this is based on personal interaction by questionnaire in
which sometimes people will not provide proper data (Gaillard, 2014). Random sampling method will be used for getting the opinion of various respondents.
b) Secondary data: Another data collection format which usually based on previous information
is secondary data. These are based on articles, books and journals so that interpretation of
information get done in appropriate manner. For collecting data through secondary sources, an
individual have to analyse financial statement of past few years and decision which taken by
management in their crucial time.
1.2 Use of sampling method and survey methodology
It is essential for an every research to select some sample for organise a research in an
appropriate manner. Researcher have to use sampling method through which it become easy to
select several respondent for the research (Hartman and et. al., 2014). There are several number
of sampling methodologies are identify which are as follow:
Random sampling
Cluster sampling
Stratified sampling
Survey methodology is stated as technique which used to conduct it in an adequate manner. For
this research, simple random sampling has been used which will conduct on 78 respondents of
the users of a restaurant. There are various appropriate tools analyse which support in conducting
a research in a proper format.
Survey monkey
Social media
Questionnaire
For this decision making process and making it more population influence questionnaire
methodology will going to use. It aid in take opinion of various people and identify interest of
group (Kahraman and et. al., 2015).
1.3 Use of questionnaire in relation to data
Questionnaire is a helpful measure which enable in gathering of data from various
number of people at one time. There are various kind of questionnaire are used by a researcher
like grouped, un -grouped, open ended, close ended and many more. For this investigation, every
2
Paraphrase This Document
Need a fresh take? Get an instant paraphrase of this document with our AI Paraphraser
sort of questions are included in this which support in gaining more faithful outcome which is
helpful in taking beneficial decision (Mardani and et. al., 2014).
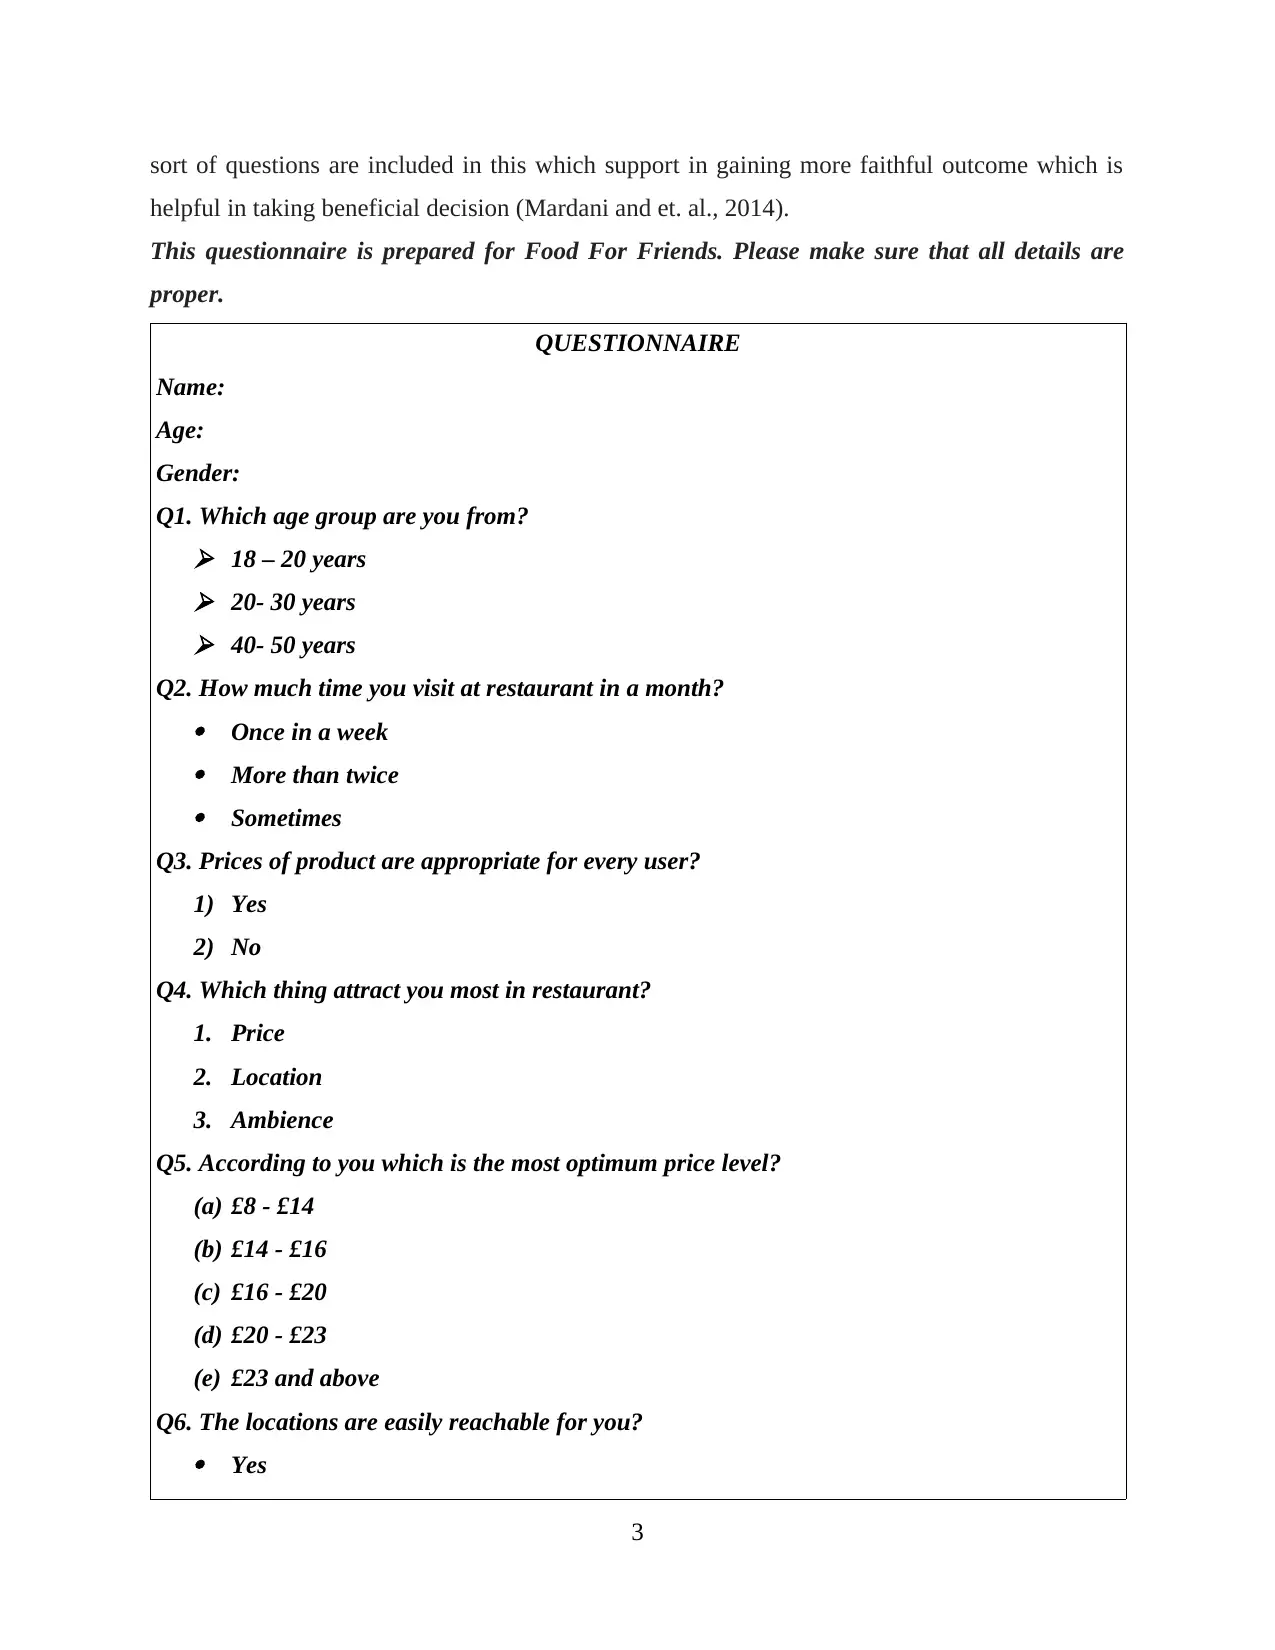
This questionnaire is prepared for Food For Friends. Please make sure that all details are
proper.
QUESTIONNAIRE
Name:
Age:
Gender:
Q1. Which age group are you from? 18 – 20 years 20- 30 years 40- 50 years
Q2. How much time you visit at restaurant in a month? Once in a week More than twice Sometimes
Q3. Prices of product are appropriate for every user?
1) Yes
2) No
Q4. Which thing attract you most in restaurant?
1. Price
2. Location
3. Ambience
Q5. According to you which is the most optimum price level?
(a) £8 - £14
(b) £14 - £16
(c) £16 - £20
(d) £20 - £23
(e) £23 and above
Q6. The locations are easily reachable for you? Yes
3
helpful in taking beneficial decision (Mardani and et. al., 2014).
This questionnaire is prepared for Food For Friends. Please make sure that all details are
proper.
QUESTIONNAIRE
Name:
Age:
Gender:
Q1. Which age group are you from? 18 – 20 years 20- 30 years 40- 50 years
Q2. How much time you visit at restaurant in a month? Once in a week More than twice Sometimes
Q3. Prices of product are appropriate for every user?
1) Yes
2) No
Q4. Which thing attract you most in restaurant?
1. Price
2. Location
3. Ambience
Q5. According to you which is the most optimum price level?
(a) £8 - £14
(b) £14 - £16
(c) £16 - £20
(d) £20 - £23
(e) £23 and above
Q6. The locations are easily reachable for you? Yes
3
No
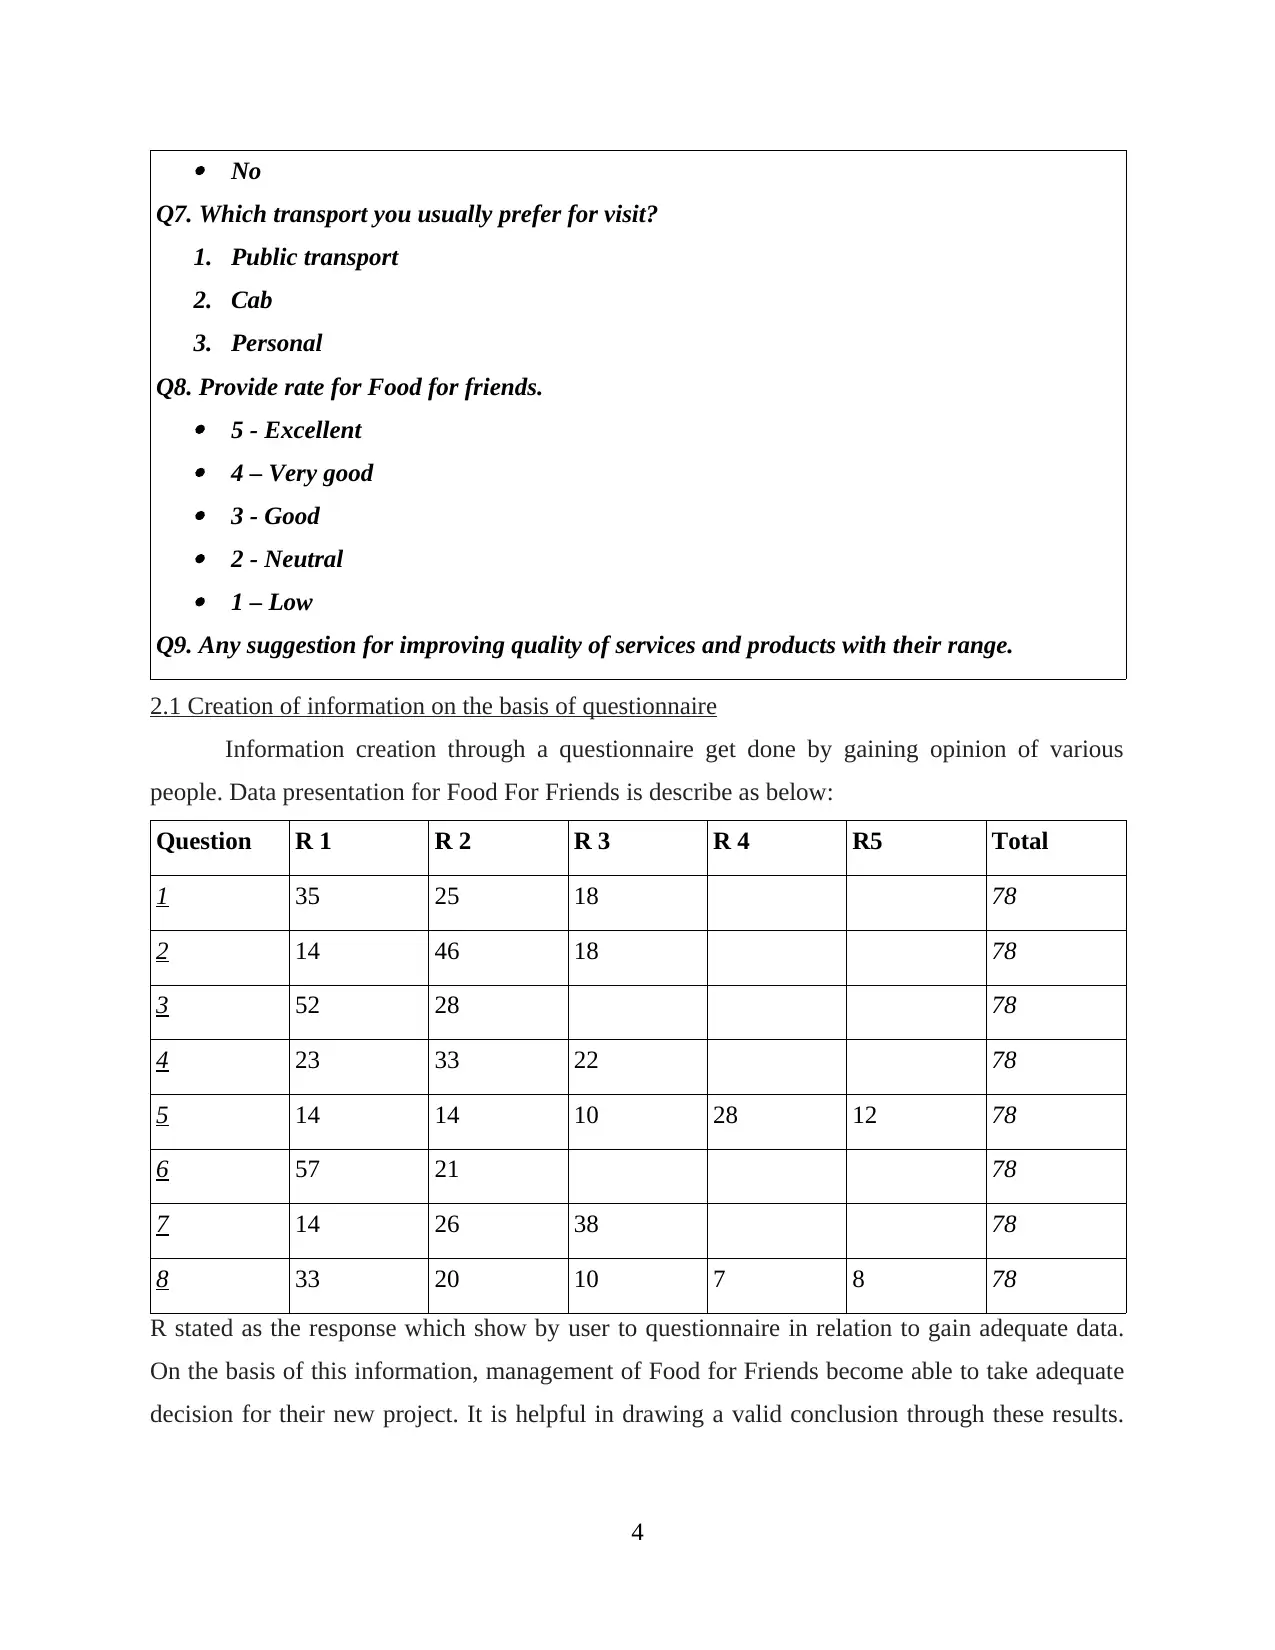
Q7. Which transport you usually prefer for visit?
1. Public transport
2. Cab
3. Personal
Q8. Provide rate for Food for friends. 5 - Excellent 4 – Very good 3 - Good 2 - Neutral 1 – Low
Q9. Any suggestion for improving quality of services and products with their range.
2.1 Creation of information on the basis of questionnaire
Information creation through a questionnaire get done by gaining opinion of various
people. Data presentation for Food For Friends is describe as below:
Question R 1 R 2 R 3 R 4 R5 Total
1 35 25 18 78
2 14 46 18 78
3 52 28 78
4 23 33 22 78
5 14 14 10 28 12 78
6 57 21 78
7 14 26 38 78
8 33 20 10 7 8 78
R stated as the response which show by user to questionnaire in relation to gain adequate data.
On the basis of this information, management of Food for Friends become able to take adequate
decision for their new project. It is helpful in drawing a valid conclusion through these results.
4
⊘ This is a preview!⊘
Do you want full access?
Subscribe today to unlock all pages.
Trusted by 1+ million students worldwide
Thus, management have to keep their keen focus on these results and then make healthy
discussion with their managers as well.
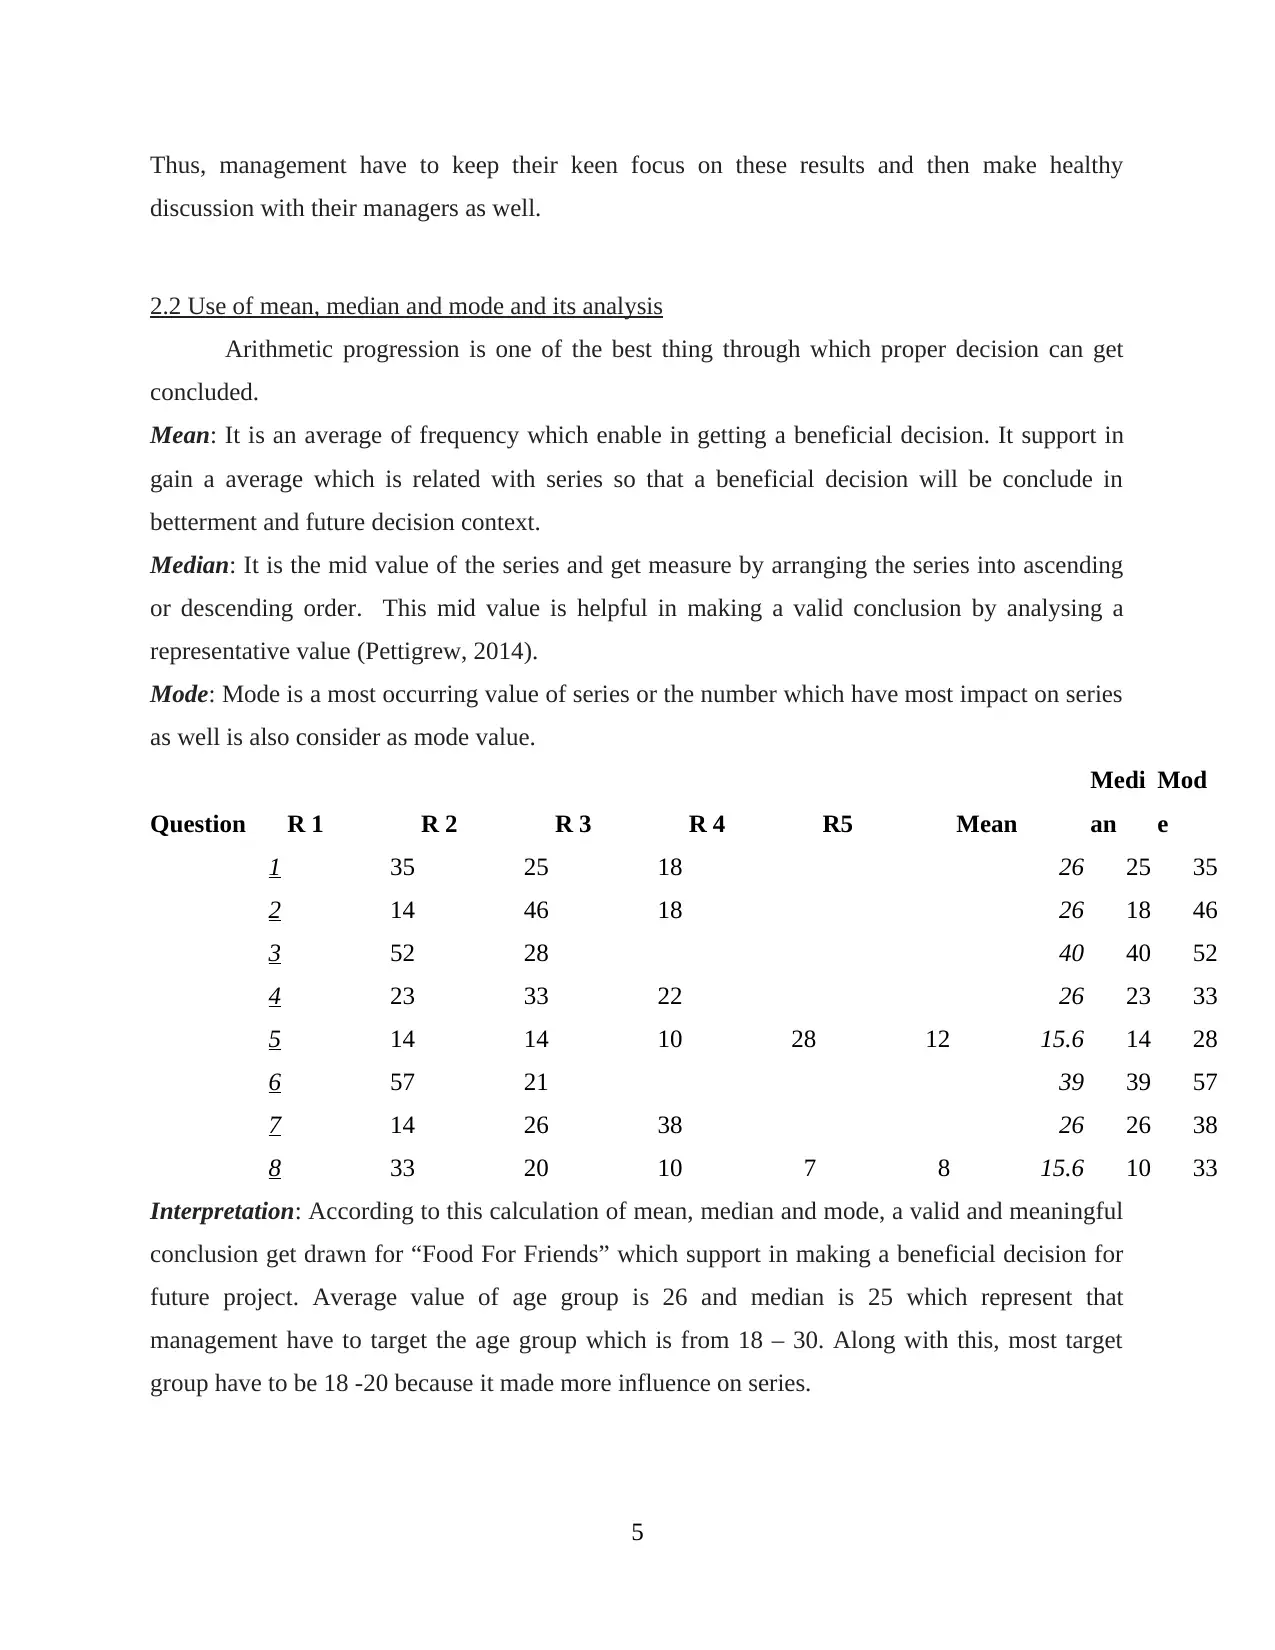
2.2 Use of mean, median and mode and its analysis
Arithmetic progression is one of the best thing through which proper decision can get
concluded.
Mean: It is an average of frequency which enable in getting a beneficial decision. It support in
gain a average which is related with series so that a beneficial decision will be conclude in
betterment and future decision context.
Median: It is the mid value of the series and get measure by arranging the series into ascending
or descending order. This mid value is helpful in making a valid conclusion by analysing a
representative value (Pettigrew, 2014).
Mode: Mode is a most occurring value of series or the number which have most impact on series
as well is also consider as mode value.
Question R 1 R 2 R 3 R 4 R5 Mean
Medi
an
Mod
e
1 35 25 18 26 25 35
2 14 46 18 26 18 46
3 52 28 40 40 52
4 23 33 22 26 23 33
5 14 14 10 28 12 15.6 14 28
6 57 21 39 39 57
7 14 26 38 26 26 38
8 33 20 10 7 8 15.6 10 33
Interpretation: According to this calculation of mean, median and mode, a valid and meaningful
conclusion get drawn for “Food For Friends” which support in making a beneficial decision for
future project. Average value of age group is 26 and median is 25 which represent that
management have to target the age group which is from 18 – 30. Along with this, most target
group have to be 18 -20 because it made more influence on series.
5
discussion with their managers as well.
2.2 Use of mean, median and mode and its analysis
Arithmetic progression is one of the best thing through which proper decision can get
concluded.
Mean: It is an average of frequency which enable in getting a beneficial decision. It support in
gain a average which is related with series so that a beneficial decision will be conclude in
betterment and future decision context.
Median: It is the mid value of the series and get measure by arranging the series into ascending
or descending order. This mid value is helpful in making a valid conclusion by analysing a
representative value (Pettigrew, 2014).
Mode: Mode is a most occurring value of series or the number which have most impact on series
as well is also consider as mode value.
Question R 1 R 2 R 3 R 4 R5 Mean
Medi
an
Mod
e
1 35 25 18 26 25 35
2 14 46 18 26 18 46
3 52 28 40 40 52
4 23 33 22 26 23 33
5 14 14 10 28 12 15.6 14 28
6 57 21 39 39 57
7 14 26 38 26 26 38
8 33 20 10 7 8 15.6 10 33
Interpretation: According to this calculation of mean, median and mode, a valid and meaningful
conclusion get drawn for “Food For Friends” which support in making a beneficial decision for
future project. Average value of age group is 26 and median is 25 which represent that
management have to target the age group which is from 18 – 30. Along with this, most target
group have to be 18 -20 because it made more influence on series.
5
Paraphrase This Document
Need a fresh take? Get an instant paraphrase of this document with our AI Paraphraser
Along with this, another major thing for Food for friends is their location according to
most number of respondents. This get analyse through mode value of series but as per average
and median value, price is another major thing for business in relation to attract many people.
As according to audience perspective it get analyse that the price level at new restaurant
have to be in between £20 - £23. This is most attractive and adequate price level which really
want many users. This will support in increasing their users at outlet by performing all things as
per user demand and requirement.
2.3 Analysis of data using measure of dispersion with including standard deviation
Sometimes few values are getting cluster around mean frequency of series, these cluster
things or facts are stated as variations which get underlay by making differentiation in two sets
series as well which is mean and median.
Along with this, another major measure of dispersion is standard deviation which is a
most commonly used measure of viability. It is helpful in estimating the mid point from mean
and median. This can get calculated with the help of mean deviation and variances. Standard
deviation is helpful measure which support in analyse the far value of an individual with mean
value.
Questio
n R 1 R 2 R 3 R 4 R5 Mean Median Standard deviation
1 35 25 18 26 25 8.5440
2 14 46 18 26 18 17.4355
3 52 28 40 40 16.9705
4 23 33 22 26 23 6.0827
5 14 14 10 28 12 15.6 14 7.1274
6 57 21 39 39 25.4558
7 14 26 38 26 26
8 33 20 10 7 8 15.6 10 11.0136
Standard deviation is a difference between the centre point or mid value with mean frequency.
This have to take in account by Food for Friends while taking any beneficial decision for future
context. Difference between the mean value and standard deviation is 8 which signifies that
organisation have to take some essential step in this context. Along with this, the perfect relation
also get measure in between some values of the series. Individual value according to frequency is
6
14 and 15.6 and deviation arise of 7.12 which is a mean distribution of series. Thus, management
have to take all these things in account and take appropriate decision aid in gaining strength at
keen competitive market world.
2.4 Benefits of quartile, percentile and correlation coefficient in business context
Several other important tools which are helpful in better and effective decision making is
quartile, percentile and correlation coefficient. These all enable an organisation to make
appropriate decision and adopt suitable improvement methods for effective working as well.
These three are also been a part of measure of dispersion which enable in making scatter values
of the series for better decision making. Quartile: Identification of most of range values which occur in population is stated as the
process of quartile. There are four major parts a quartile have which are Q1, Q2, and Q3
which divide data into four groups (Rosemann and vom Brocke, 2015). Percentile: In gaining the result in percentage form is describe as percentile method of
decision making.
Correlation Coefficient: Relation between two series signifies the appropriateness of
data. It enable in identifying the scatter of frequency values through which proper work
get done. It is essential for every researcher to analyse correlation coefficient value of
series so that appropriate actions can be carried down (Tools Used to Process
Information, 2017).
Food for Friends have to take these tool in account and then take appropriate decision for their
further future project. It enable to management for making a valid and meaningful conclusion
and action for the same (Shepherd and et. al., 2012).
For this series, quartile, percentile and correlation coefficient are calculated by taking two
series in account whom have similar frequency.
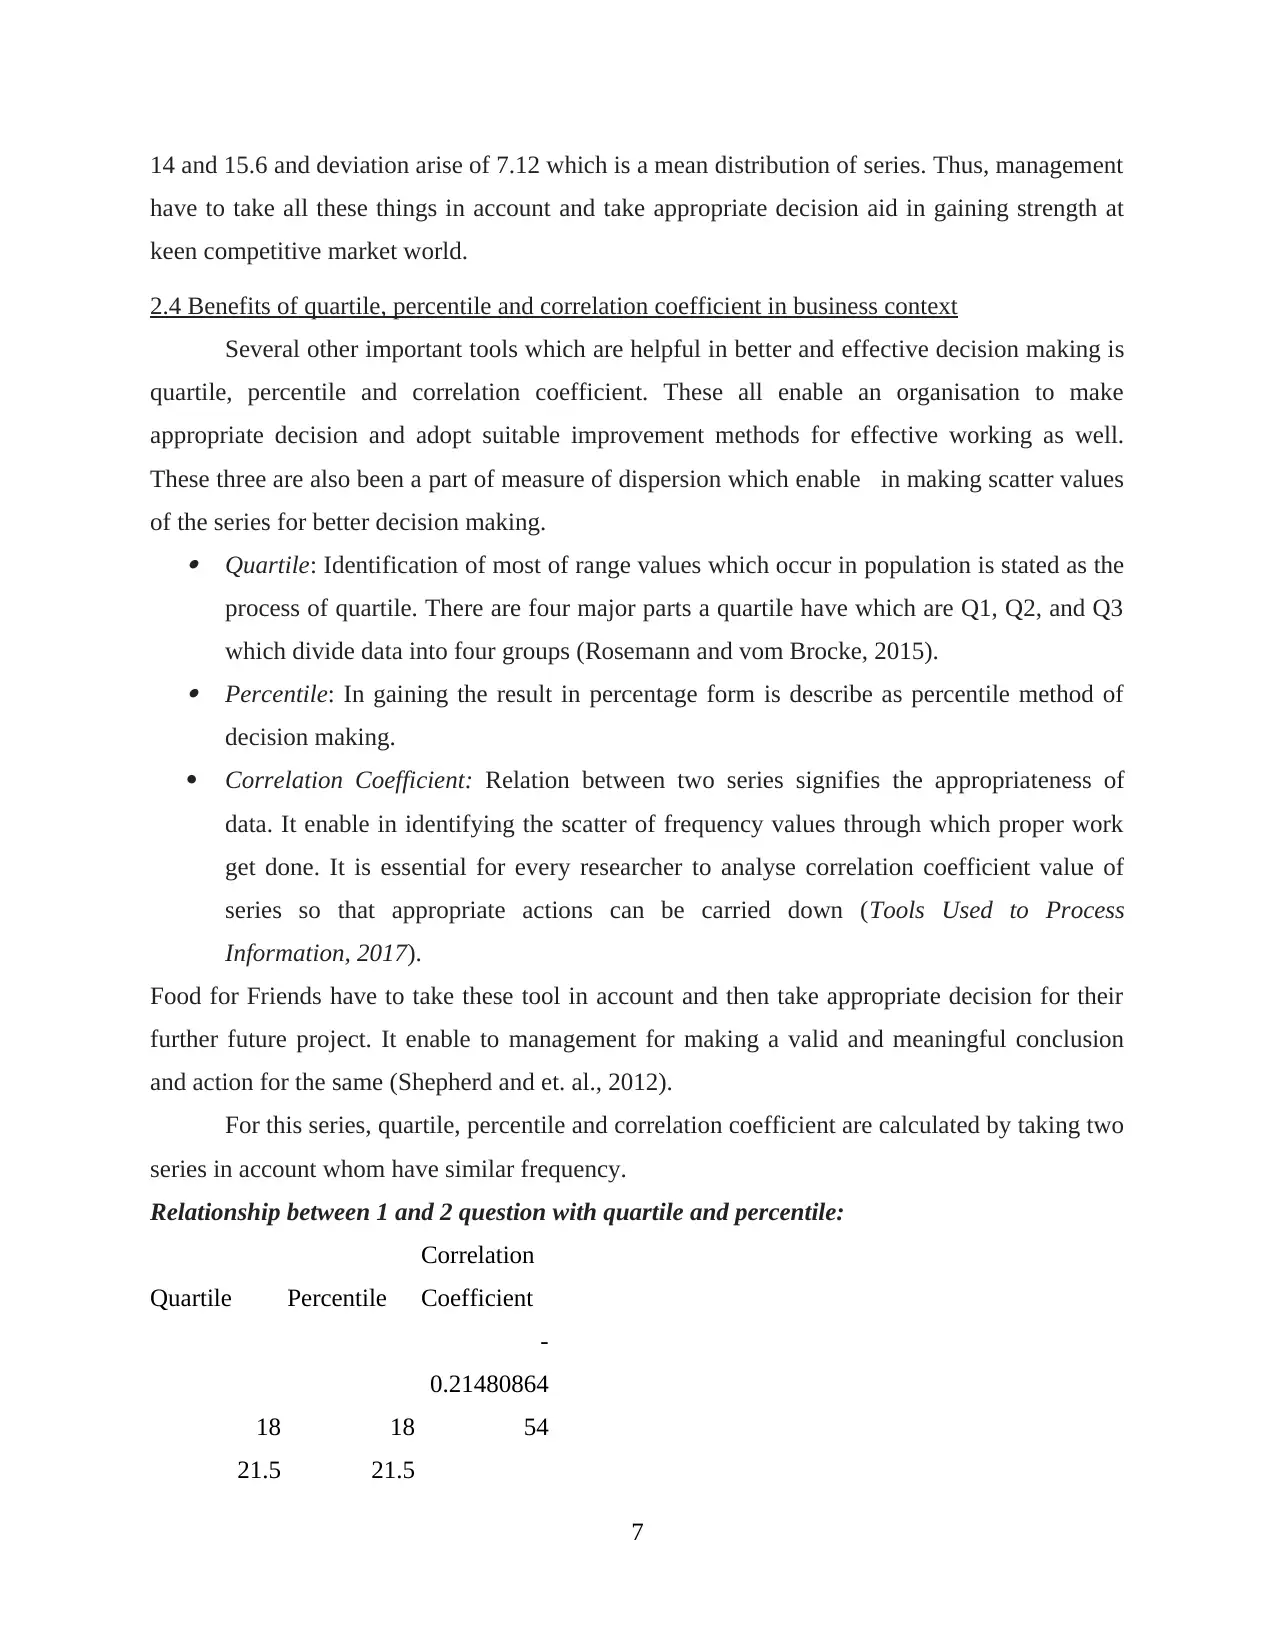
Relationship between 1 and 2 question with quartile and percentile:
Quartile Percentile
Correlation
Coefficient
18 18
-
0.21480864
54
21.5 21.5
7
have to take all these things in account and take appropriate decision aid in gaining strength at
keen competitive market world.
2.4 Benefits of quartile, percentile and correlation coefficient in business context
Several other important tools which are helpful in better and effective decision making is
quartile, percentile and correlation coefficient. These all enable an organisation to make
appropriate decision and adopt suitable improvement methods for effective working as well.
These three are also been a part of measure of dispersion which enable in making scatter values
of the series for better decision making. Quartile: Identification of most of range values which occur in population is stated as the
process of quartile. There are four major parts a quartile have which are Q1, Q2, and Q3
which divide data into four groups (Rosemann and vom Brocke, 2015). Percentile: In gaining the result in percentage form is describe as percentile method of
decision making.
Correlation Coefficient: Relation between two series signifies the appropriateness of
data. It enable in identifying the scatter of frequency values through which proper work
get done. It is essential for every researcher to analyse correlation coefficient value of
series so that appropriate actions can be carried down (Tools Used to Process
Information, 2017).
Food for Friends have to take these tool in account and then take appropriate decision for their
further future project. It enable to management for making a valid and meaningful conclusion
and action for the same (Shepherd and et. al., 2012).
For this series, quartile, percentile and correlation coefficient are calculated by taking two
series in account whom have similar frequency.
Relationship between 1 and 2 question with quartile and percentile:
Quartile Percentile
Correlation
Coefficient
18 18
-
0.21480864
54
21.5 21.5
7
⊘ This is a preview!⊘
Do you want full access?
Subscribe today to unlock all pages.
Trusted by 1+ million students worldwide
32.5
28.3333333
333
46 46
Interpretation: Series have negative relationship in nature which signifies that management does
not require to work on them properly. It is essential to take some steps in improving the quality
of services. As management have to target the age group which belong to level of 18 – 20 years.
Relationship between 3 and 6 with quartile and percentile:
Quartile Percentile
Correlation
Coefficient
26.25 26.25 1
40 40
53.25 52
57 57
Interpretation: A perfect relationship get derive between the series of question 3 and question 6
which signifies that rates and locations of product both are adequate in nature.
TASK 2
3.1 Preparation of charts, graphs in making a valid conclusion
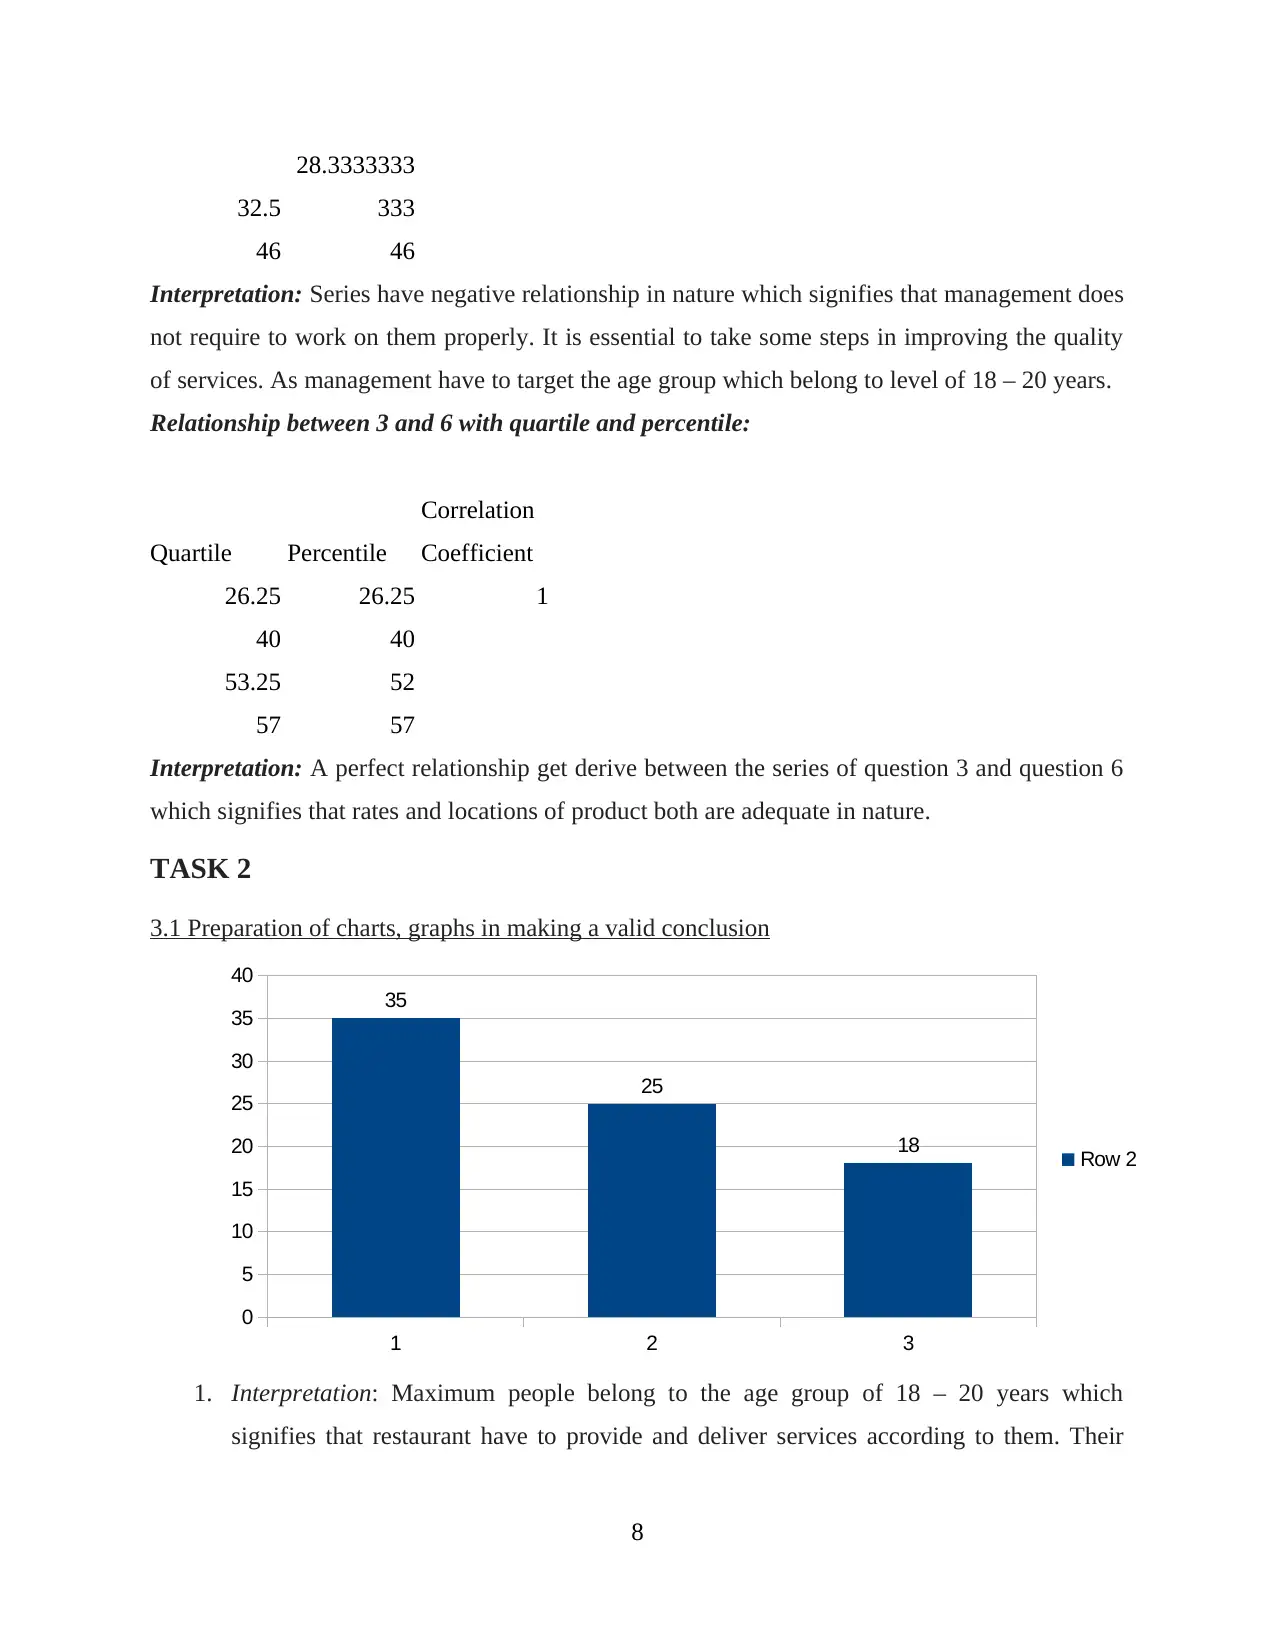
1. Interpretation: Maximum people belong to the age group of 18 – 20 years which
signifies that restaurant have to provide and deliver services according to them. Their
8
1 2 3
0
5
10
15
20
25
30
35
40
35
25
18 Row 2
28.3333333
333
46 46
Interpretation: Series have negative relationship in nature which signifies that management does
not require to work on them properly. It is essential to take some steps in improving the quality
of services. As management have to target the age group which belong to level of 18 – 20 years.
Relationship between 3 and 6 with quartile and percentile:
Quartile Percentile
Correlation
Coefficient
26.25 26.25 1
40 40
53.25 52
57 57
Interpretation: A perfect relationship get derive between the series of question 3 and question 6
which signifies that rates and locations of product both are adequate in nature.
TASK 2
3.1 Preparation of charts, graphs in making a valid conclusion
1. Interpretation: Maximum people belong to the age group of 18 – 20 years which
signifies that restaurant have to provide and deliver services according to them. Their
8
1 2 3
0
5
10
15
20
25
30
35
40
35
25
18 Row 2
Paraphrase This Document
Need a fresh take? Get an instant paraphrase of this document with our AI Paraphraser
target market has been identified and thus it is their responsibility to deliver quality
based services.
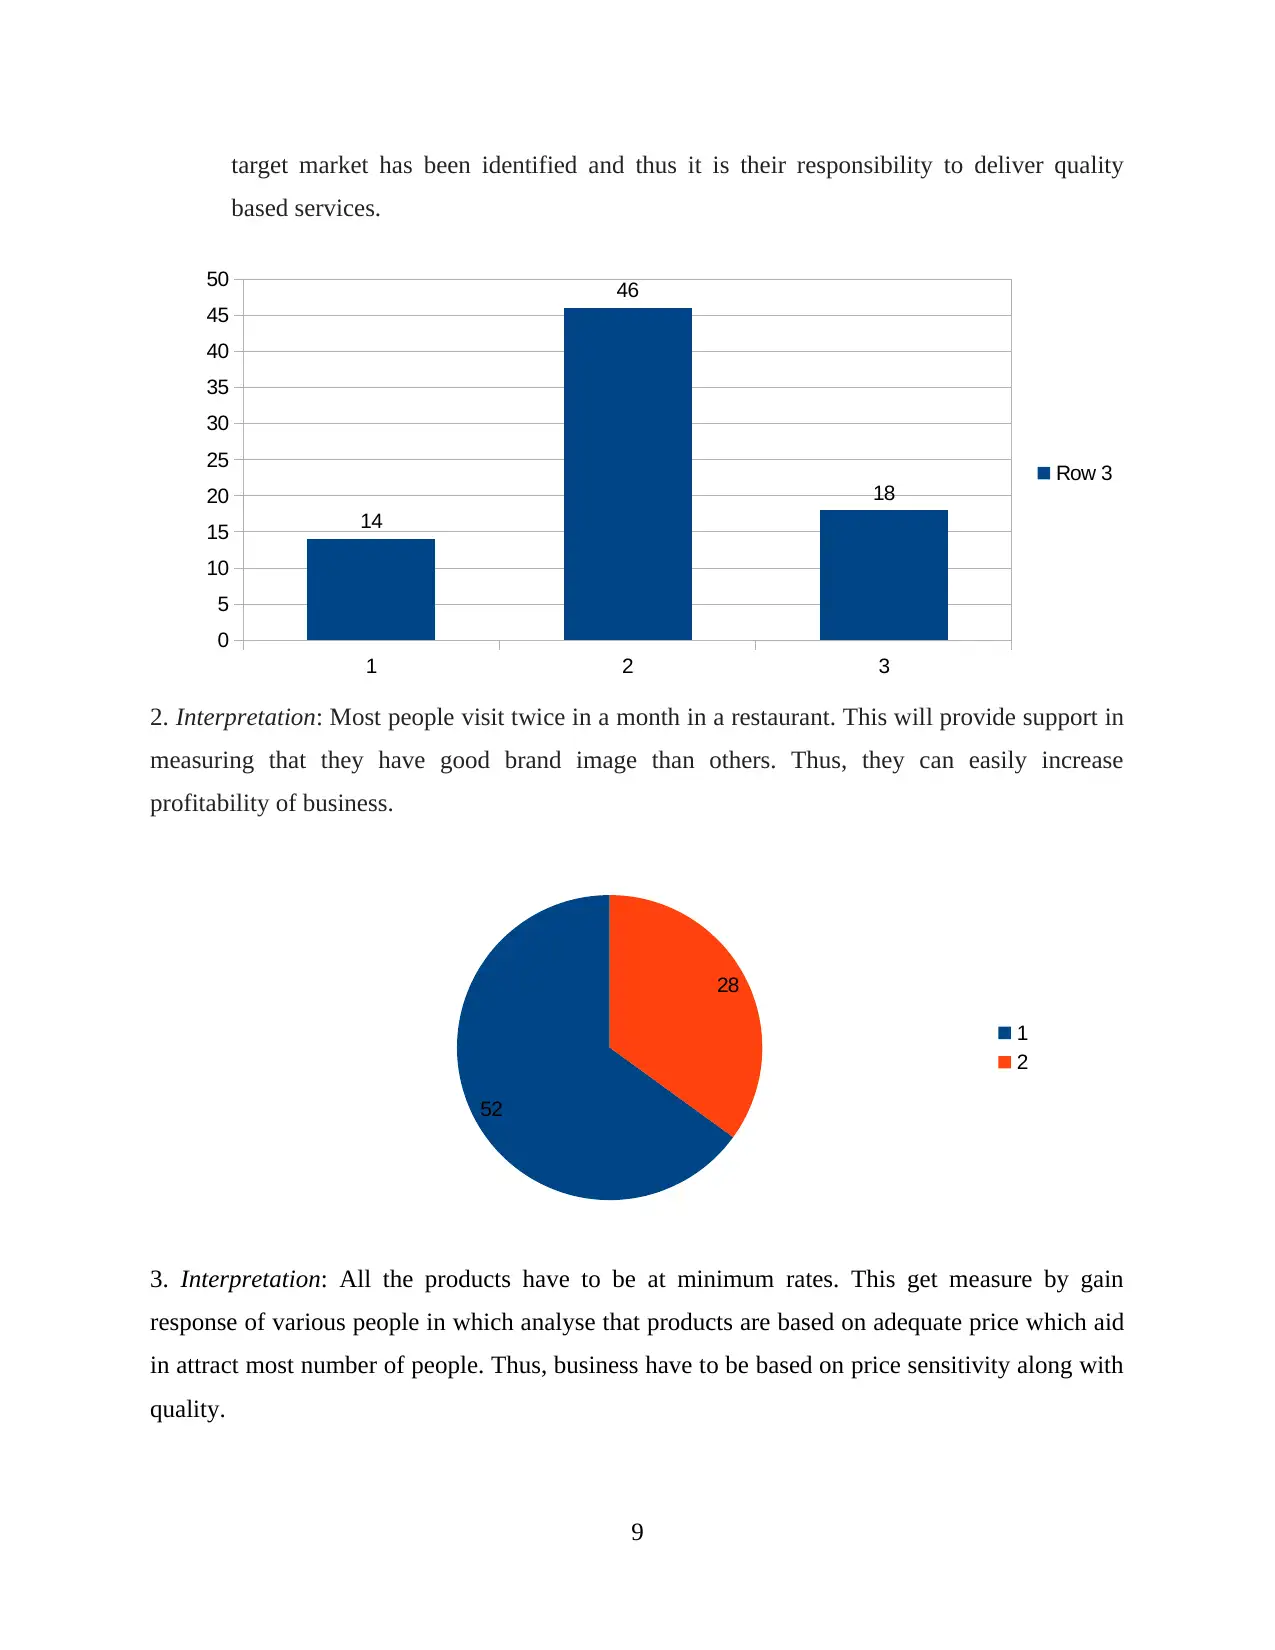
2. Interpretation: Most people visit twice in a month in a restaurant. This will provide support in
measuring that they have good brand image than others. Thus, they can easily increase
profitability of business.
3. Interpretation: All the products have to be at minimum rates. This get measure by gain
response of various people in which analyse that products are based on adequate price which aid
in attract most number of people. Thus, business have to be based on price sensitivity along with
quality.
9
1 2 3
0
5
10
15
20
25
30
35
40
45
50
14
46
18 Row 3
52
28
1
2
based services.
2. Interpretation: Most people visit twice in a month in a restaurant. This will provide support in
measuring that they have good brand image than others. Thus, they can easily increase
profitability of business.
3. Interpretation: All the products have to be at minimum rates. This get measure by gain
response of various people in which analyse that products are based on adequate price which aid
in attract most number of people. Thus, business have to be based on price sensitivity along with
quality.
9
1 2 3
0
5
10
15
20
25
30
35
40
45
50
14
46
18 Row 3
52
28
1
2
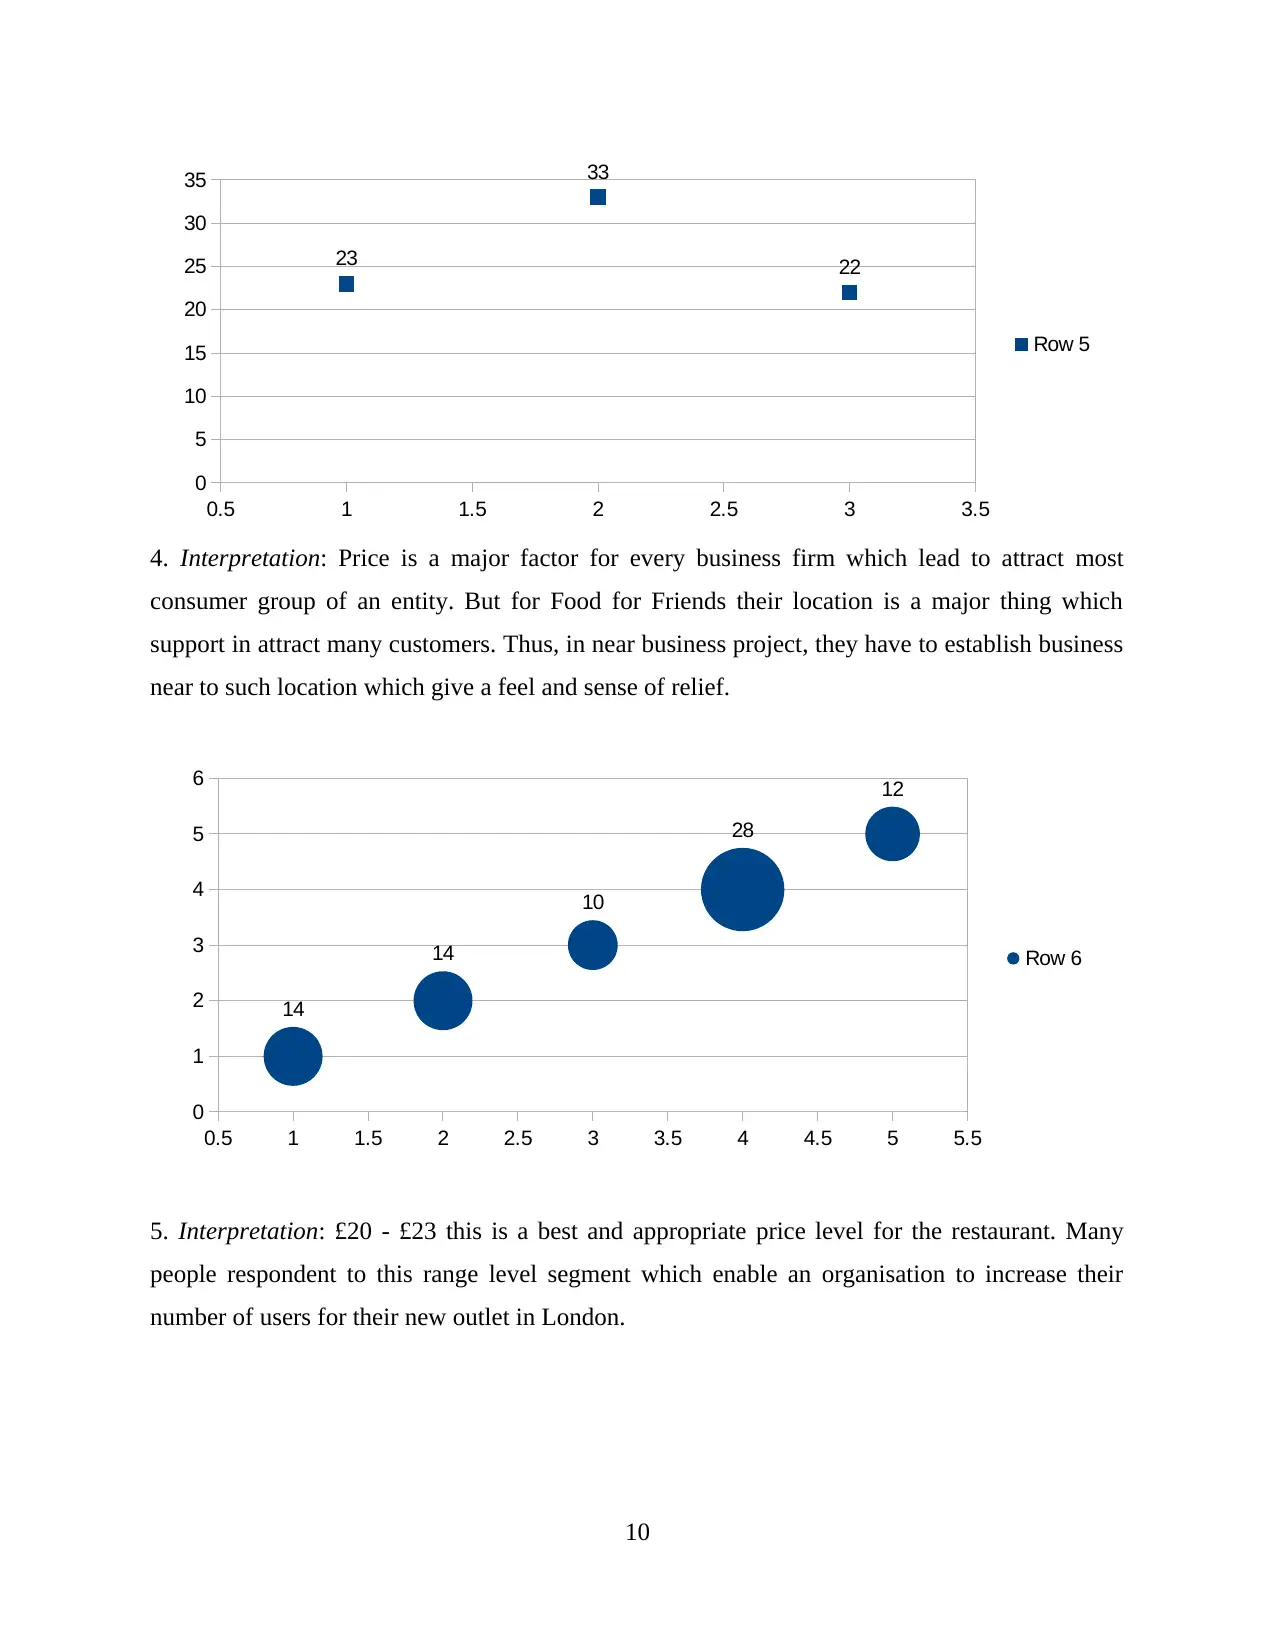
4. Interpretation: Price is a major factor for every business firm which lead to attract most
consumer group of an entity. But for Food for Friends their location is a major thing which
support in attract many customers. Thus, in near business project, they have to establish business
near to such location which give a feel and sense of relief.
5. Interpretation: £20 - £23 this is a best and appropriate price level for the restaurant. Many
people respondent to this range level segment which enable an organisation to increase their
number of users for their new outlet in London.
10
0.5 1 1.5 2 2.5 3 3.5
0
5
10
15
20
25
30
35
23
33
22
Row 5
0.5 1 1.5 2 2.5 3 3.5 4 4.5 5 5.5
0
1
2
3
4
5
6
14
14
10
28
12
Row 6
⊘ This is a preview!⊘
Do you want full access?
Subscribe today to unlock all pages.
Trusted by 1+ million students worldwide
1 out of 26
Related Documents


Your All-in-One AI-Powered Toolkit for Academic Success.
+13062052269
info@desklib.com
Available 24*7 on WhatsApp / Email
![[object Object]](/_next/static/media/star-bottom.7253800d.svg)
Unlock your academic potential
Copyright © 2020–2026 A2Z Services. All Rights Reserved. Developed and managed by ZUCOL.