Business Decision Making: Sainsbury's Customer Shopping Habits Report

Verified

Added on  2020/12/10

|24
|4246
|172
Report
AI Summary
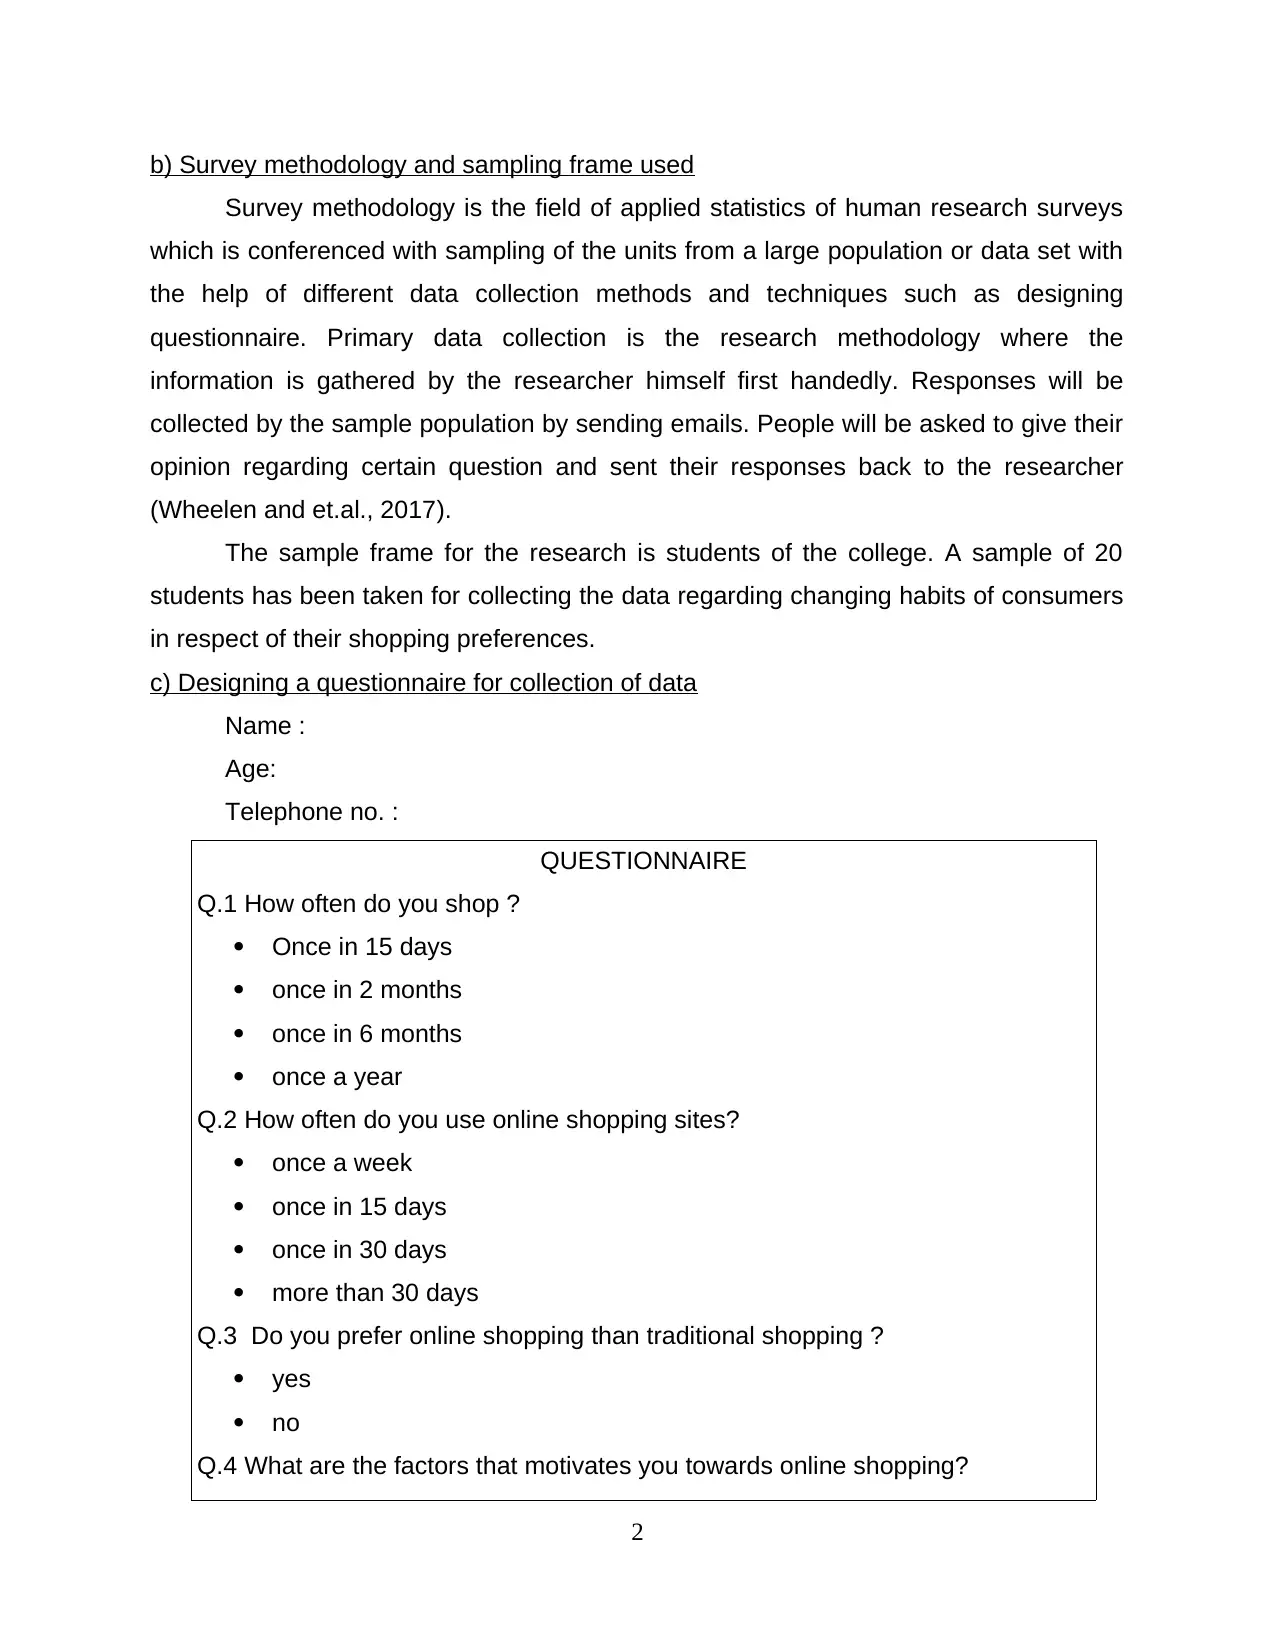
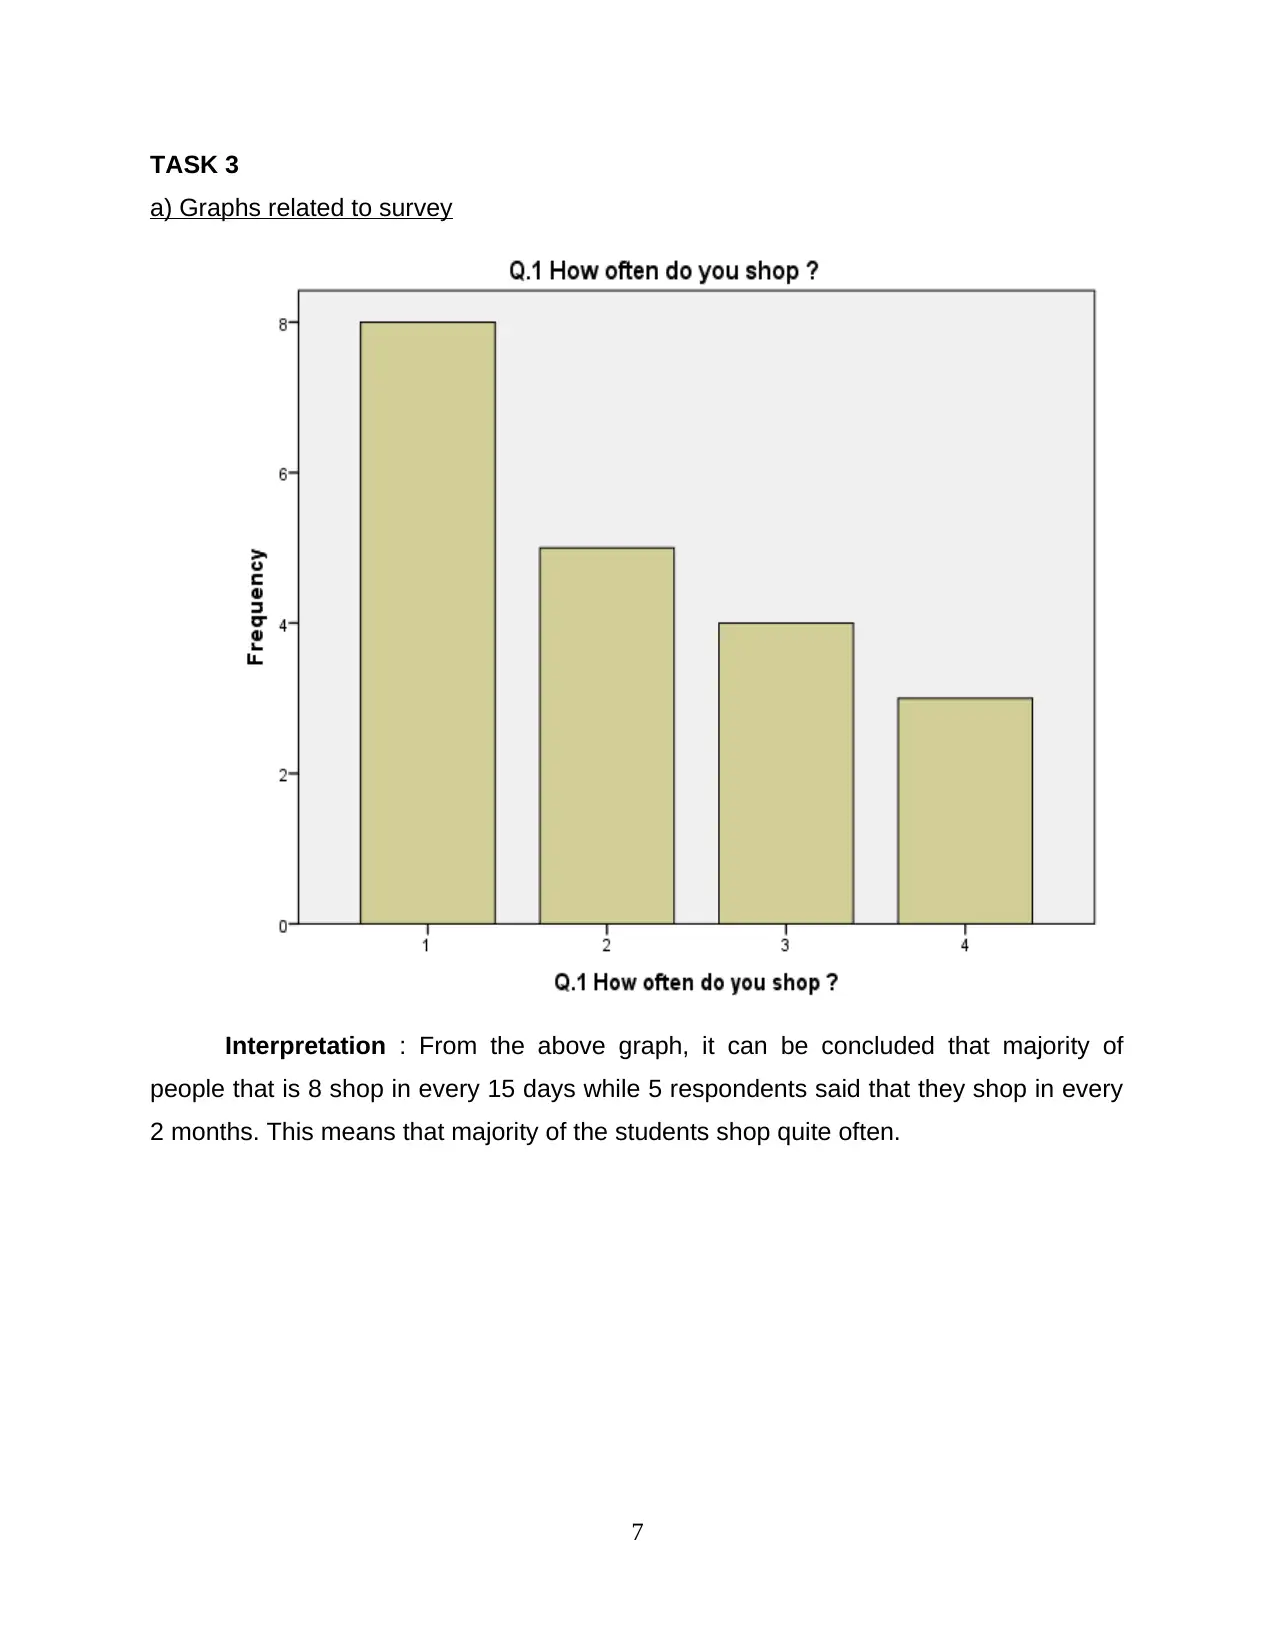
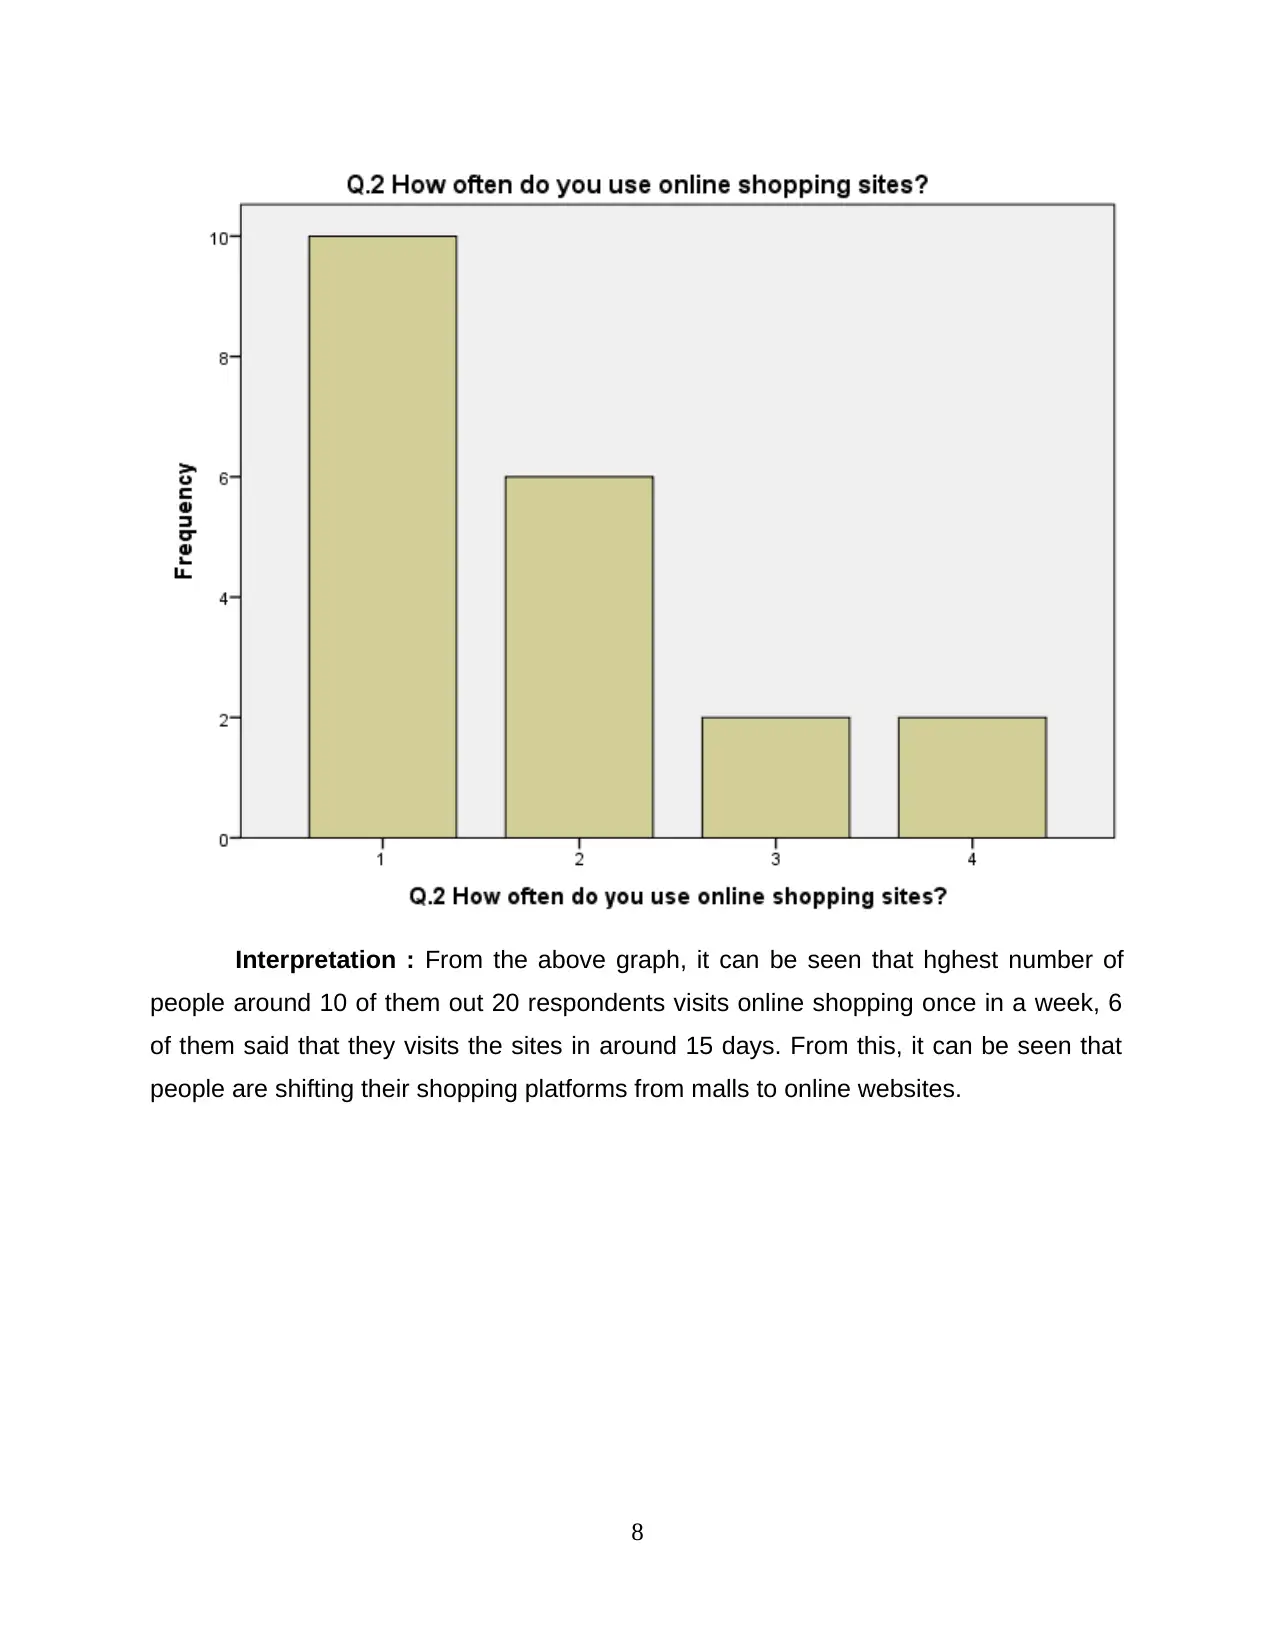
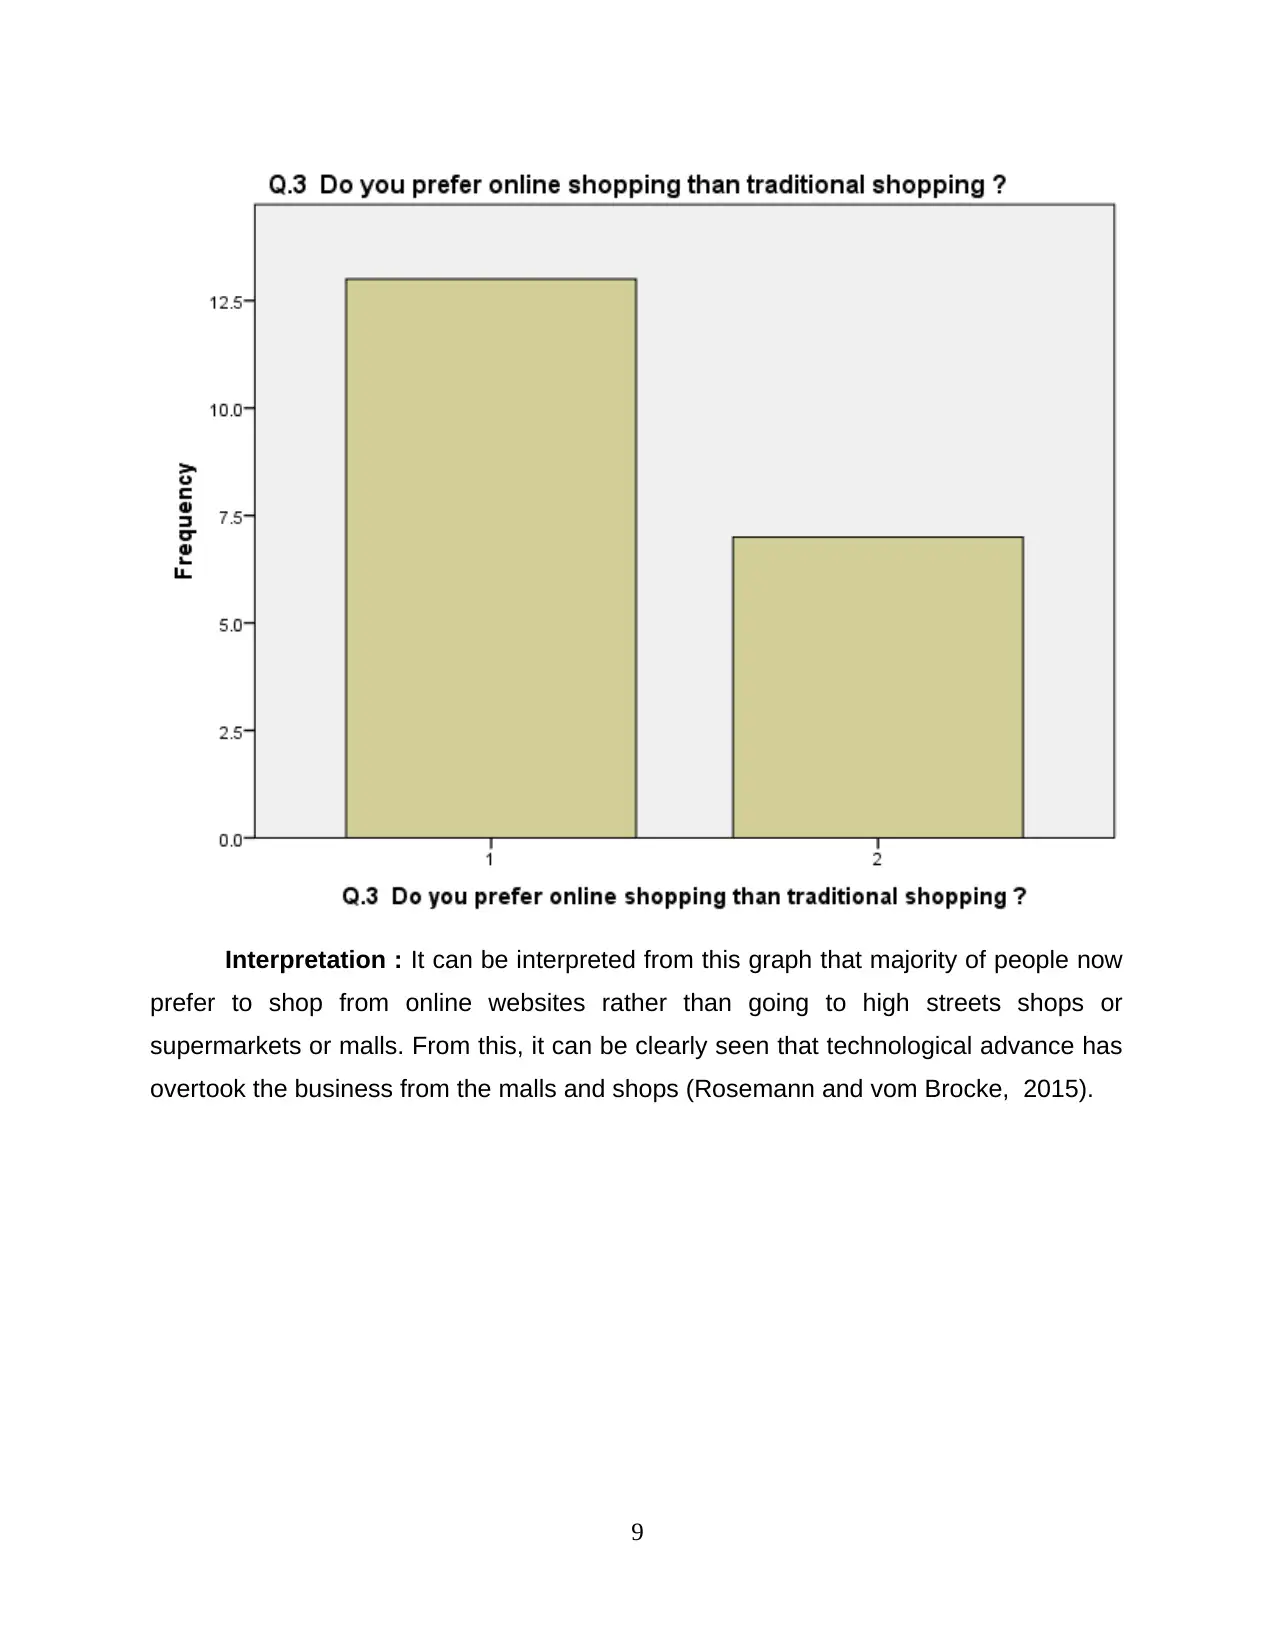
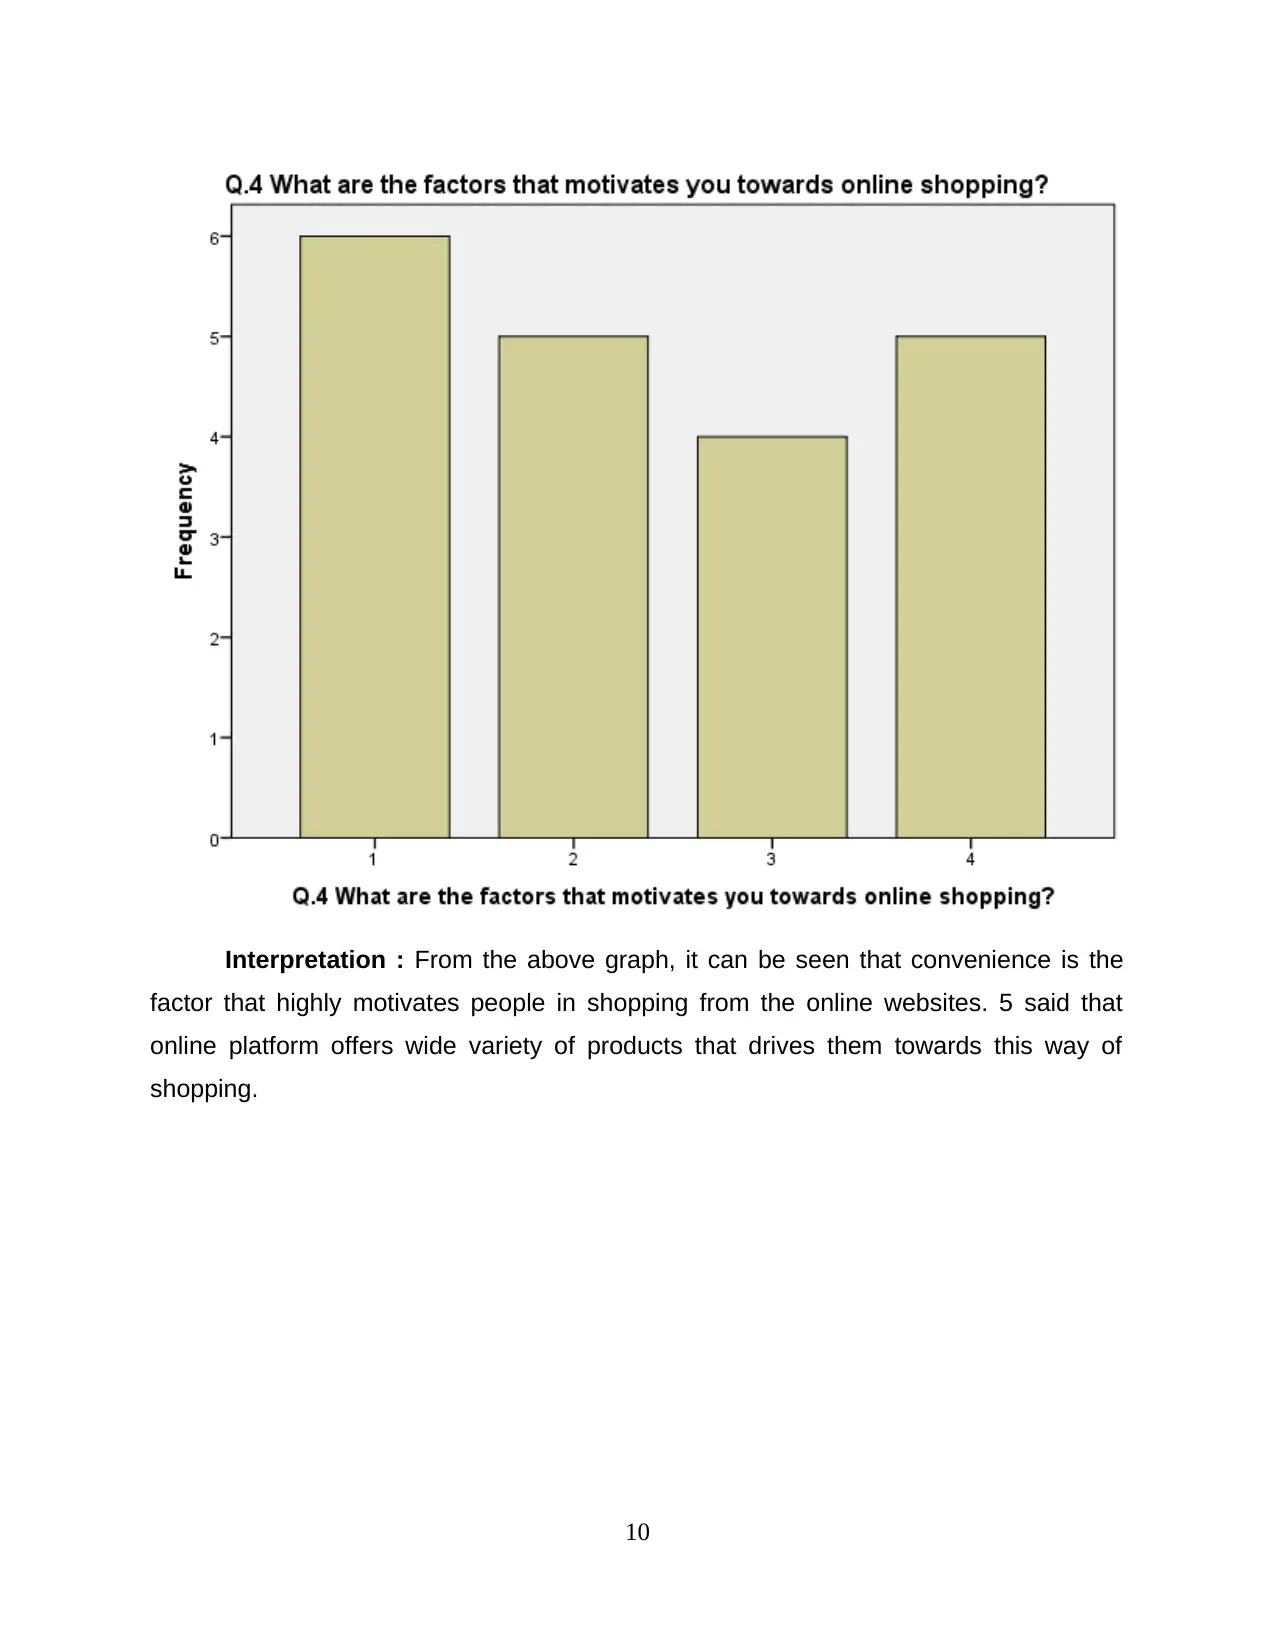
This report delves into the critical function of business decision-making within Sainsbury's, a UK supermarket retailer. It examines changing customer shopping habits and preferences through primary and secondary research. Task 1 focuses on planning data collection via questionnaires, survey methodology, and sampling frames, along with questionnaire design. Task 2 involves summarizing and analyzing collected data, including measures of dispersion, quartiles, percentiles, and the correlation coefficient to draw conclusions about shopping trends. Task 3 presents the data through graphs, trend lines, and a poster presentation, culminating in a formal report suitable for publication. Finally, Task 4 explores software tools that aid decision-making, including network diagrams, critical path analysis, and the use of financial tools like NPV and IRR calculations to advise on project investments. The report provides a comprehensive overview of the research process and findings related to consumer behavior and its impact on business decisions.
Document Page
BUSINESS DECISION MAKING
tabler-icon-diamond-filled.svg

Paraphrase This Document

Need a fresh take? Get an instant paraphrase of this document with our AI Paraphraser
Document Page
Table of Contents
INTRODUCTION..............................................................................................................1
TASK 1 ............................................................................................................................ 1
a) Planning for data collection .....................................................................................1
b) Survey methodology and sampling frame used........................................................1
c) Designing a questionnaire for collection of data.......................................................2
TASK 2.............................................................................................................................3
a) Summarising the data collected data ......................................................................3
b) Analysing results of survey and drawing conclusion................................................5
c) Analysing the data using measures of dispersion.....................................................6
d) Using quartiles, percentiles and the correlation coefficient for drawing conclusion . 6
TASK 3 ............................................................................................................................ 7
a) Graphs related to survey..........................................................................................7
......................................................................................................................................9
....................................................................................................................................10
....................................................................................................................................11
....................................................................................................................................12
b) Creating trend lines................................................................................................ 12
c) Poster presentation.................................................................................................13
d) Formal report for publication in Retails Times Magazines......................................13
TASK 4........................................................................................................................... 13
a) Different software that helps in decision making ...................................................13
b) Network diagram and the critical path ...................................................................15
c) Using a financial tool for decision making, advising a business planning on a
project or investment.................................................................................................. 17
d) Calculation of NPV................................................................................................. 17
e) Calculating IRR ......................................................................................................18
CONCLUSION............................................................................................................... 18
REFERENCES...............................................................................................................20
Document Page
INTRODUCTION
Business decision making is one of the crucial function of management of a
company. As the term is concerned with a business problem, an effective decision
making assist an organization in attaining its expected goals and objectives (Janeiro,
2018). Business decision making can be described as a scientific well defined and tried
process of choosing the best course of action from amongst different alternatives after
detailed evaluation and analysis to reach at a solution. The present project report is
about the primary and secondary research undertaken by Sainsbury, a supermarket
retailer in UK, regarding how the customers are changing their shopping habits and
preferences, determining what are the underlying factors which are motivating
customers to change their habits. Further, the role of socio-impact and shopping
platforms in customers' changing preferences.
TASK 1
a) Planning for data collection
Data collection is the process of assembling or capturing and measuring data so
that appropriate information from all the possible relevant sources to find answers to the
issues included in research. It also includes testing hypothesis and evaluating the
outcomes. Data can be both qualitative and quantitative (IJdens, 2015.).
For the research purpose, Sainsbury will collect data by the way of
questionnaire that will put up some questions for the intended sample population to
answer them. The questionnaire will start with the general questions like how often do
you shop, where do you like to shop like from mall, super market, online shopping or
traditional shop. What are the factors that has led you to shop from online method, does
socio economic factor impacts your purchasing decision, is brand loyalty the reason for
the change in habits etc.
Sampling is the process in which a preset number of observations are taken out
of large sample population. In this research, the sample population is 20 which
comprises of college students. For rating the answers of the respondents, ordinal scale
of rating will be used such as when a question of purchasing preference is asked, option
will be given in the form of online, traditional shops, supermarket etc (DEMİRGÜNEŞ,
2016).
1
Document Page
b) Survey methodology and sampling frame used
Survey methodology is the field of applied statistics of human research surveys
which is conferenced with sampling of the units from a large population or data set with
the help of different data collection methods and techniques such as designing
questionnaire. Primary data collection is the research methodology where the
information is gathered by the researcher himself first handedly. Responses will be
collected by the sample population by sending emails. People will be asked to give their
opinion regarding certain question and sent their responses back to the researcher
(Wheelen and et.al., 2017).
The sample frame for the research is students of the college. A sample of 20
students has been taken for collecting the data regarding changing habits of consumers
in respect of their shopping preferences.
c) Designing a questionnaire for collection of data
Name :
Age:
Telephone no. :
QUESTIONNAIRE
Q.1 How often do you shop ?
ï‚· Once in 15 days
ï‚· once in 2 months
ï‚· once in 6 months
ï‚· once a year
Q.2 How often do you use online shopping sites?
ï‚· once a week
ï‚· once in 15 days
ï‚· once in 30 days
ï‚· more than 30 days
Q.3 Do you prefer online shopping than traditional shopping ?
ï‚· yes
ï‚· no
Q.4 What are the factors that motivates you towards online shopping?
2
tabler-icon-diamond-filled.svg

Paraphrase This Document

Need a fresh take? Get an instant paraphrase of this document with our AI Paraphraser
Document Page
ï‚· Convenience
ï‚· saves time
ï‚· wide product range
ï‚· better prices
Q.5 what factors restricts you from shopping online?
ï‚· Payment security
ï‚· product risk
ï‚· return policy
ï‚· non delivery of products
Q.6 What factors restricts you from traditional shopping ?
ï‚· High prices
ï‚· lack of variety of products
ï‚· location
ï‚· unavailability to 24*7 access
TASK 2
a) Summarising the data collected data
Statistics
Q.1 How
often do
you
shop ?
Q.2 How
often do
you use
online
shopping
sites?
Q.3 Do
you prefer
online
shopping
than
traditional
shopping
?
Q.4 What
are the
factors
that
motivates
you
towards
online
shopping?
Q.5 what
factors
restricts
you from
shopping
online?
Q.6 What
factors
restricts
you from
traditional
shopping ?
N
Valid 20 20 20 20 20 20
Missi
ng 0 0 0 0 0 0
Mean 2.10 1.80 1.35 2.40 2.10 2.10
Std. Error of
Mean .250 .225 .109 .266 .240 .240
3
Document Page
Median 2.00 1.50 1.00 2.00 2.00 2.00
Mode 1 1 1 1 1 1a
Std. Deviation 1.119 1.005 .489 1.188 1.071 1.071
Variance 1.253 1.011 .239 1.411 1.147 1.147
Range 3 3 1 3 3 3
Minimum 1 1 1 1 1 1
Maximum 4 4 2 4 4 4
Sum 42 36 27 48 42 42
Percenti
les
25 1.00 1.00 1.00 1.00 1.00 1.00
50 2.00 1.50 1.00 2.00 2.00 2.00
75 3.00 2.00 2.00 3.75 3.00 3.00
Q.1 How often do you shop ?
Frequenc
y
Percent Valid
Percent
Cumulative
Percent
Valid
1 8 40.0 40.0 40.0
2 5 25.0 25.0 65.0
3 4 20.0 20.0 85.0
4 3 15.0 15.0 100.0
Total 20 100.0 100.0
Q.2 How often do you use online shopping sites?
Frequenc
y
Percent Valid
Percent
Cumulative
Percent
Valid
1 10 50.0 50.0 50.0
2 6 30.0 30.0 80.0
3 2 10.0 10.0 90.0
4 2 10.0 10.0 100.0
Total 20 100.0 100.0
Q.3 Do you prefer online shopping than traditional
shopping ?
4
Document Page
Frequenc
y
Percent Valid
Percent
Cumulative
Percent
Valid
1 13 65.0 65.0 65.0
2 7 35.0 35.0 100.0
Total 20 100.0 100.0
Q.4 What are the factors that motivates you towards
online shopping?
Frequenc
y
Percent Valid
Percent
Cumulative
Percent
Valid
1 6 30.0 30.0 30.0
2 5 25.0 25.0 55.0
3 4 20.0 20.0 75.0
4 5 25.0 25.0 100.0
Total 20 100.0 100.0
Q.5 what factors restricts you from shopping online?
Frequenc
y
Percent Valid
Percent
Cumulative
Percent
Valid
1 8 40.0 40.0 40.0
2 4 20.0 20.0 60.0
3 6 30.0 30.0 90.0
4 2 10.0 10.0 100.0
Total 20 100.0 100.0
Q.6 What factors restricts you from traditional shopping ?
Frequenc
y
Percent Valid
Percent
Cumulative
Percent
Valid
1 7 35.0 35.0 35.0
2 7 35.0 35.0 70.0
3 3 15.0 15.0 85.0
4 3 15.0 15.0 100.0
Total 20 100.0 100.0
5
tabler-icon-diamond-filled.svg

Paraphrase This Document

Need a fresh take? Get an instant paraphrase of this document with our AI Paraphraser
Document Page
b) Analysing results of survey and drawing conclusion
From the above table, it can found out that mean or average regarding how often
people shop is 2.10. Average of how often people visit online shopping site is 1.80, for
preference of online shopping over traditional shopping is 1.35. Median is the value that
divides the data set into upper and lower half (Hair Jr and et.al., 2015). The median of
the data set related to how often people visit online shopping site is 1.5. Mode is that
number in the sample population that occurs most often. The mode of the data set for
factors that attracts people towards online shopping site is 1.
c) Analysing the data using measures of dispersion
Dispersion reflects the scatterings of the data or variables in the data set.
Measures of dispersion are variance, standard deviation, range, mean deviation,
quartile deviation etc. The standard deviation of the how often people shop is 1.119 and
variance is 1.253. Similarly, what factors restricts people in going to mall or high street
malls is 1.071 and variance is 1.147. Range is one of the measure of dispersion which
shows the highest and lowest values in a data set. The range of the data set regarding
the preference of people of online shopping over traditional shopping is 1 while for the
data set relating to why people do not go to high street shops and malls is 3.
d) Using quartiles, percentiles and the correlation coefficient for drawing conclusion
Quartiles is a kind of quantile like Q1, Q2, Q3. The Q1 can be defined as the
middle value between the smallest value and median in a data set (Gerbl, McIvor and
Humphreys, 2016). Second quartile is the median of the sample population while third
quartile is the middle value of highest value and median value in a data set. Q1 of the
data set related to how often visit online shopping site is 1 while Q3 is 3. For the data
set related to why prefer online shopping sites over traditional shopping , the Q1 is 1
while the Q3 is 3.25.
6
Document Page
TASK 3
a) Graphs related to survey
Interpretation : From the above graph, it can be concluded that majority of
people that is 8 shop in every 15 days while 5 respondents said that they shop in every
2 months. This means that majority of the students shop quite often.
7
Document Page
Interpretation : From the above graph, it can be seen that hghest number of
people around 10 of them out 20 respondents visits online shopping once in a week, 6
of them said that they visits the sites in around 15 days. From this, it can be seen that
people are shifting their shopping platforms from malls to online websites.
8
tabler-icon-diamond-filled.svg

Paraphrase This Document

Need a fresh take? Get an instant paraphrase of this document with our AI Paraphraser
Document Page
Interpretation : It can be interpreted from this graph that majority of people now
prefer to shop from online websites rather than going to high streets shops or
supermarkets or malls. From this, it can be clearly seen that technological advance has
overtook the business from the malls and shops (Rosemann and vom Brocke, 2015).
9
Document Page
Interpretation : From the above graph, it can be seen that convenience is the
factor that highly motivates people in shopping from the online websites. 5 said that
online platform offers wide variety of products that drives them towards this way of
shopping.
10
chevron_up_icon
1 out of 24
circle_padding
hide_on_mobile
zoom_out_icon
[object Object]