Business Decision Making and Data Analysis Report for TUI Group
VerifiedAdded on 2020/01/28
|22
|4504
|71
Report
AI Summary
This report delves into the business decision-making processes of TUI Group, examining the skills and knowledge required for effective leadership in a competitive market. It explores various data collection methods, including primary and secondary sources such as interviews, questionnaires, and online resources, to gather relevant information for decision-making. The report analyzes survey methodologies used to assess customer satisfaction, including questionnaire design and sampling techniques. Furthermore, it presents a data analysis section, including statistical measures like mean, median, mode, range, and standard deviation, along with quartile and percentile calculations, to evaluate customer preferences across different travel destinations. The analysis is supported by visual representations, such as bar charts, to illustrate key findings and trends. Overall, the report provides a comprehensive overview of the data-driven decision-making approach employed by TUI Group.

Business Decision Making
Paraphrase This Document
Need a fresh take? Get an instant paraphrase of this document with our AI Paraphraser
Table of Contents
INTRODUCTION...........................................................................................................................3
TASK 1............................................................................................................................................3
1.1...........................................................................................................................................3
1.2 ..........................................................................................................................................4
1.3...........................................................................................................................................5
TASK.2............................................................................................................................................6
2.1...........................................................................................................................................6
2.2...........................................................................................................................................7
2.3...........................................................................................................................................7
2.4...........................................................................................................................................7
TASK.3 ...........................................................................................................................................9
3.1...........................................................................................................................................9
3.2.........................................................................................................................................11
3.3 Covered in PPT...............................................................................................................12
3.4.........................................................................................................................................12
TASK 4..........................................................................................................................................12
4.1.........................................................................................................................................12
4.2 ........................................................................................................................................13
4.3.........................................................................................................................................15
CONCLUSION..............................................................................................................................16
REFERENCES..............................................................................................................................17
INTRODUCTION
In making the appropriate decisions the employees have to use appropriate skills and
knowledge. Business leaders have to make so many decisions for the betterment of the entity and
it having a influence on the success of firm in the competitive market. Sometime these decisions
which are taken by the business leaders have an impact on the consumers, staff members as well
as in the market also (Barry and Edgman-Levitan, 2012). When the higher authorities make the
decision then they are having a different purpose and according to that they have to manage their
organisational activities which helps in attaining the targets.
TASK 1
1.1
There are distinctive sources which can be used by the employees of TUI Group for
collecting the appropriate data which helps in attaining the goals and objectives. To reap the
good outcomes staff members have to do proper survey. Different methods are:
Primary Data: This source is helpful in collecting the specific research projects and have to
meet the requirements of research projects. Different methods for gathering primary data are:
Interviews: The employees can meet the different people and take the face to face
interview or by using telephonic calls (Cronan and et. al., 2011).
Questionnaire: the staff members of TUI Group can set the different questions according
to the information which is to be collected and then it is to be filled by consumers.
Observation method: In this they should do observation of the particular individual
person and in this information and data to be obtained by the observation way.
Scheduled Method: This method is also helpful in collecting the methods and it is just
similar to the questionnaire tool. In this scheduled method questions were asked by the
special assigned people. It also assist in resolving the obstacles along with the
misunderstanding which occurs in front of the users (Fassin and Buelens, 2011).
Secondary Data: In this information or data not collected by the user directly as it is a second
hand data so it is collected from the different sources. Tools and techniques for collecting the
secondary data are:
⊘ This is a preview!⊘
Do you want full access?
Subscribe today to unlock all pages.
Trusted by 1+ million students worldwide
Internal source: The employees of TUI Group can collect the data by sales reports,
financial statements as well as demographic profile of the consumers. Along with the
reports and feedbacks from service users and dealers.
External source: It includes the libraries, business journals, internet etc. Along with this
they can gather the information from government departments (Ford and Richardson,
2013).
M1
There are different sources which is helpful in gathering data so that they can attain their
goals and objectives. If they are using primary source then they collect actual and first hand
information by using different methods which include interview, questionnaire and observation
method. Another one is secondary source which assist in collecting second hand information and
methods are online, articles etc.
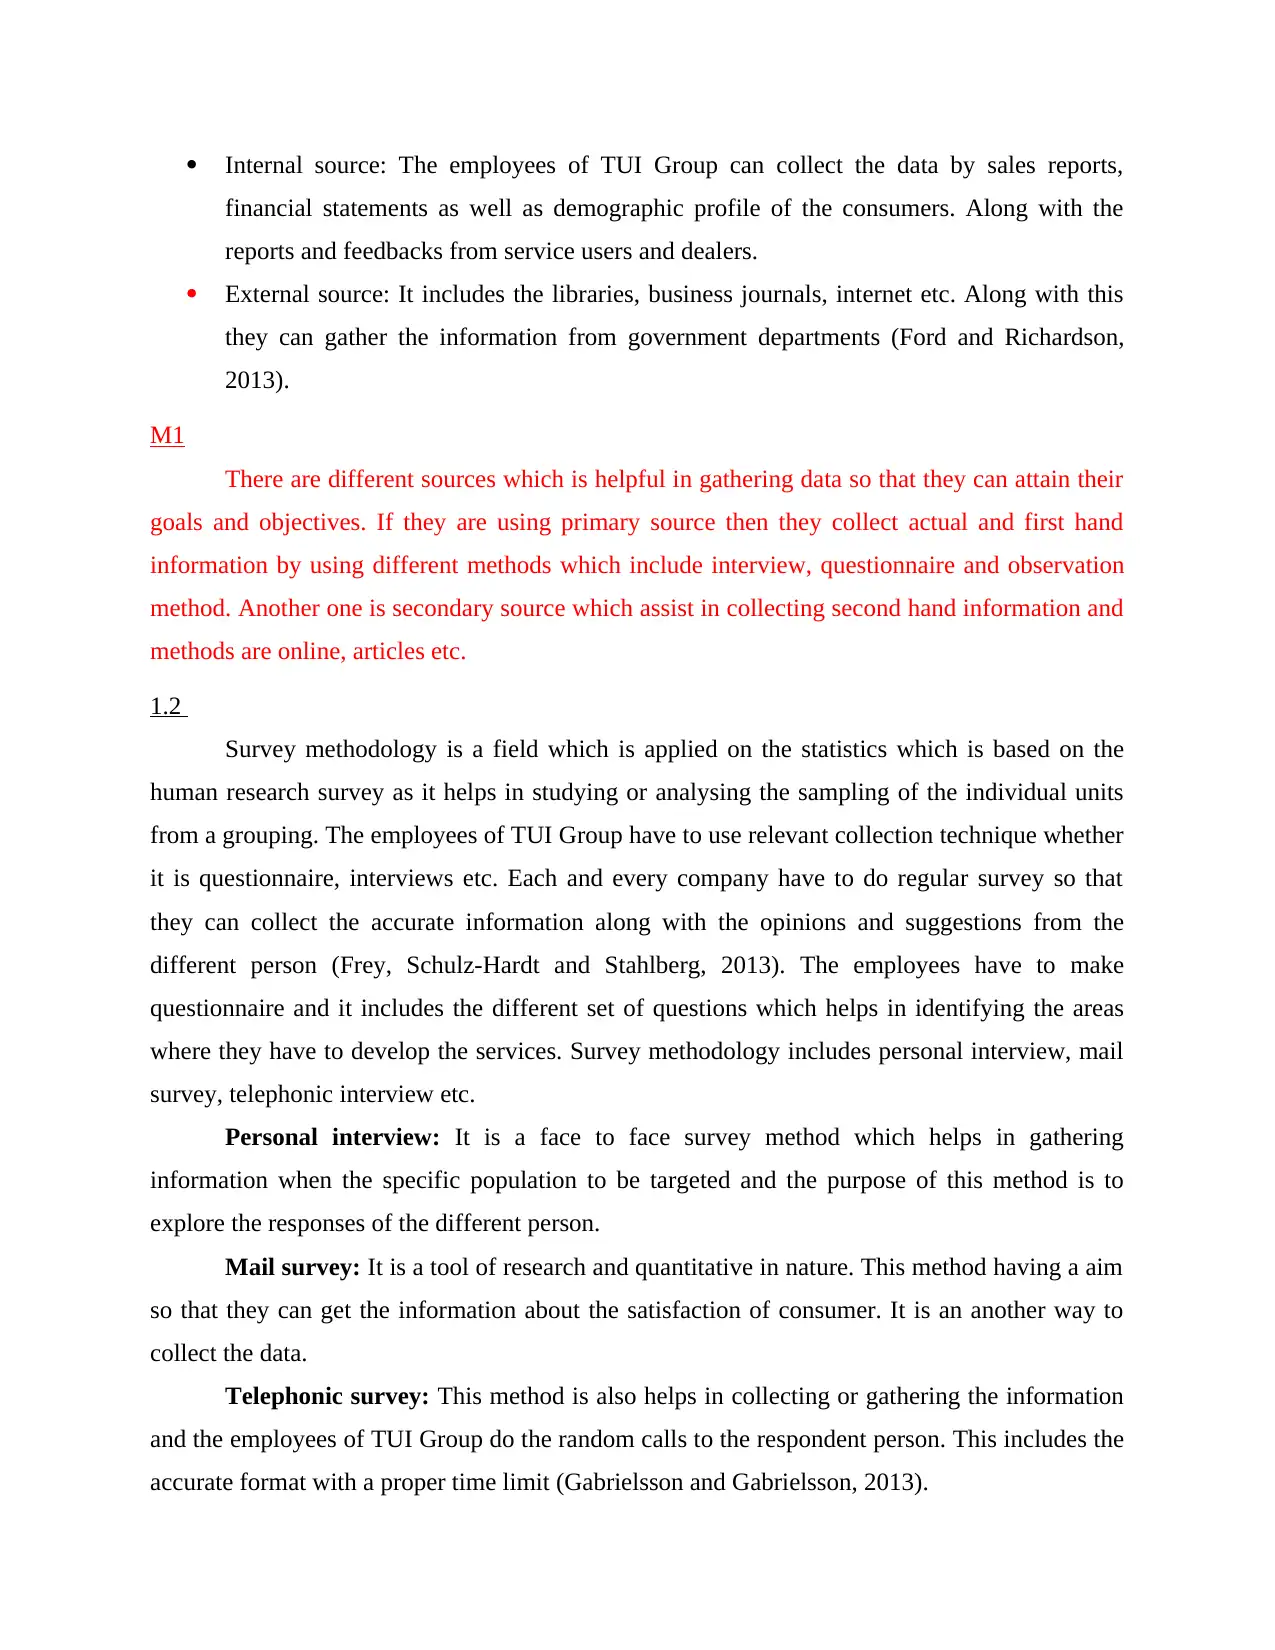
1.2
Survey methodology is a field which is applied on the statistics which is based on the
human research survey as it helps in studying or analysing the sampling of the individual units
from a grouping. The employees of TUI Group have to use relevant collection technique whether
it is questionnaire, interviews etc. Each and every company have to do regular survey so that
they can collect the accurate information along with the opinions and suggestions from the
different person (Frey, Schulz-Hardt and Stahlberg, 2013). The employees have to make
questionnaire and it includes the different set of questions which helps in identifying the areas
where they have to develop the services. Survey methodology includes personal interview, mail
survey, telephonic interview etc.
Personal interview: It is a face to face survey method which helps in gathering
information when the specific population to be targeted and the purpose of this method is to
explore the responses of the different person.
Mail survey: It is a tool of research and quantitative in nature. This method having a aim
so that they can get the information about the satisfaction of consumer. It is an another way to
collect the data.
Telephonic survey: This method is also helps in collecting or gathering the information
and the employees of TUI Group do the random calls to the respondent person. This includes the
accurate format with a proper time limit (Gabrielsson and Gabrielsson, 2013).
financial statements as well as demographic profile of the consumers. Along with the
reports and feedbacks from service users and dealers.
External source: It includes the libraries, business journals, internet etc. Along with this
they can gather the information from government departments (Ford and Richardson,
2013).
M1
There are different sources which is helpful in gathering data so that they can attain their
goals and objectives. If they are using primary source then they collect actual and first hand
information by using different methods which include interview, questionnaire and observation
method. Another one is secondary source which assist in collecting second hand information and
methods are online, articles etc.
1.2
Survey methodology is a field which is applied on the statistics which is based on the
human research survey as it helps in studying or analysing the sampling of the individual units
from a grouping. The employees of TUI Group have to use relevant collection technique whether
it is questionnaire, interviews etc. Each and every company have to do regular survey so that
they can collect the accurate information along with the opinions and suggestions from the
different person (Frey, Schulz-Hardt and Stahlberg, 2013). The employees have to make
questionnaire and it includes the different set of questions which helps in identifying the areas
where they have to develop the services. Survey methodology includes personal interview, mail
survey, telephonic interview etc.
Personal interview: It is a face to face survey method which helps in gathering
information when the specific population to be targeted and the purpose of this method is to
explore the responses of the different person.
Mail survey: It is a tool of research and quantitative in nature. This method having a aim
so that they can get the information about the satisfaction of consumer. It is an another way to
collect the data.
Telephonic survey: This method is also helps in collecting or gathering the information
and the employees of TUI Group do the random calls to the respondent person. This includes the
accurate format with a proper time limit (Gabrielsson and Gabrielsson, 2013).
Paraphrase This Document
Need a fresh take? Get an instant paraphrase of this document with our AI Paraphraser
After using these type of tools and techniques then they have to do sample framing in
which they have to analyse the information which are gathered from the different consumers. By
using the process of sampling, the staff members of TUI Group have to select the group of
services users who are taking the services of business entity and they are distinctive from each
other which will succour in collecting information and by using that data they can get best
results.
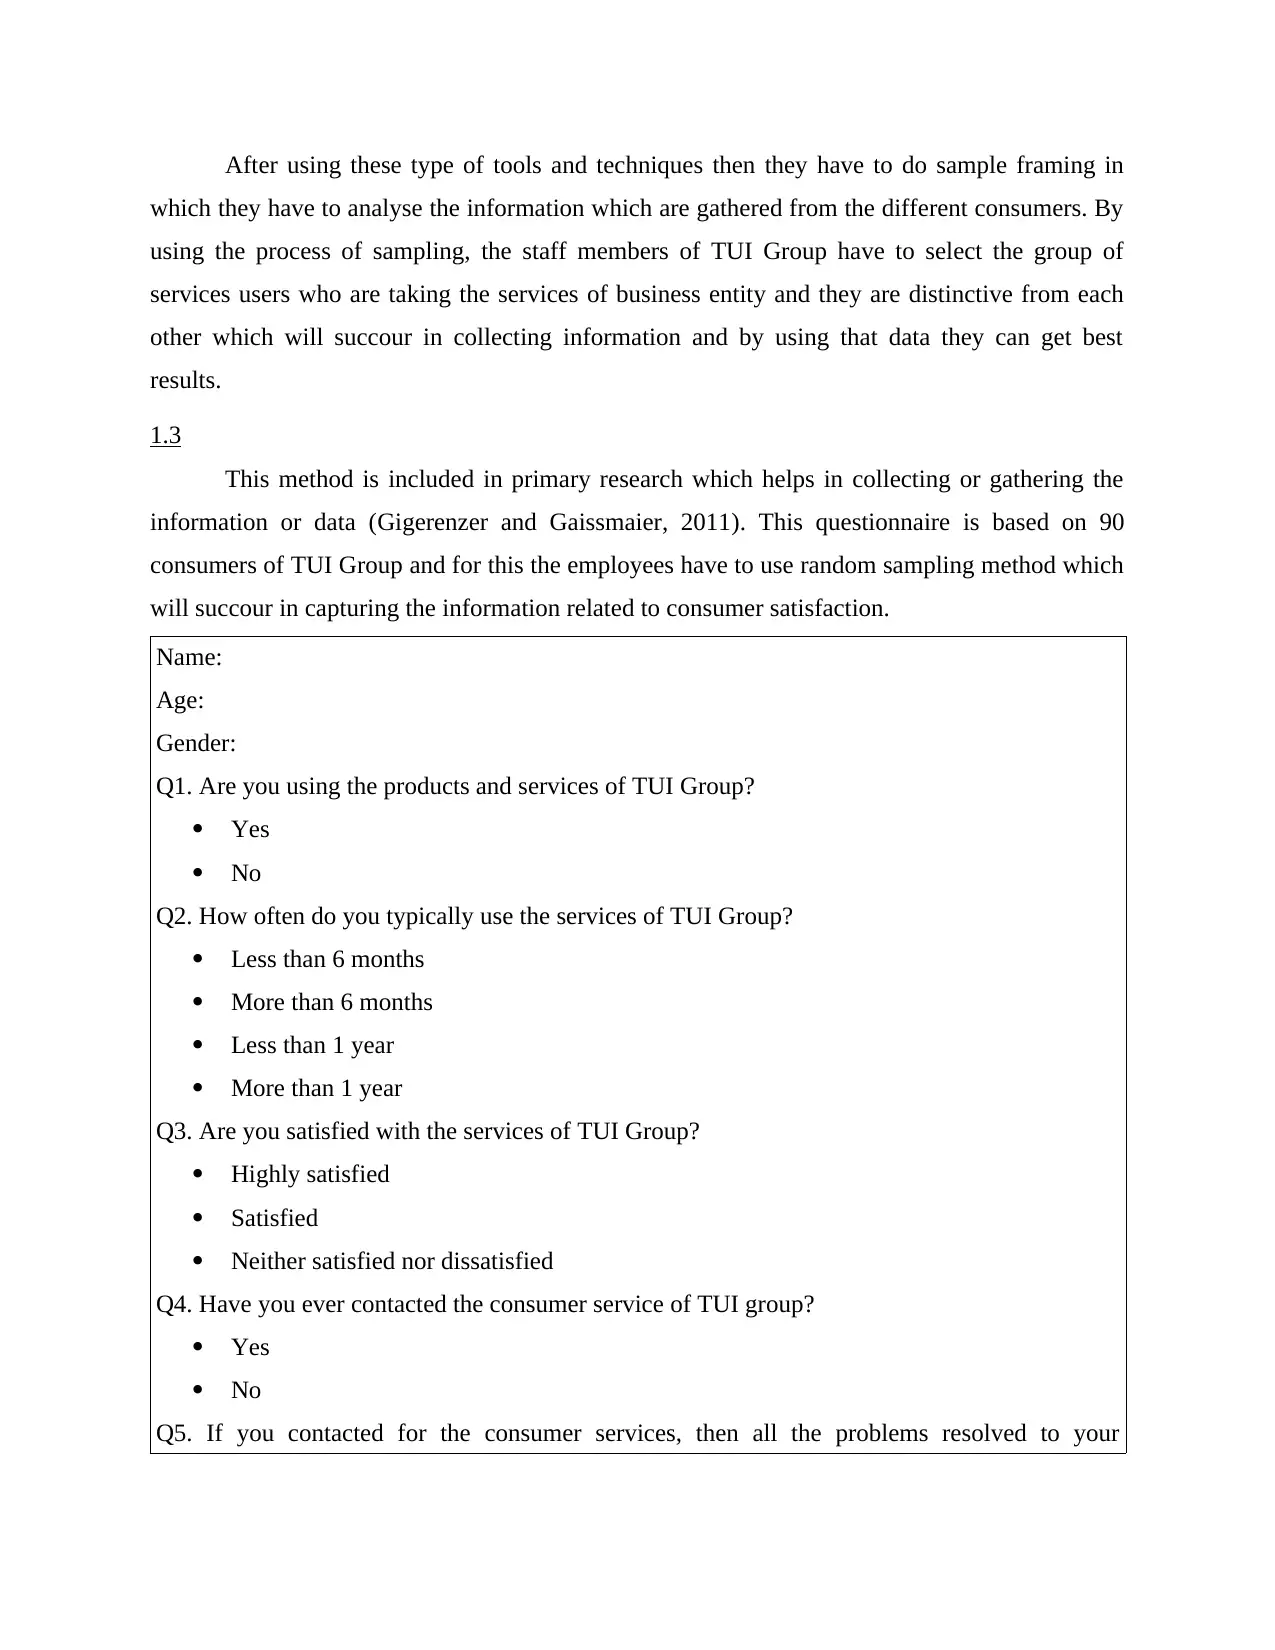
1.3
This method is included in primary research which helps in collecting or gathering the
information or data (Gigerenzer and Gaissmaier, 2011). This questionnaire is based on 90
consumers of TUI Group and for this the employees have to use random sampling method which
will succour in capturing the information related to consumer satisfaction.
Name:
Age:
Gender:
Q1. Are you using the products and services of TUI Group?
Yes
No
Q2. How often do you typically use the services of TUI Group?
Less than 6 months
More than 6 months
Less than 1 year
More than 1 year
Q3. Are you satisfied with the services of TUI Group?
Highly satisfied
Satisfied
Neither satisfied nor dissatisfied
Q4. Have you ever contacted the consumer service of TUI group?
Yes
No
Q5. If you contacted for the consumer services, then all the problems resolved to your
which they have to analyse the information which are gathered from the different consumers. By
using the process of sampling, the staff members of TUI Group have to select the group of
services users who are taking the services of business entity and they are distinctive from each
other which will succour in collecting information and by using that data they can get best
results.
1.3
This method is included in primary research which helps in collecting or gathering the
information or data (Gigerenzer and Gaissmaier, 2011). This questionnaire is based on 90
consumers of TUI Group and for this the employees have to use random sampling method which
will succour in capturing the information related to consumer satisfaction.
Name:
Age:
Gender:
Q1. Are you using the products and services of TUI Group?
Yes
No
Q2. How often do you typically use the services of TUI Group?
Less than 6 months
More than 6 months
Less than 1 year
More than 1 year
Q3. Are you satisfied with the services of TUI Group?
Highly satisfied
Satisfied
Neither satisfied nor dissatisfied
Q4. Have you ever contacted the consumer service of TUI group?
Yes
No
Q5. If you contacted for the consumer services, then all the problems resolved to your
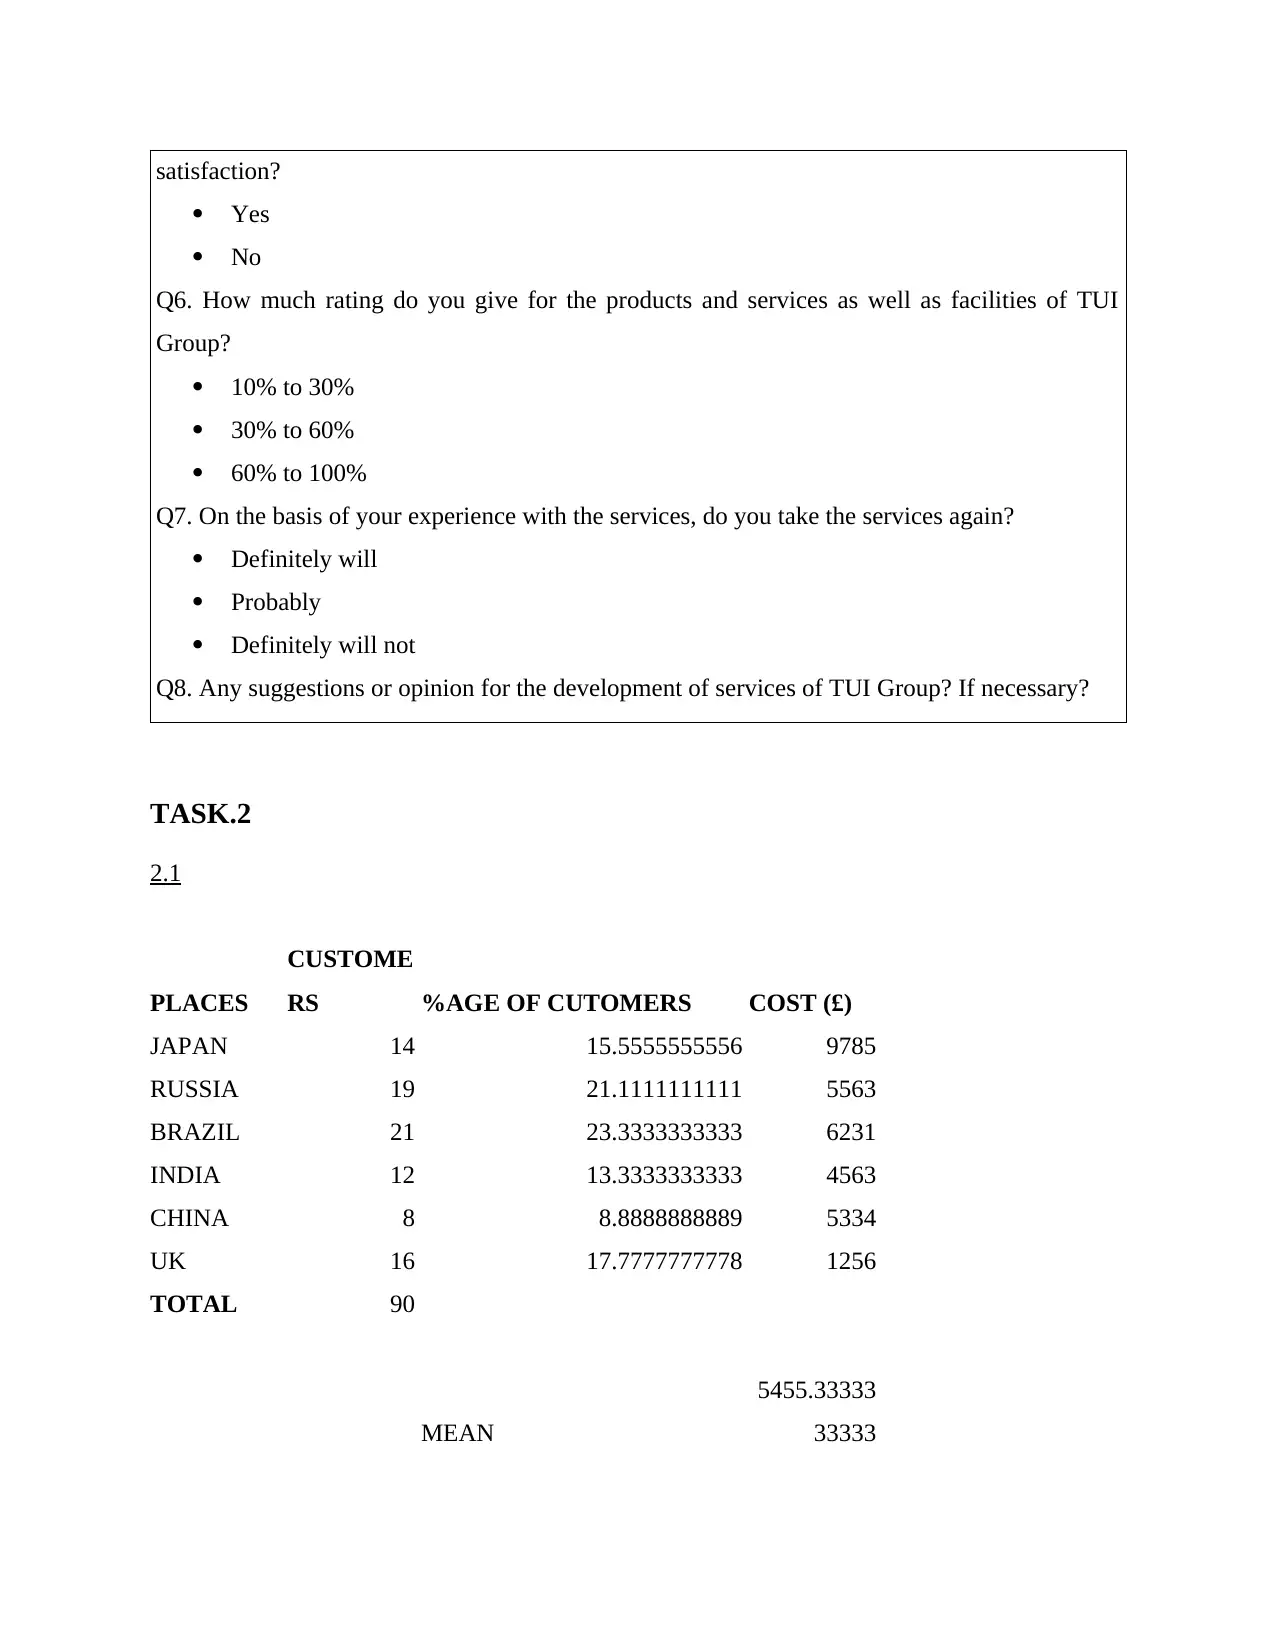
satisfaction?
Yes
No
Q6. How much rating do you give for the products and services as well as facilities of TUI
Group?
10% to 30%
30% to 60%
60% to 100%
Q7. On the basis of your experience with the services, do you take the services again?
Definitely will
Probably
Definitely will not
Q8. Any suggestions or opinion for the development of services of TUI Group? If necessary?
TASK.2
2.1
PLACES
CUSTOME
RS %AGE OF CUTOMERS COST (£)
JAPAN 14 15.5555555556 9785
RUSSIA 19 21.1111111111 5563
BRAZIL 21 23.3333333333 6231
INDIA 12 13.3333333333 4563
CHINA 8 8.8888888889 5334
UK 16 17.7777777778 1256
TOTAL 90
MEAN
5455.33333
33333
⊘ This is a preview!⊘
Do you want full access?
Subscribe today to unlock all pages.
Trusted by 1+ million students worldwide
MEDIAN 5448.5
MODE 993
LOWER RANGE 1256
UPPER RANGE 9785
INTERQUARTILE RANGE 8529
STANDARD DEVIATION
2749.71436
09231
2.2
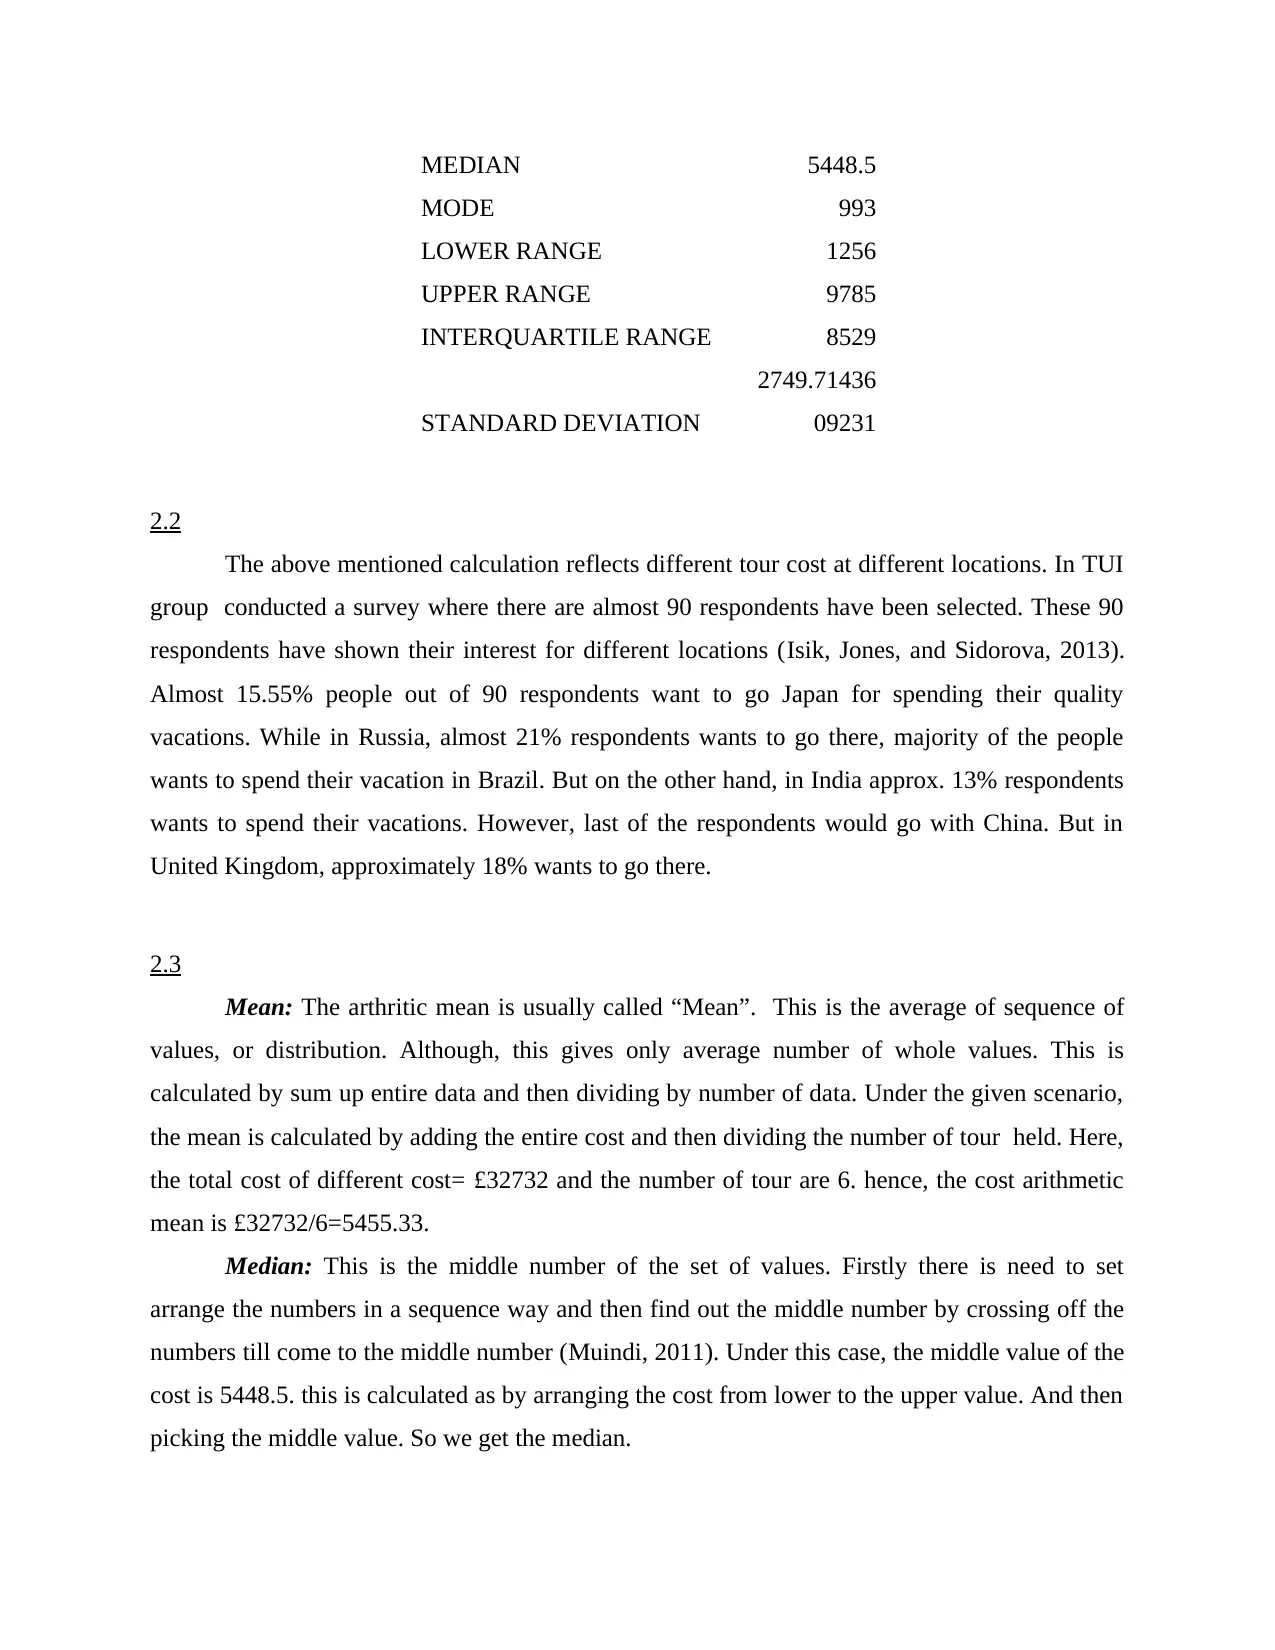
The above mentioned calculation reflects different tour cost at different locations. In TUI
group conducted a survey where there are almost 90 respondents have been selected. These 90
respondents have shown their interest for different locations (Isik, Jones, and Sidorova, 2013).
Almost 15.55% people out of 90 respondents want to go Japan for spending their quality
vacations. While in Russia, almost 21% respondents wants to go there, majority of the people
wants to spend their vacation in Brazil. But on the other hand, in India approx. 13% respondents
wants to spend their vacations. However, last of the respondents would go with China. But in
United Kingdom, approximately 18% wants to go there.
2.3
Mean: The arthritic mean is usually called “Mean”. This is the average of sequence of
values, or distribution. Although, this gives only average number of whole values. This is
calculated by sum up entire data and then dividing by number of data. Under the given scenario,
the mean is calculated by adding the entire cost and then dividing the number of tour held. Here,
the total cost of different cost= £32732 and the number of tour are 6. hence, the cost arithmetic
mean is £32732/6=5455.33.
Median: This is the middle number of the set of values. Firstly there is need to set
arrange the numbers in a sequence way and then find out the middle number by crossing off the
numbers till come to the middle number (Muindi, 2011). Under this case, the middle value of the
cost is 5448.5. this is calculated as by arranging the cost from lower to the upper value. And then
picking the middle value. So we get the median.
MODE 993
LOWER RANGE 1256
UPPER RANGE 9785
INTERQUARTILE RANGE 8529
STANDARD DEVIATION
2749.71436
09231
2.2
The above mentioned calculation reflects different tour cost at different locations. In TUI
group conducted a survey where there are almost 90 respondents have been selected. These 90
respondents have shown their interest for different locations (Isik, Jones, and Sidorova, 2013).
Almost 15.55% people out of 90 respondents want to go Japan for spending their quality
vacations. While in Russia, almost 21% respondents wants to go there, majority of the people
wants to spend their vacation in Brazil. But on the other hand, in India approx. 13% respondents
wants to spend their vacations. However, last of the respondents would go with China. But in
United Kingdom, approximately 18% wants to go there.
2.3
Mean: The arthritic mean is usually called “Mean”. This is the average of sequence of
values, or distribution. Although, this gives only average number of whole values. This is
calculated by sum up entire data and then dividing by number of data. Under the given scenario,
the mean is calculated by adding the entire cost and then dividing the number of tour held. Here,
the total cost of different cost= £32732 and the number of tour are 6. hence, the cost arithmetic
mean is £32732/6=5455.33.
Median: This is the middle number of the set of values. Firstly there is need to set
arrange the numbers in a sequence way and then find out the middle number by crossing off the
numbers till come to the middle number (Muindi, 2011). Under this case, the middle value of the
cost is 5448.5. this is calculated as by arranging the cost from lower to the upper value. And then
picking the middle value. So we get the median.
Paraphrase This Document
Need a fresh take? Get an instant paraphrase of this document with our AI Paraphraser
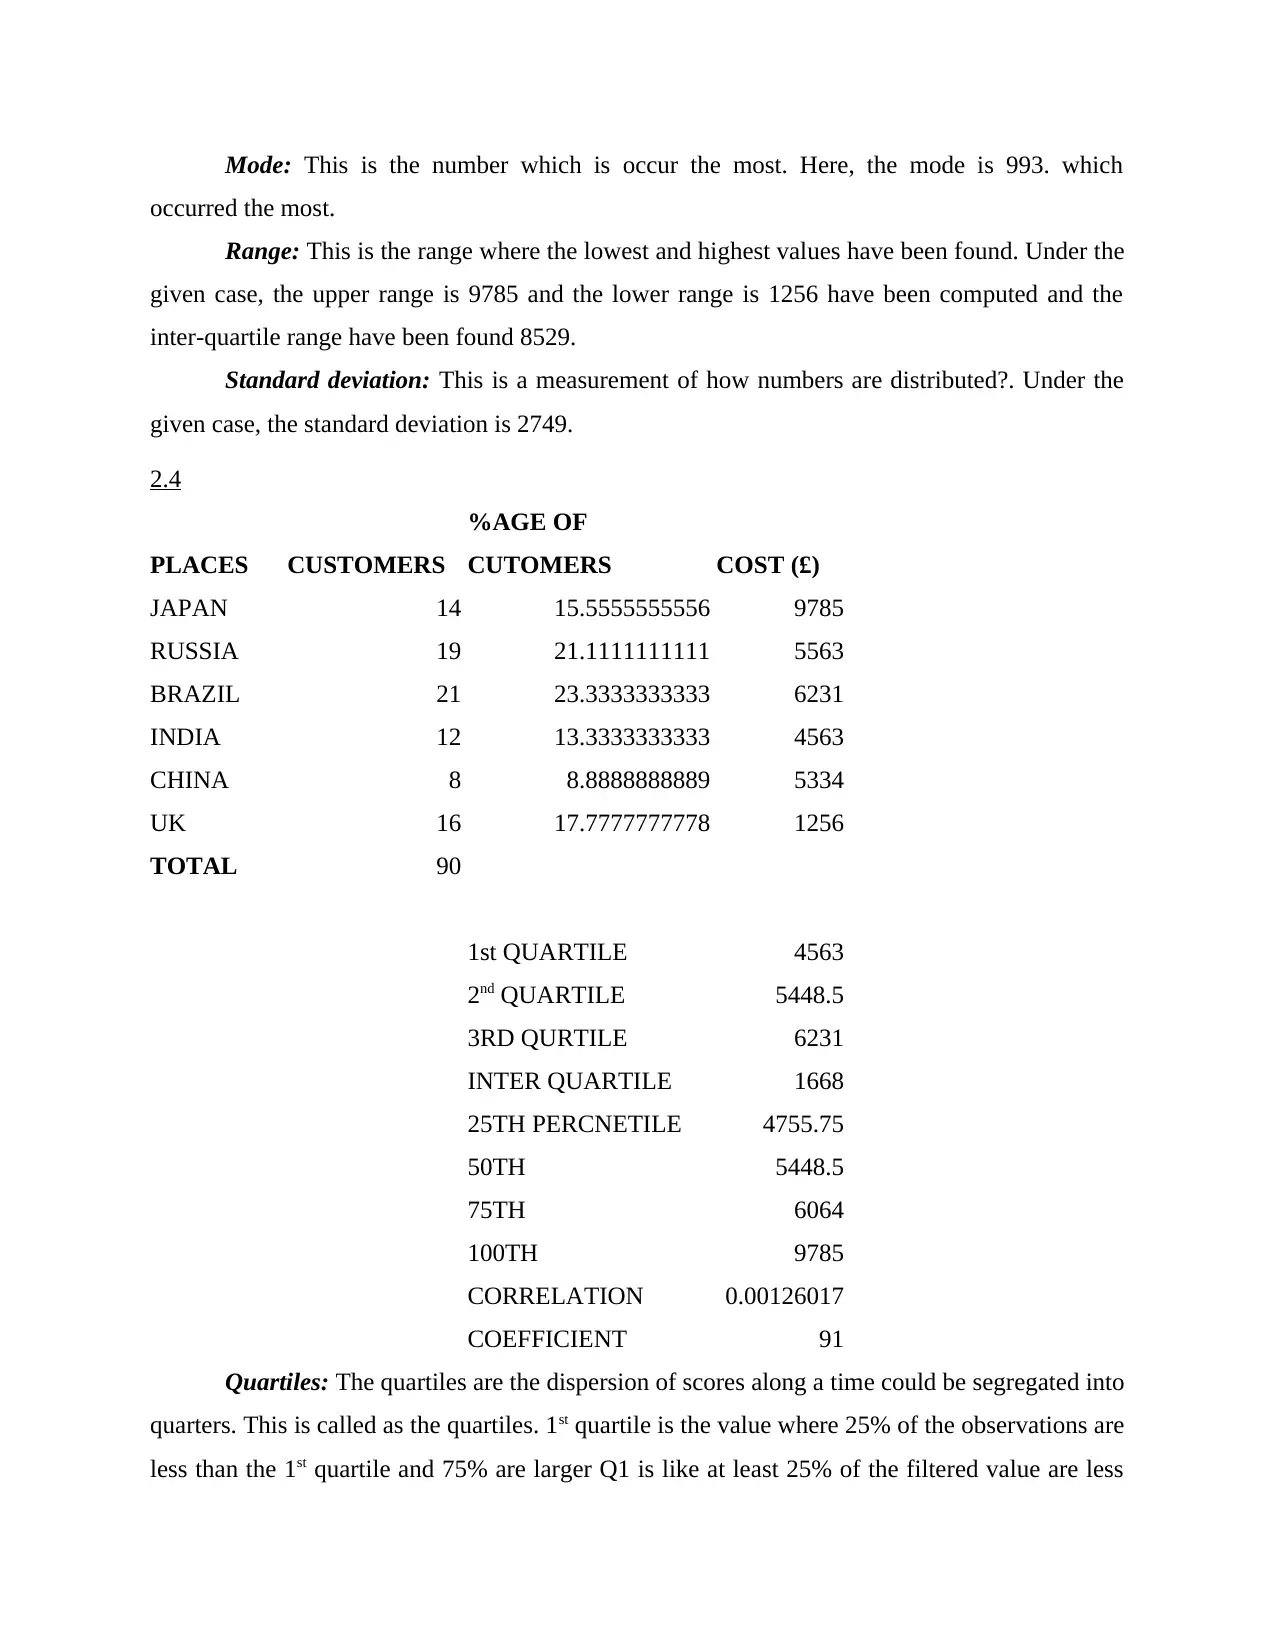
Mode: This is the number which is occur the most. Here, the mode is 993. which
occurred the most.
Range: This is the range where the lowest and highest values have been found. Under the
given case, the upper range is 9785 and the lower range is 1256 have been computed and the
inter-quartile range have been found 8529.
Standard deviation: This is a measurement of how numbers are distributed?. Under the
given case, the standard deviation is 2749.
2.4
PLACES CUSTOMERS
%AGE OF
CUTOMERS COST (£)
JAPAN 14 15.5555555556 9785
RUSSIA 19 21.1111111111 5563
BRAZIL 21 23.3333333333 6231
INDIA 12 13.3333333333 4563
CHINA 8 8.8888888889 5334
UK 16 17.7777777778 1256
TOTAL 90
1st QUARTILE 4563
2nd QUARTILE 5448.5
3RD QURTILE 6231
INTER QUARTILE 1668
25TH PERCNETILE 4755.75
50TH 5448.5
75TH 6064
100TH 9785
CORRELATION
COEFFICIENT
0.00126017
91
Quartiles: The quartiles are the dispersion of scores along a time could be segregated into
quarters. This is called as the quartiles. 1st quartile is the value where 25% of the observations are
less than the 1st quartile and 75% are larger Q1 is like at least 25% of the filtered value are less
than or equal to 1st quartile and at least 75% of the values are more than or equal to 1st quartile.
Here, under the given case, Q1, Q2 and Q3 are 4563, 5448.5 and 6231. while the inter-quartile
range has been calculated and this is the difference between Q3 and Q1. It is 1668.
Percentiles:Quartiles are beneficial and these aids to elaborates the dispersion of values.
Although, there is need to know about how one specific data value compares to the remaining
data. Percentiles are the most perfect for this circumstances (Nielsen and Nielsen, 2011). Under
the cited case, there are four percentiles are calculated which are namely 25th percentiles, 50th
percentiles, 75th percentiles and 100th percentiles which represents the most specific values which
is certainly related to the value.
TASK.3
3.1
JAPAN
RUSSIA
BRAZIL
INDIA
CHINA
UK
0 2000 4000 6000 8000 10000 12000
9785
5563
6231
4563
5334
1256
bar chart
CUSTOMERS
%AGE OF CUTOMERS
COST (£)
⊘ This is a preview!⊘
Do you want full access?
Subscribe today to unlock all pages.
Trusted by 1+ million students worldwide
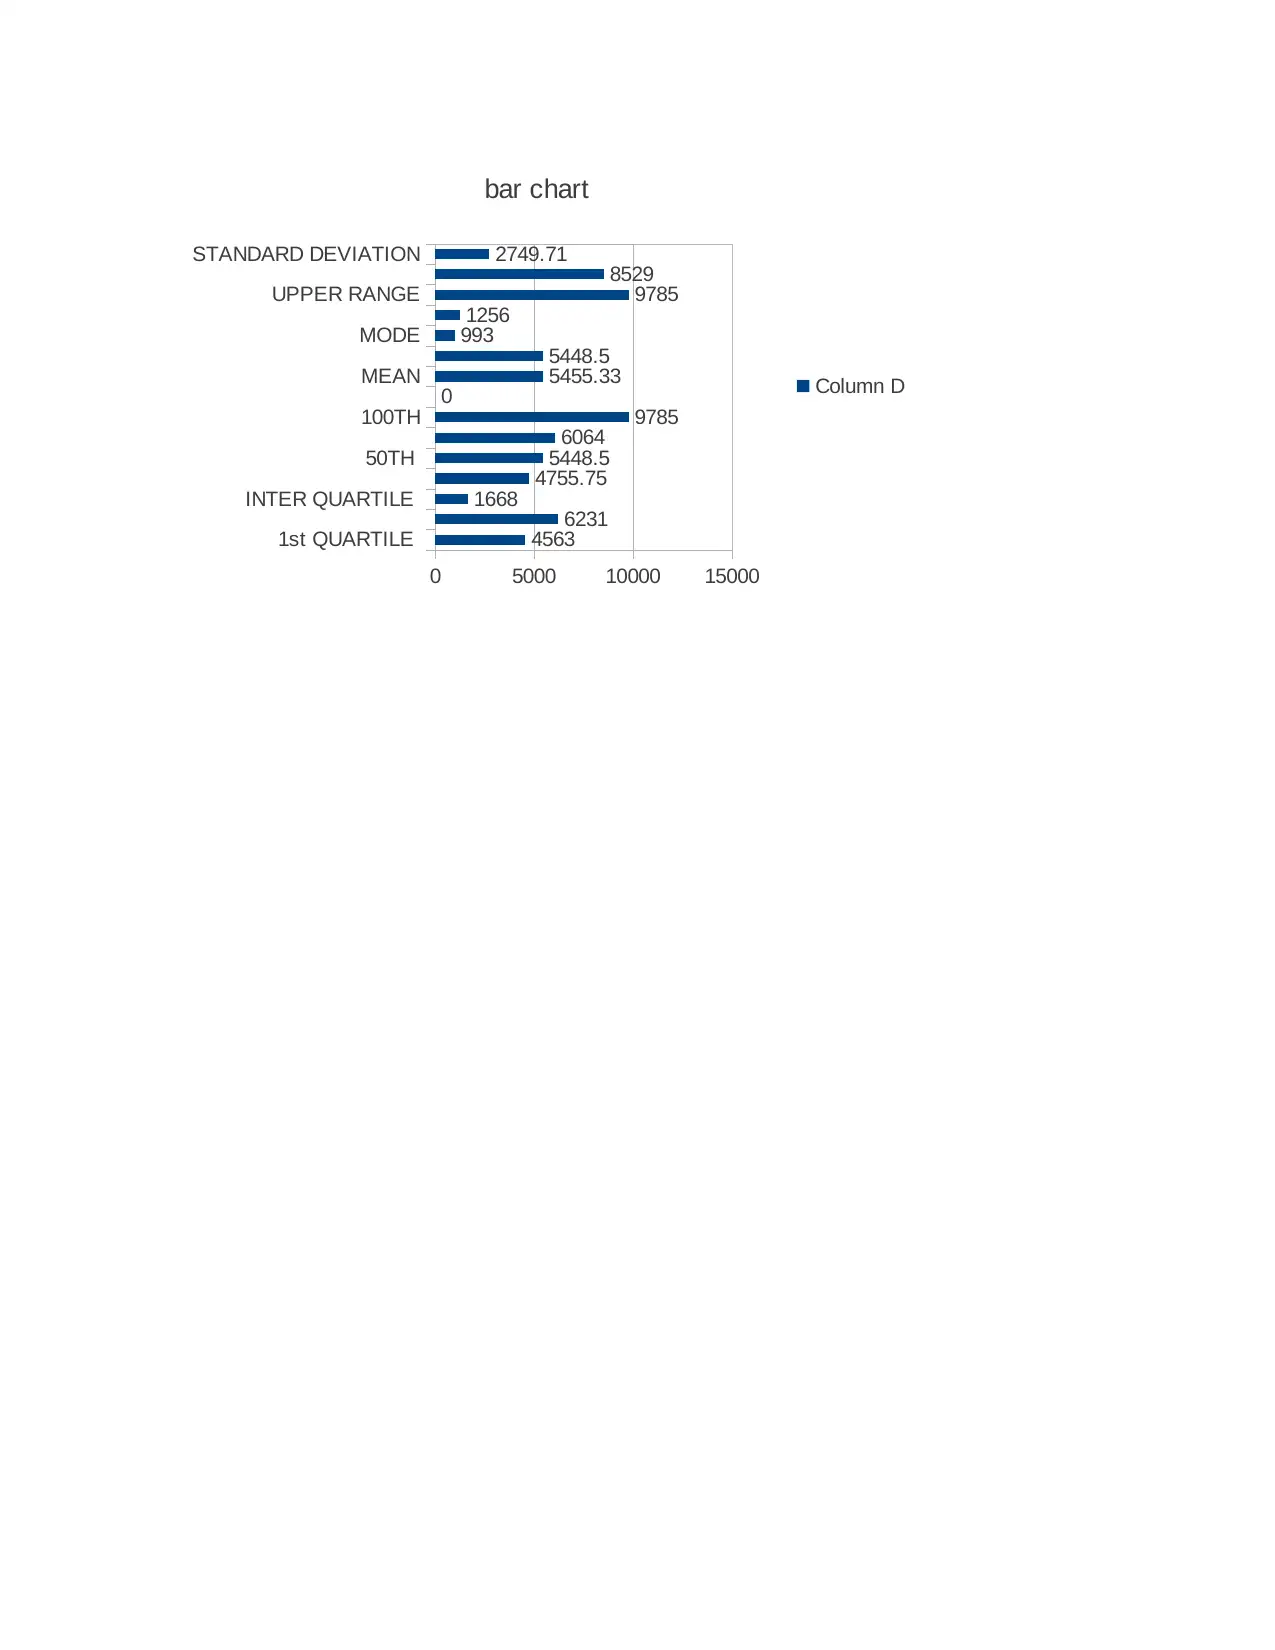
1st QUARTILE
INTER QUARTILE
50TH
100TH
MEAN
MODE
UPPER RANGE
STANDARD DEVIATION
0 5000 10000 15000
4563
6231
1668 4755.75
5448.5
6064 9785
0 5455.33
5448.5
993
1256 9785
8529
2749.71
bar chart
Column D
INTER QUARTILE
50TH
100TH
MEAN
MODE
UPPER RANGE
STANDARD DEVIATION
0 5000 10000 15000
4563
6231
1668 4755.75
5448.5
6064 9785
0 5455.33
5448.5
993
1256 9785
8529
2749.71
bar chart
Column D
Paraphrase This Document
Need a fresh take? Get an instant paraphrase of this document with our AI Paraphraser
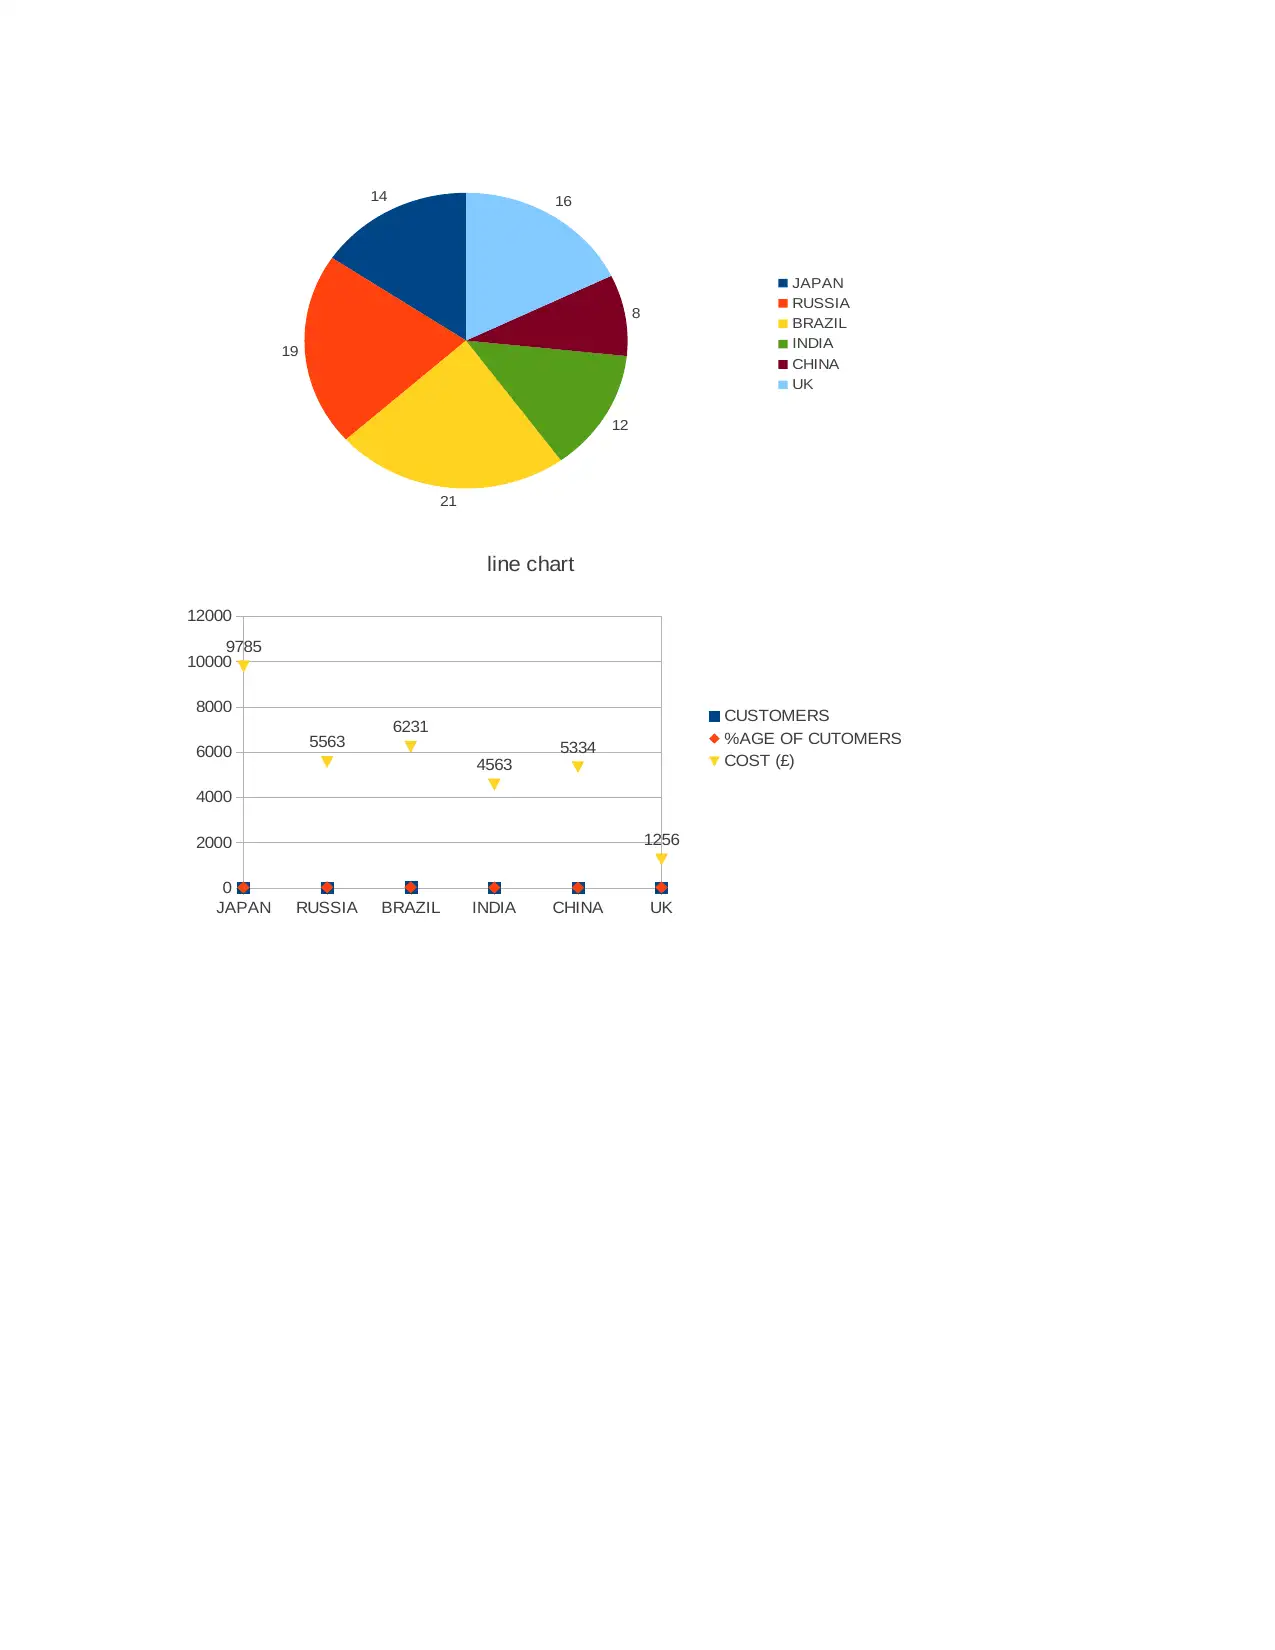
14
19
21
12
8
16
JAPAN
RUSSIA
BRAZIL
INDIA
CHINA
UK
JAPAN RUSSIA BRAZIL INDIA CHINA UK
0
2000
4000
6000
8000
10000
12000
9785
5563 6231
4563
5334
1256
line chart
CUSTOMERS
%AGE OF CUTOMERS
COST (£)
19
21
12
8
16
JAPAN
RUSSIA
BRAZIL
INDIA
CHINA
UK
JAPAN RUSSIA BRAZIL INDIA CHINA UK
0
2000
4000
6000
8000
10000
12000
9785
5563 6231
4563
5334
1256
line chart
CUSTOMERS
%AGE OF CUTOMERS
COST (£)
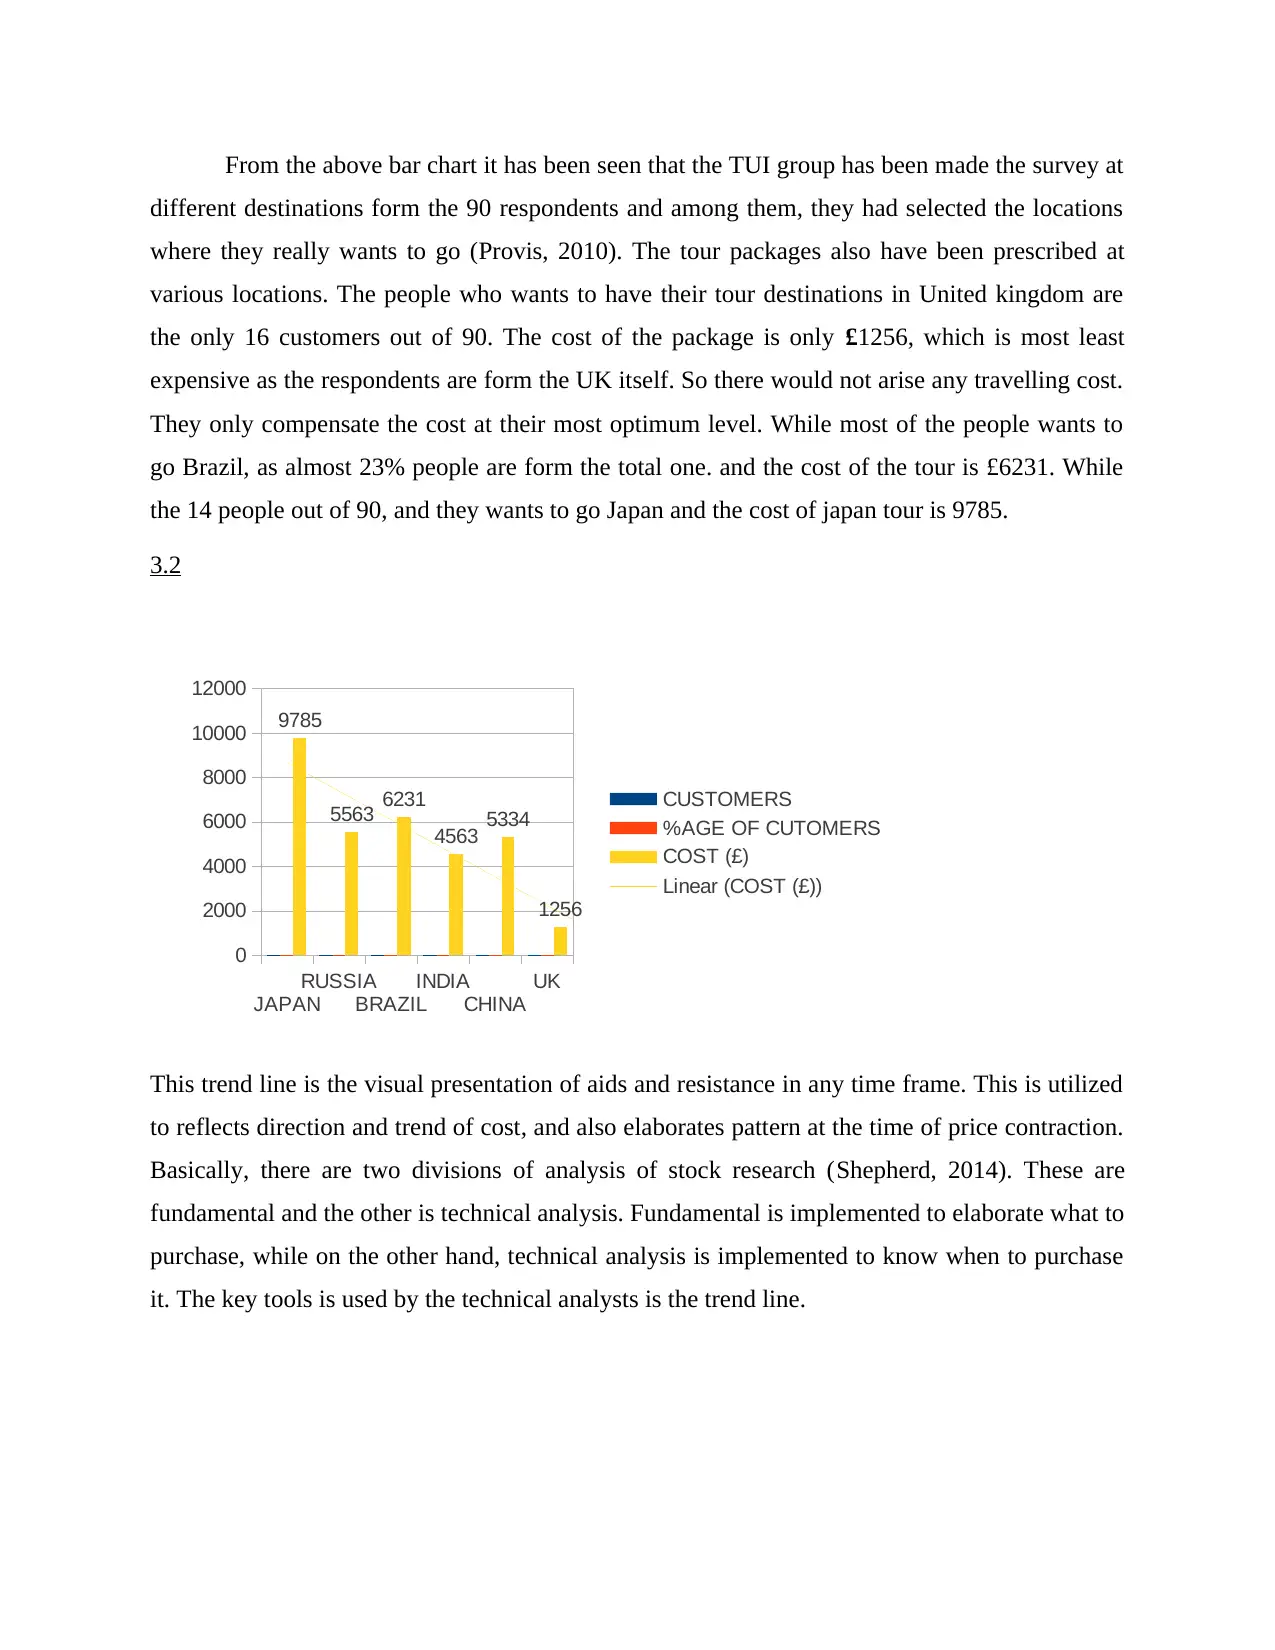
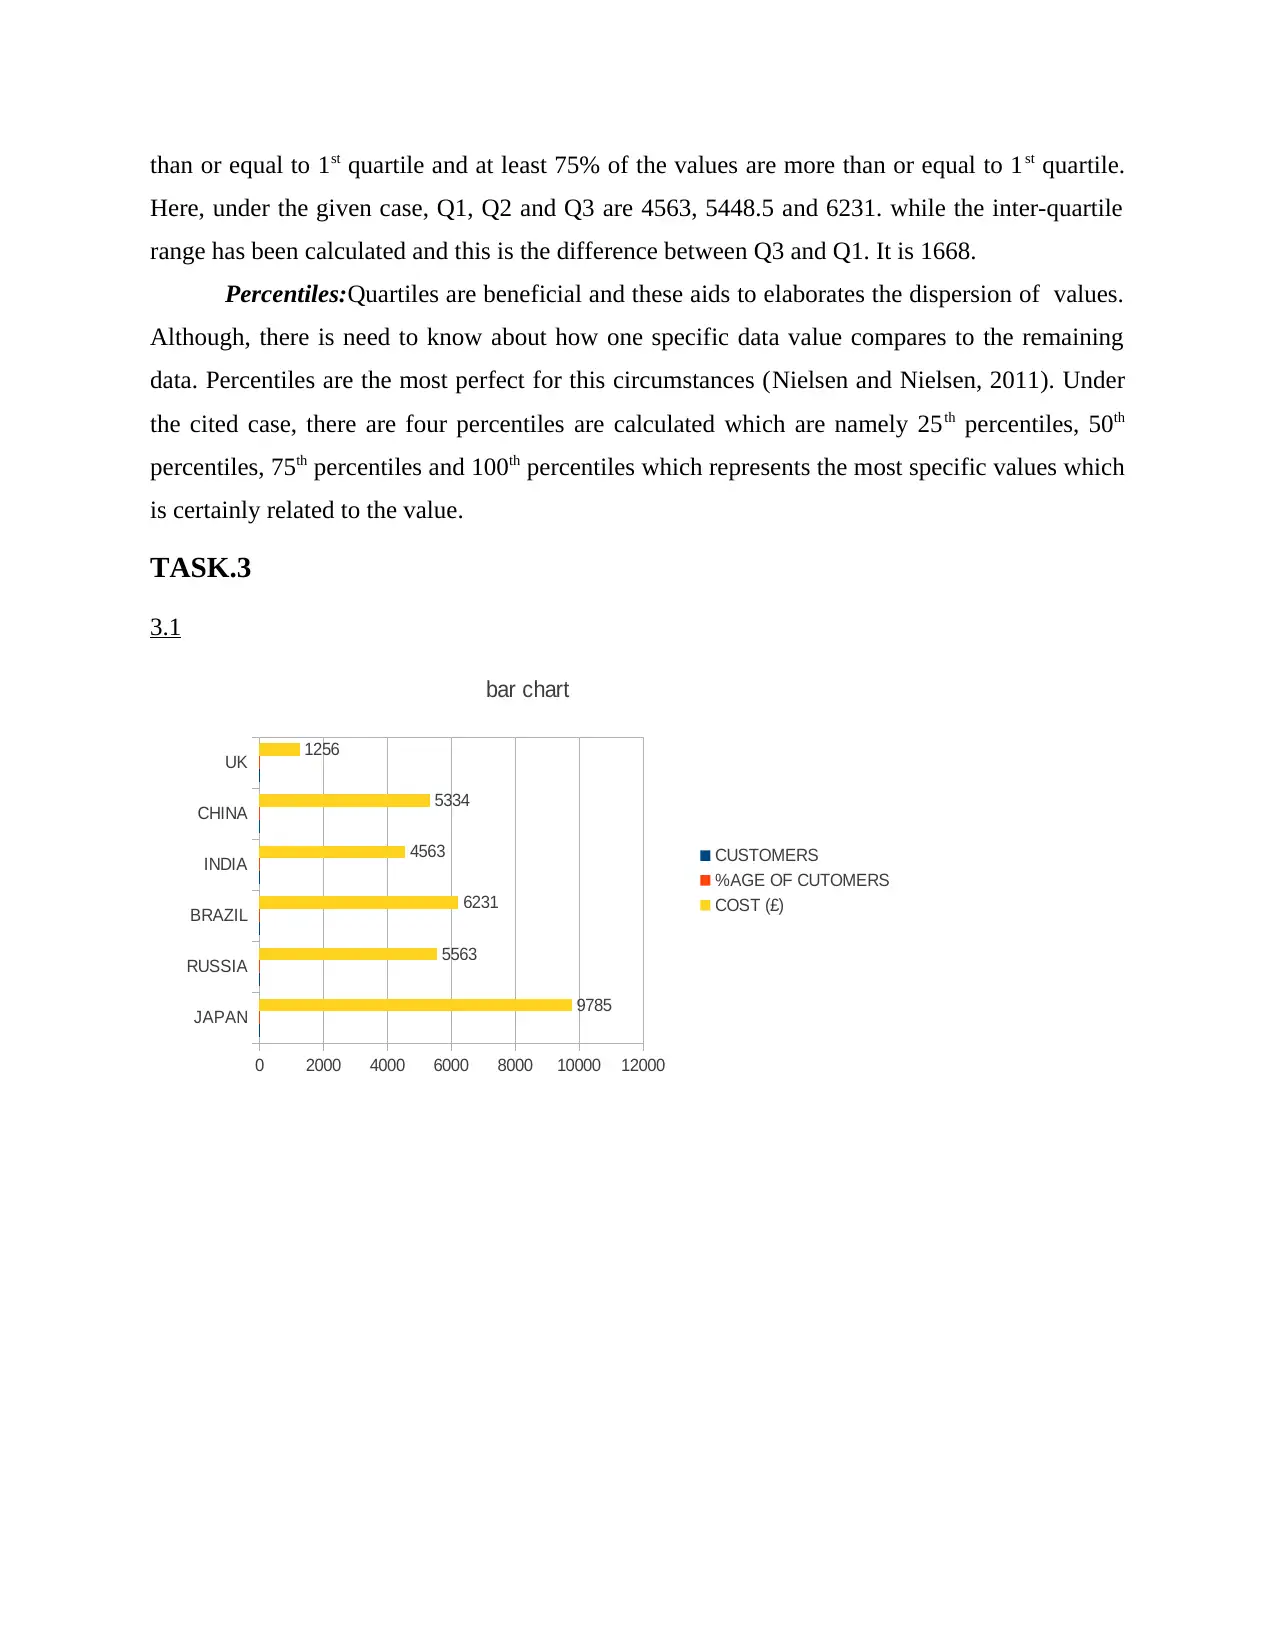
From the above bar chart it has been seen that the TUI group has been made the survey at
different destinations form the 90 respondents and among them, they had selected the locations
where they really wants to go (Provis, 2010). The tour packages also have been prescribed at
various locations. The people who wants to have their tour destinations in United kingdom are
the only 16 customers out of 90. The cost of the package is only £1256, which is most least
expensive as the respondents are form the UK itself. So there would not arise any travelling cost.
They only compensate the cost at their most optimum level. While most of the people wants to
go Brazil, as almost 23% people are form the total one. and the cost of the tour is £6231. While
the 14 people out of 90, and they wants to go Japan and the cost of japan tour is 9785.
3.2
JAPAN
RUSSIA
BRAZIL
INDIA
CHINA
UK
0
2000
4000
6000
8000
10000
12000
9785
5563 6231
4563 5334
1256
CUSTOMERS
%AGE OF CUTOMERS
COST (£)
Linear (COST (£))
This trend line is the visual presentation of aids and resistance in any time frame. This is utilized
to reflects direction and trend of cost, and also elaborates pattern at the time of price contraction.
Basically, there are two divisions of analysis of stock research (Shepherd, 2014). These are
fundamental and the other is technical analysis. Fundamental is implemented to elaborate what to
purchase, while on the other hand, technical analysis is implemented to know when to purchase
it. The key tools is used by the technical analysts is the trend line.
⊘ This is a preview!⊘
Do you want full access?
Subscribe today to unlock all pages.
Trusted by 1+ million students worldwide
1 out of 22
Related Documents


Your All-in-One AI-Powered Toolkit for Academic Success.
+13062052269
info@desklib.com
Available 24*7 on WhatsApp / Email
![[object Object]](/_next/static/media/star-bottom.7253800d.svg)
Unlock your academic potential
Copyright © 2020–2026 A2Z Services. All Rights Reserved. Developed and managed by ZUCOL.