Business Decision-Making Report: Analyzing Food for Friends, Unit 6
VerifiedAdded on 2020/06/06
|27
|3582
|61
Report
AI Summary
This report analyzes the business decision-making process for Food for Friends, a restaurant considering opening a second chain in London. The report begins with a plan to resolve the business problem, outlining the use of primary and secondary data collection methods, including questionnaires and analysis of past financial reports. It details the survey methodology, including convenience and simple random sampling techniques. The report presents raw data on revenue and profit from 2011 to 2017, followed by calculations of mean, median, mode, standard deviation, quartiles, percentiles, and correlation coefficients to assess the restaurant's performance. Graphical representations of the data are also provided. The analysis suggests that the restaurant's performance is positive, supporting the decision to launch a new branch. The report concludes with recommendations for business decision-making and includes references.

UNIT 6 BUSINESS DEC
MAKING
MAKING
Paraphrase This Document
Need a fresh take? Get an instant paraphrase of this document with our AI Paraphraser
TABLE OF CONTENTS
INTRODUCTION...........................................................................................................................1
TASK 1............................................................................................................................................1
1.1 Formulate plan for resolving business problem...............................................................1
1.2 Preparation of survey methodology and sampling frame.................................................1
1.3 Producing questionnaire...................................................................................................2
2.1 Producing summary of raw data.......................................................................................4
2.2 Calculating mean, median, mode.....................................................................................5
2.3 Measures of Dispersion....................................................................................................6
2.4 Computation of quartile, percentile, correlation...............................................................7
TASK 2............................................................................................................................................8
3.1 Graphical representation of collected data.......................................................................8
3.2 Producing trend line graph...............................................................................................9
3.3 Business presentation.....................................................................................................13
3.4 Formal business report...................................................................................................13
TASK 3..........................................................................................................................................14
4.1 Kinds of tools for information processing system..........................................................14
4.2 Project plan and ascertaining critical path......................................................................15
..............................................................................................................................................16
..............................................................................................................................................16
4.3 Techniques for business decision-making......................................................................17
CONCLUSION..............................................................................................................................18
REFERENCES..............................................................................................................................19
INTRODUCTION
Business decision-making is essential aspect in the company as it helps to take enhanced
decisions in effective manner. The present report deals with Food for Friends restaurant which is
planning to launch another chain in London and management is keen to know about the same
whether to invest in it or not. Various information processing systems are discussed so that
adequate information can be entered and database can be maintained effectively. Moreover,
budgeting tools are also explained and measures of central tendency and standard deviation have
been discussed as well. Furthermore, various information regarding primary and secondary data
is also explained. Business will get to analyse market and open chain in the city.
TASK 1
1.1 Formulate plan for resolving business problem
The plan can be formulated for Food for Friends which is operating in London and
satisfying customers up to high extent. It is planning for opening second chain in the same city.
Thus, it is required to collect information regarding current trends in the market so that it may
achieve success in the market. For overcoming this problem, primary and secondary data can be
helpful for such purpose. The plan for primary data is that questionnaires should be passed on to
the respondents and restaurant should await for their reply. This will help to garner effective
information regarding customer's preferences in the best possible way. Online questionnaires can
be used for extracting required information which will help to gather useful data (Neal, 2018).
On the other hand, secondary data can be gathered by using past year's annual report so
that required information can be obtained with much ease. Second-hand information is obtained
with the help of secondary data and researcher can use this information to analyse business
performance and proper execution of plan can be effectively done. Thus, the plan for obtaining
information through primary and secondary data will help Food for Friends to collect necessary
data for opening second chain in London.
1.2 Preparation of survey methodology and sampling frame
1. Survey methodology
This method is quite effective one as online questionnaires is to be imparted to
respondents so that required information can be gathered with much ease. The survey can be
1
⊘ This is a preview!⊘
Do you want full access?
Subscribe today to unlock all pages.
Trusted by 1+ million students worldwide
used for obtaining adequate information which help Food for Friends restaurant to analyse
market demand of customers and moreover, it is cost effective method and less time is consumed
as well.
2. Convenience sampling method
Convenience sampling method is also adequate one to generate information. This is
important method which is done by extracting information from group of people which can be
easily contacted by researcher and as such, according to the convenience of researcher,
information can be obtained.
3. Simple random sampling
It is effective method as it helps to gather information from a sample of population which
represents entire population in the universe (Phelps and Wood, 2018). In simple words, this
method takes sample portion of the universe which is the representation of whole population as it
is impossible to collect each and every piece of information. In this report, sample of 30 people
is taken to gather essential data. Thus, this sample information will help Food for Friends to
generate effective data and can easily plan for opening second branch with much ease.
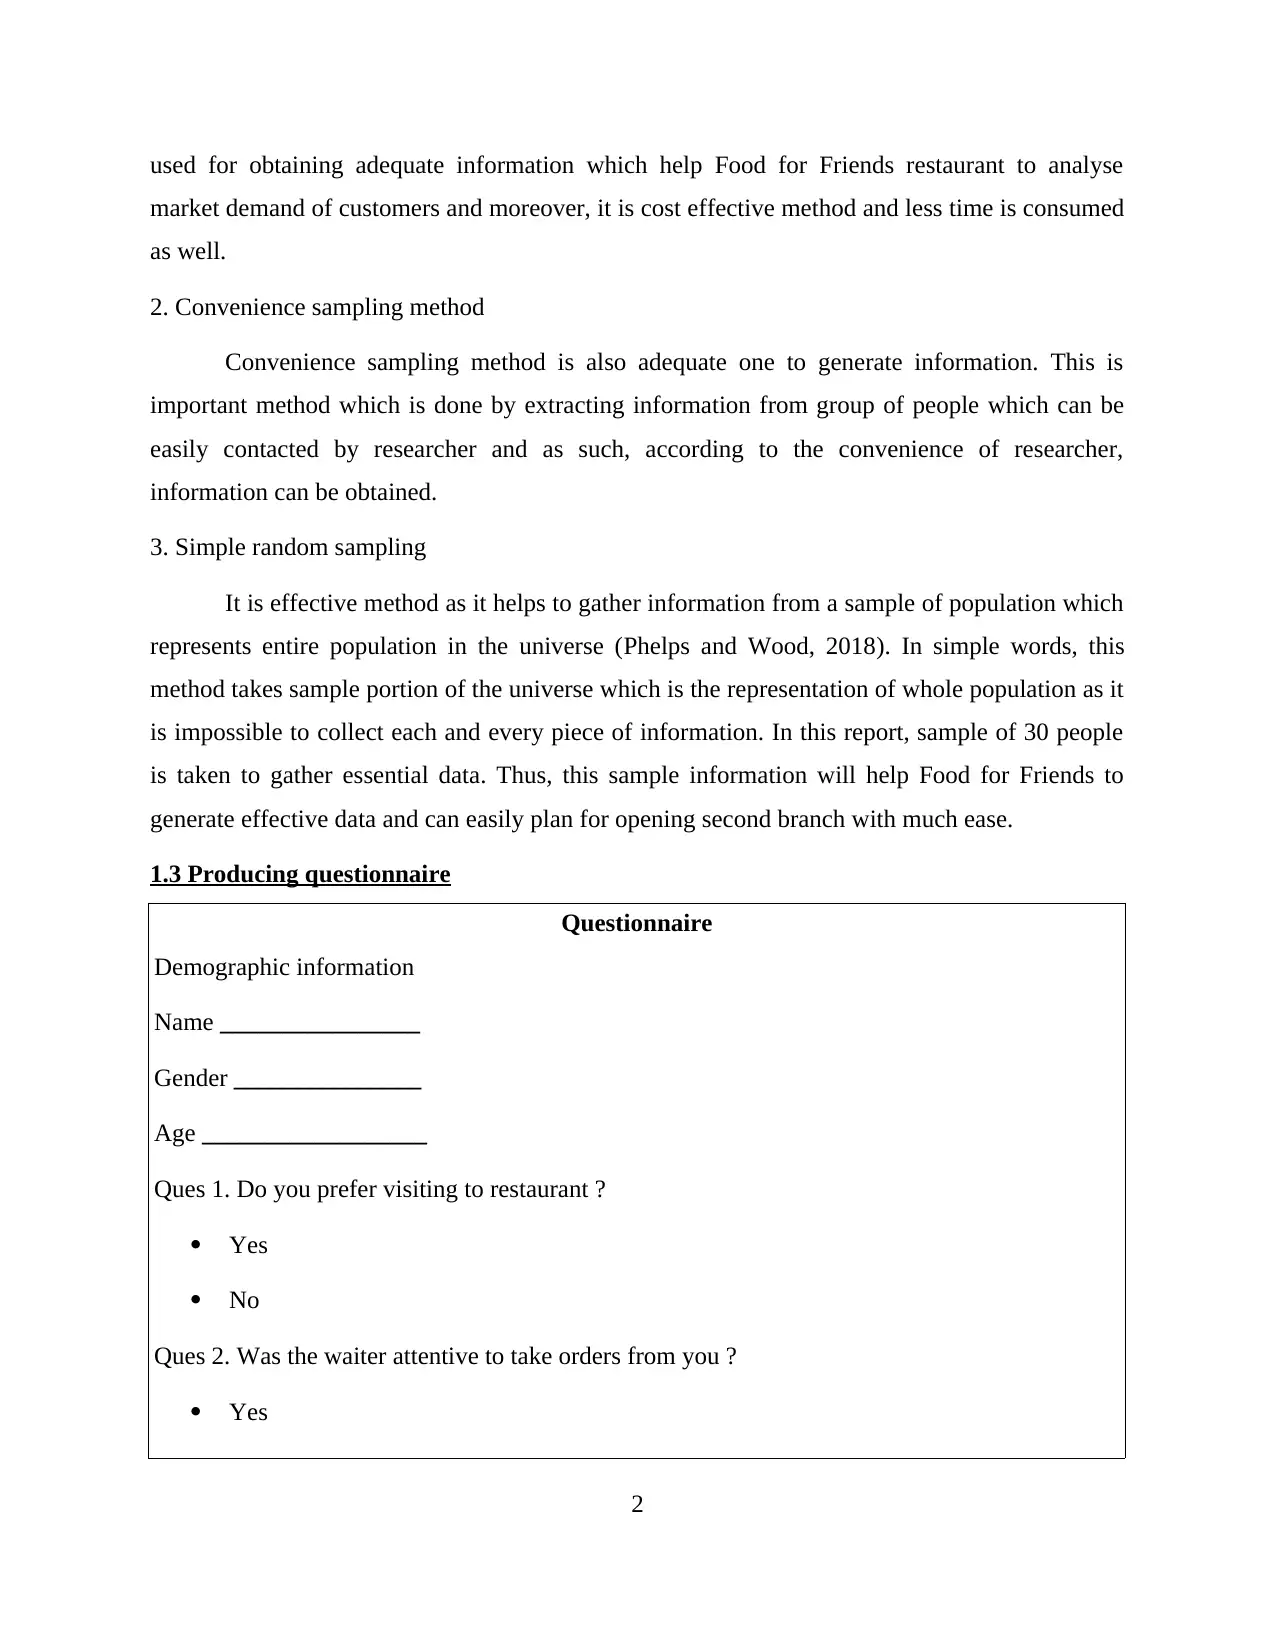
1.3 Producing questionnaire
Questionnaire
Demographic information
Name ________________
Gender _______________
Age __________________
Ques 1. Do you prefer visiting to restaurant ?
Yes
No
Ques 2. Was the waiter attentive to take orders from you ?
Yes
2
market demand of customers and moreover, it is cost effective method and less time is consumed
as well.
2. Convenience sampling method
Convenience sampling method is also adequate one to generate information. This is
important method which is done by extracting information from group of people which can be
easily contacted by researcher and as such, according to the convenience of researcher,
information can be obtained.
3. Simple random sampling
It is effective method as it helps to gather information from a sample of population which
represents entire population in the universe (Phelps and Wood, 2018). In simple words, this
method takes sample portion of the universe which is the representation of whole population as it
is impossible to collect each and every piece of information. In this report, sample of 30 people
is taken to gather essential data. Thus, this sample information will help Food for Friends to
generate effective data and can easily plan for opening second branch with much ease.
1.3 Producing questionnaire
Questionnaire
Demographic information
Name ________________
Gender _______________
Age __________________
Ques 1. Do you prefer visiting to restaurant ?
Yes
No
Ques 2. Was the waiter attentive to take orders from you ?
Yes
2
Paraphrase This Document
Need a fresh take? Get an instant paraphrase of this document with our AI Paraphraser
No
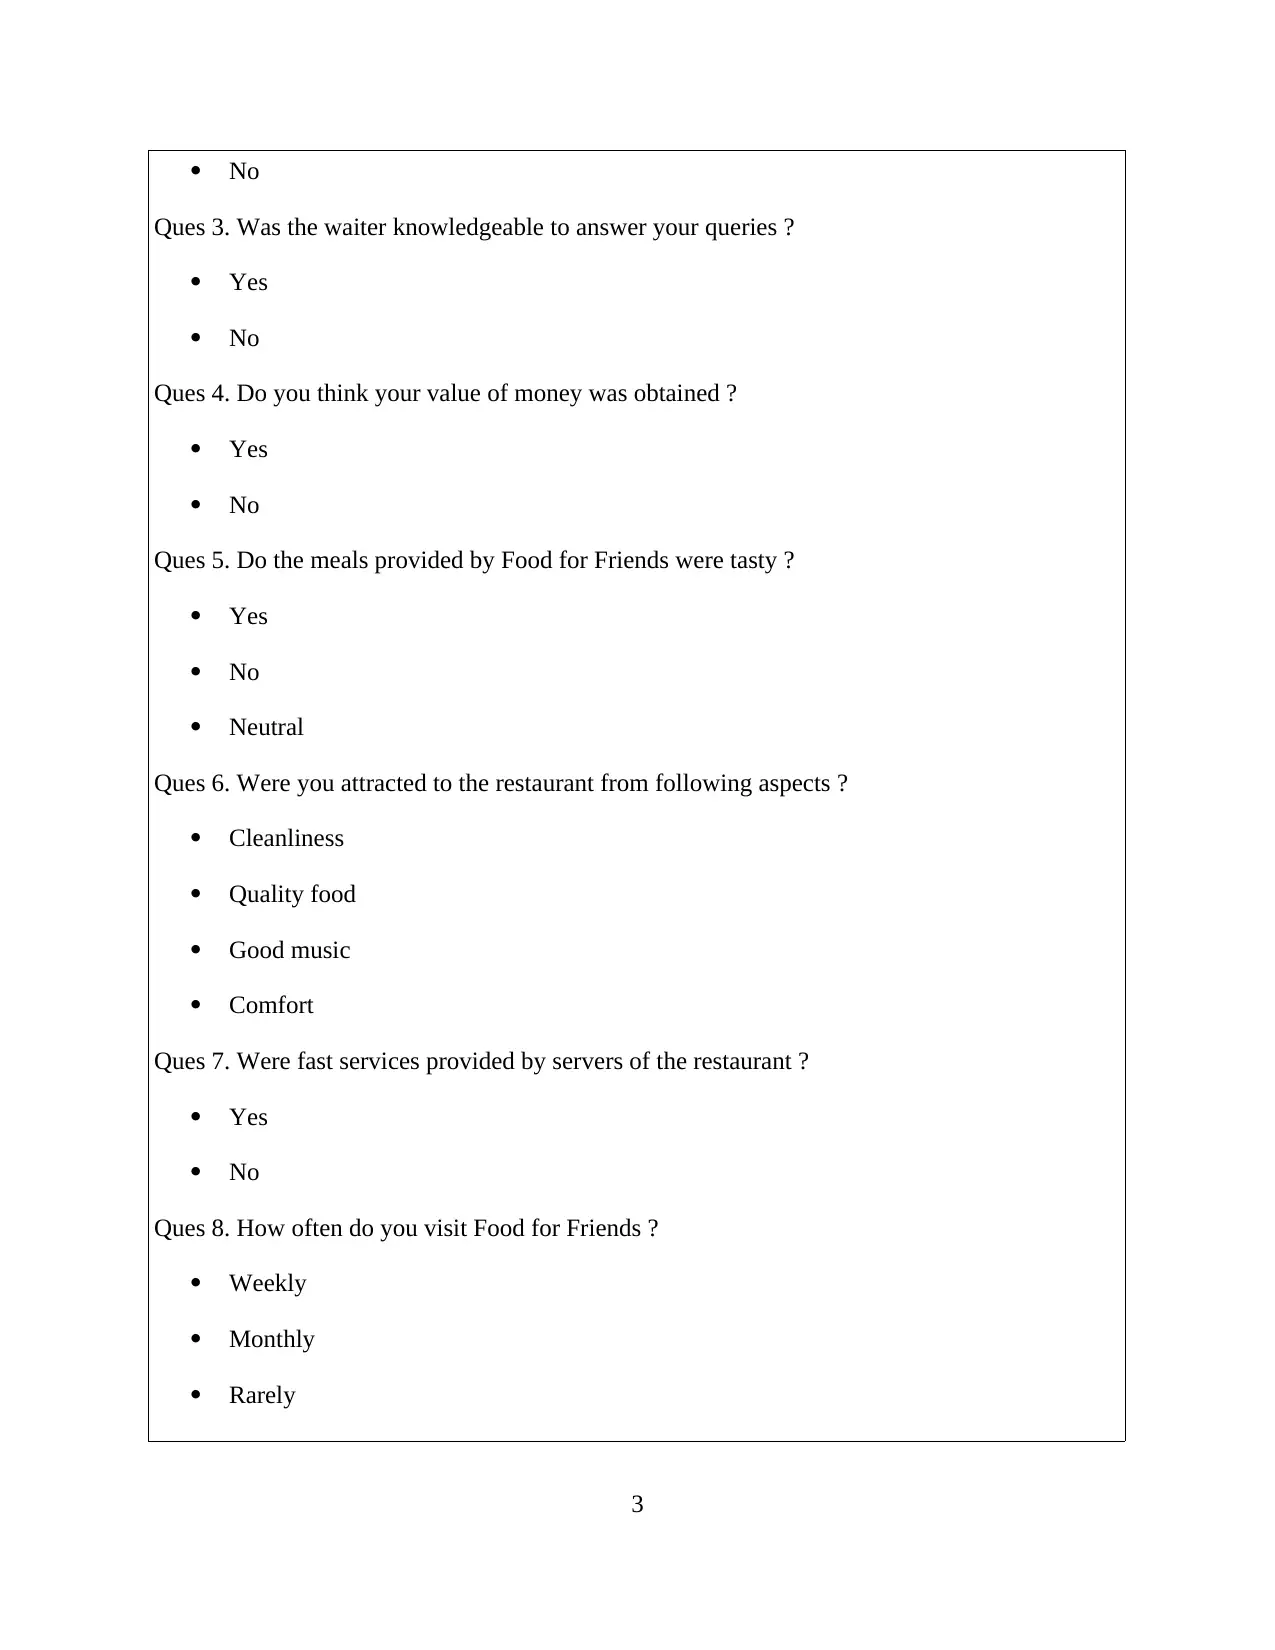
Ques 3. Was the waiter knowledgeable to answer your queries ?
Yes
No
Ques 4. Do you think your value of money was obtained ?
Yes
No
Ques 5. Do the meals provided by Food for Friends were tasty ?
Yes
No
Neutral
Ques 6. Were you attracted to the restaurant from following aspects ?
Cleanliness
Quality food
Good music
Comfort
Ques 7. Were fast services provided by servers of the restaurant ?
Yes
No
Ques 8. How often do you visit Food for Friends ?
Weekly
Monthly
Rarely
3
Other
Ques 9. What was the best aspect you like about our restaurant ?
Food
Service
Low prices
Location
Ques 10. From the following marketing activities, which attracted you to visit Food for
Friends ?
Social media
Advertisement in newspapers
Discounting factor
Positive feedback from existing customers
Any other reason
Ques 11. Please provide your valuable advices and suggestions to improve upon the services
and quality of food to enhance your satisfaction
__________________________________________________________
2.1 Producing summary of raw data
Raw data is collected so that information may be gathered in effective manner. This is
required so that adequate information can be gathered and Food for Friends can plan for
launching of restaurant in London with much ease. This is essential as without having
authenticated data, perfect decision regarding opening of second chain in the city cannot be
made. Thus, primary and secondary data is gathered for the purpose. Annual report of previous
years are segregated to analyse performance of the company based on the parameters of revenue
and profit from 2011 to 2017 financial years. The presentation of raw data is listed below:
Table 1 : Raw data for calculation
4
⊘ This is a preview!⊘
Do you want full access?
Subscribe today to unlock all pages.
Trusted by 1+ million students worldwide
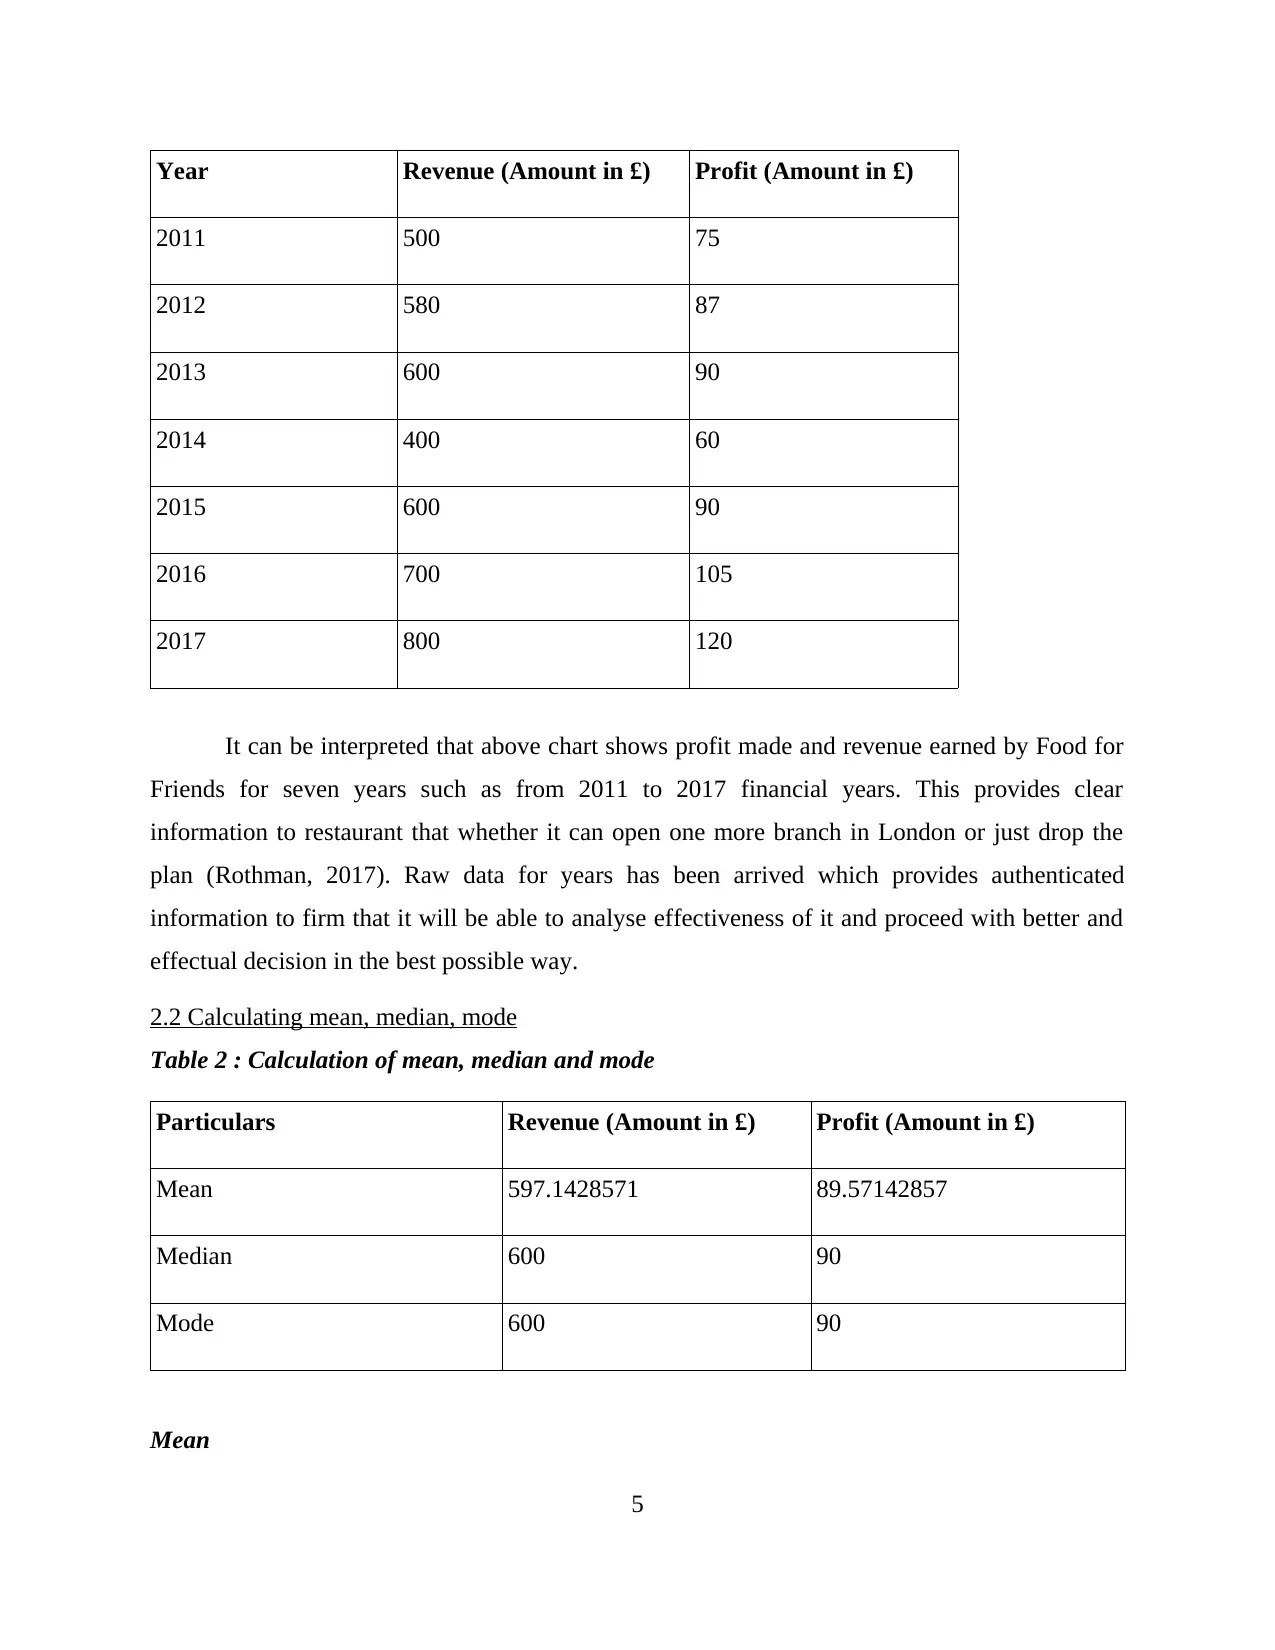
Year Revenue (Amount in £) Profit (Amount in £)
2011 500 75
2012 580 87
2013 600 90
2014 400 60
2015 600 90
2016 700 105
2017 800 120
It can be interpreted that above chart shows profit made and revenue earned by Food for
Friends for seven years such as from 2011 to 2017 financial years. This provides clear
information to restaurant that whether it can open one more branch in London or just drop the
plan (Rothman, 2017). Raw data for years has been arrived which provides authenticated
information to firm that it will be able to analyse effectiveness of it and proceed with better and
effectual decision in the best possible way.
2.2 Calculating mean, median, mode
Table 2 : Calculation of mean, median and mode
Particulars Revenue (Amount in £) Profit (Amount in £)
Mean 597.1428571 89.57142857
Median 600 90
Mode 600 90
Mean
5
Paraphrase This Document
Need a fresh take? Get an instant paraphrase of this document with our AI Paraphraser
Mean is the simplest method for carrying out the average data from entire set of data
which is helpful if there is large quantum of data. Thus, it is effective technique of central
tendency to get desired results in the best possible way. It can be analysed that value of mean
extracted out is 597.14 for revenue earned and 89.57 for profit made in past years. Thus, it has
overall good performance.
Median
Median is the value which is obtained from the data set representing middle value from it.
In simple words, median is the middle value derived from the data set. This is effective technique
as it divides whole data in two equal parts for generating sufficient information. It can be
interpreted from the above table that median value on the basis of revenue is 600 and on the
other hand, for profit is 90. Performance is on upward trend (Thirumalai and Senthilkumar,
2017).
Mode
Mode is the simplest calculation of central tendency and provide effective results to
restaurant as it calculates most frequently occurred in the data set. It can be interpreted that mode
value in terms of revenue earned is 600 and in terms of profit made is 90. Thus, on the basis of
measure of central tendency, performance of Food for Friends has increased in past several
years.
2.3 Measures of Dispersion
Table 3 : Calculation of standard deviation
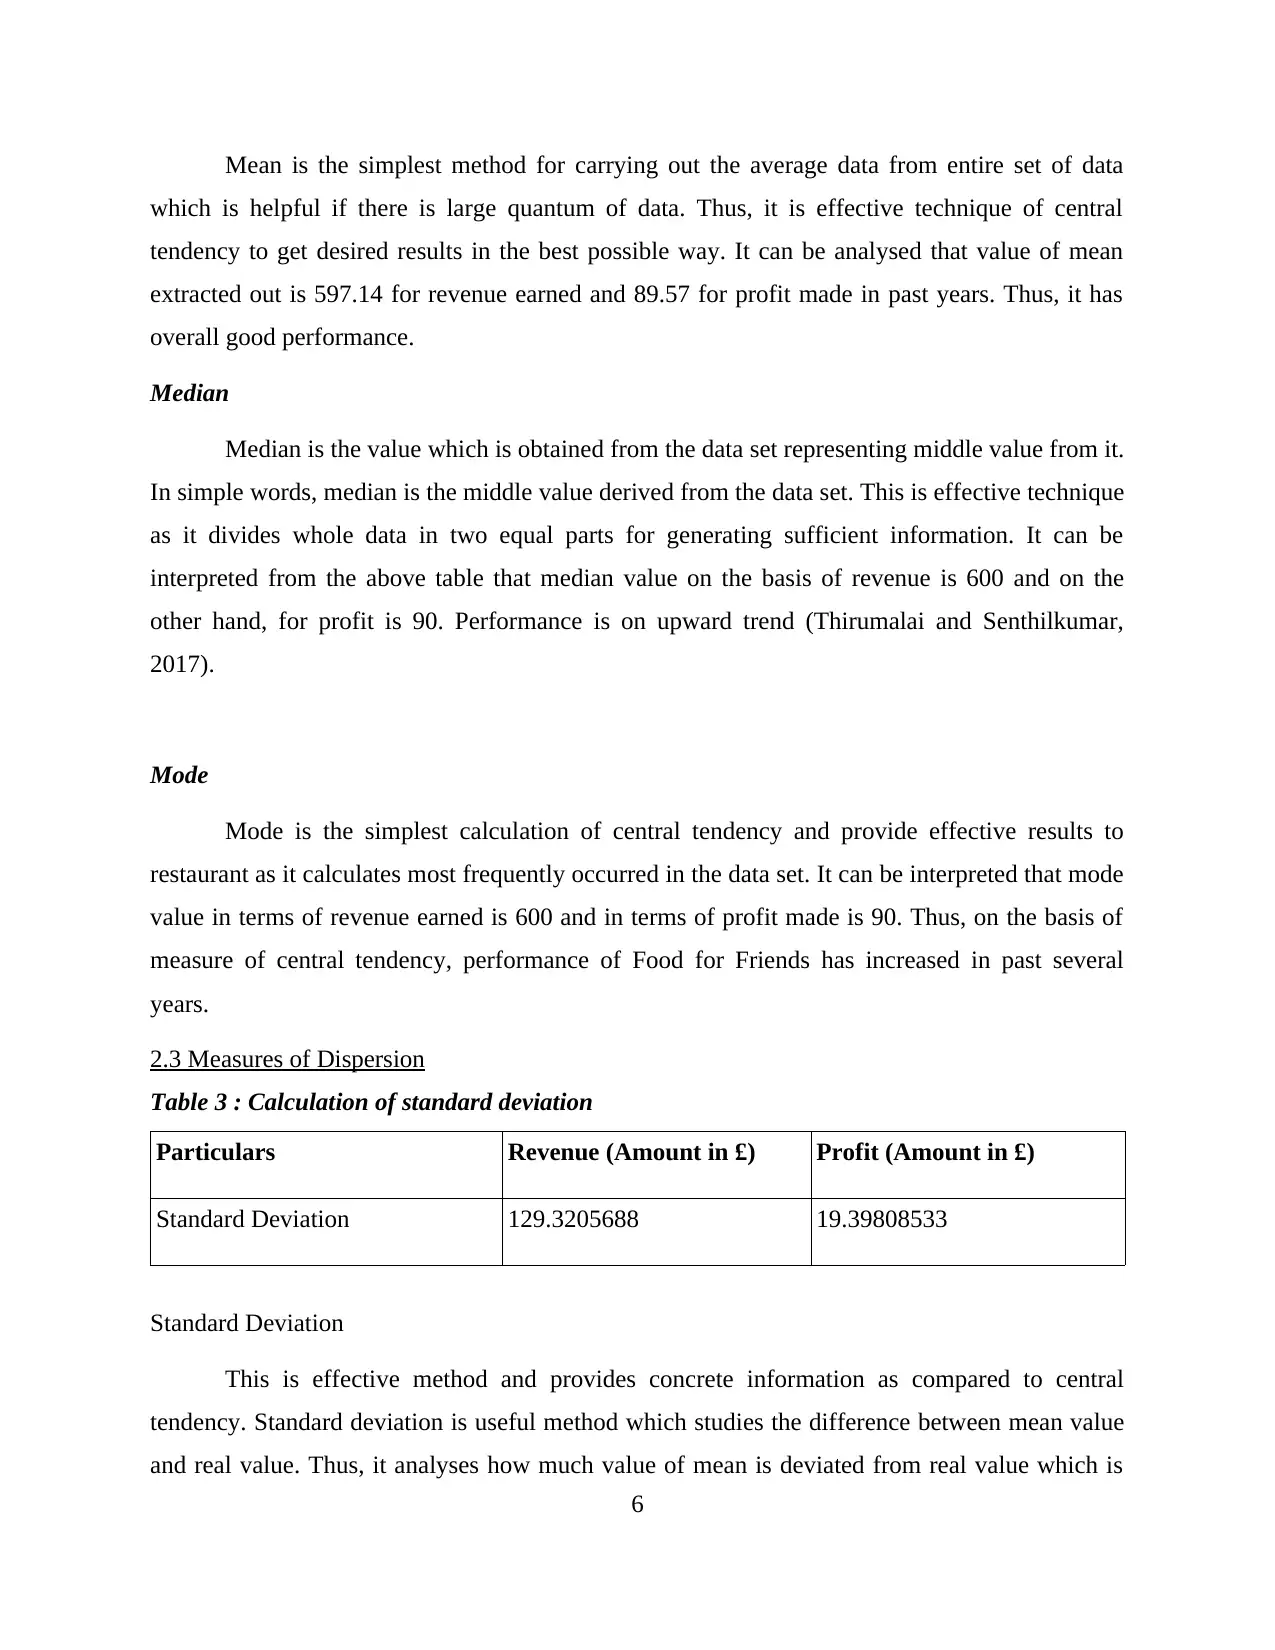
Particulars Revenue (Amount in £) Profit (Amount in £)
Standard Deviation 129.3205688 19.39808533
Standard Deviation
This is effective method and provides concrete information as compared to central
tendency. Standard deviation is useful method which studies the difference between mean value
and real value. Thus, it analyses how much value of mean is deviated from real value which is
6
which is helpful if there is large quantum of data. Thus, it is effective technique of central
tendency to get desired results in the best possible way. It can be analysed that value of mean
extracted out is 597.14 for revenue earned and 89.57 for profit made in past years. Thus, it has
overall good performance.
Median
Median is the value which is obtained from the data set representing middle value from it.
In simple words, median is the middle value derived from the data set. This is effective technique
as it divides whole data in two equal parts for generating sufficient information. It can be
interpreted from the above table that median value on the basis of revenue is 600 and on the
other hand, for profit is 90. Performance is on upward trend (Thirumalai and Senthilkumar,
2017).
Mode
Mode is the simplest calculation of central tendency and provide effective results to
restaurant as it calculates most frequently occurred in the data set. It can be interpreted that mode
value in terms of revenue earned is 600 and in terms of profit made is 90. Thus, on the basis of
measure of central tendency, performance of Food for Friends has increased in past several
years.
2.3 Measures of Dispersion
Table 3 : Calculation of standard deviation
Particulars Revenue (Amount in £) Profit (Amount in £)
Standard Deviation 129.3205688 19.39808533
Standard Deviation
This is effective method and provides concrete information as compared to central
tendency. Standard deviation is useful method which studies the difference between mean value
and real value. Thus, it analyses how much value of mean is deviated from real value which is
6
the basic requirement of Food for Friends to extract correct information. Market analysts
conveys that higher the difference between mean and real value, more beneficial for the firm to
take enhanced decision for the betterment of it. Thus, it can be analysed that firm's standard
deviation in terms of profit made is 19.39 and revenue earned is 129.32 which is highly deviated.
Thus, it can be said that performance of Food for Friends is quite good in the past seven years.
Hence, it can opt for opening second chain in London for more profit earning with much ease.
2.4 Computation of quartile, percentile, correlation
Calculation is done with respect to quartile, percentile and correlation which help to
identify and determine performance of restaurant in effective manner. Various calculations are
listed below-
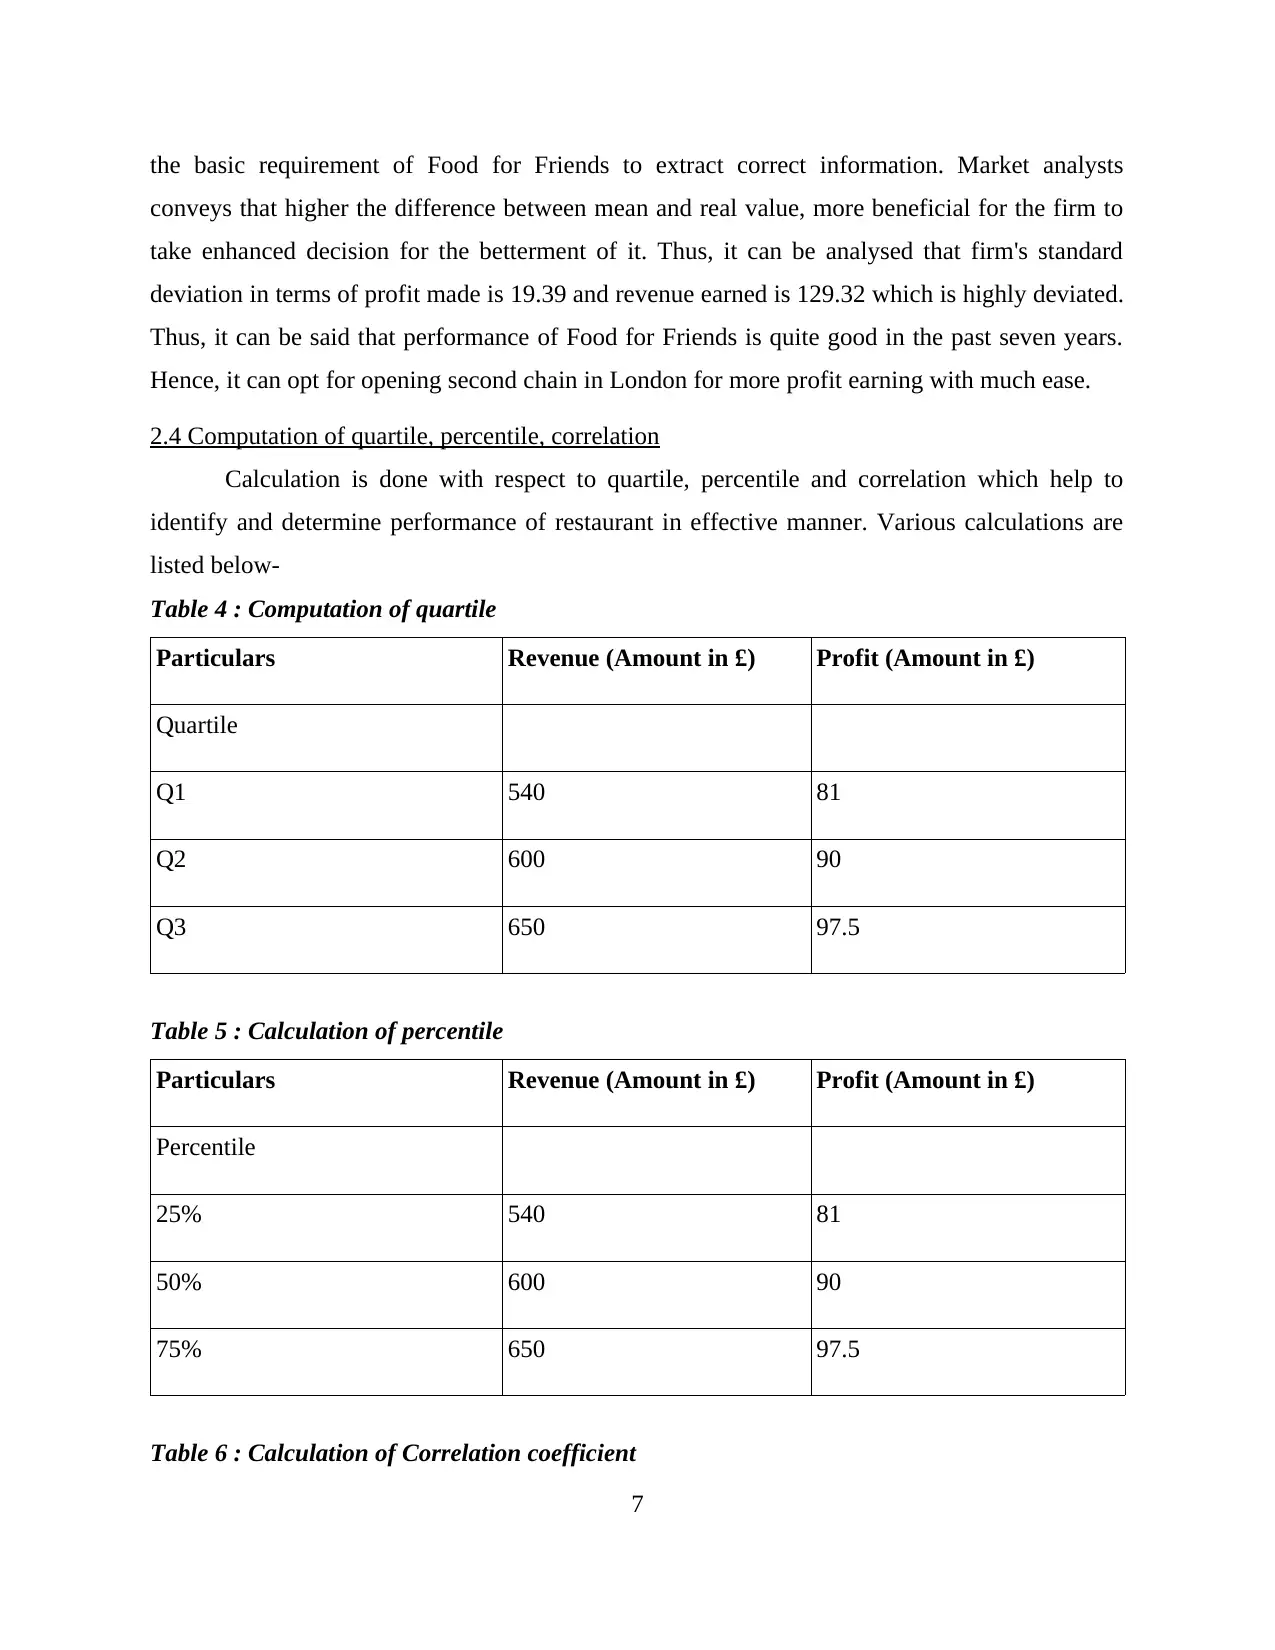
Table 4 : Computation of quartile
Particulars Revenue (Amount in £) Profit (Amount in £)
Quartile
Q1 540 81
Q2 600 90
Q3 650 97.5
Table 5 : Calculation of percentile
Particulars Revenue (Amount in £) Profit (Amount in £)
Percentile
25% 540 81
50% 600 90
75% 650 97.5
Table 6 : Calculation of Correlation coefficient
7
conveys that higher the difference between mean and real value, more beneficial for the firm to
take enhanced decision for the betterment of it. Thus, it can be analysed that firm's standard
deviation in terms of profit made is 19.39 and revenue earned is 129.32 which is highly deviated.
Thus, it can be said that performance of Food for Friends is quite good in the past seven years.
Hence, it can opt for opening second chain in London for more profit earning with much ease.
2.4 Computation of quartile, percentile, correlation
Calculation is done with respect to quartile, percentile and correlation which help to
identify and determine performance of restaurant in effective manner. Various calculations are
listed below-
Table 4 : Computation of quartile
Particulars Revenue (Amount in £) Profit (Amount in £)
Quartile
Q1 540 81
Q2 600 90
Q3 650 97.5
Table 5 : Calculation of percentile
Particulars Revenue (Amount in £) Profit (Amount in £)
Percentile
25% 540 81
50% 600 90
75% 650 97.5
Table 6 : Calculation of Correlation coefficient
7
⊘ This is a preview!⊘
Do you want full access?
Subscribe today to unlock all pages.
Trusted by 1+ million students worldwide
Particulars Revenue (Amount in £) Profit (Amount in £)
Sales 1.00 1
Profit 1 1.00
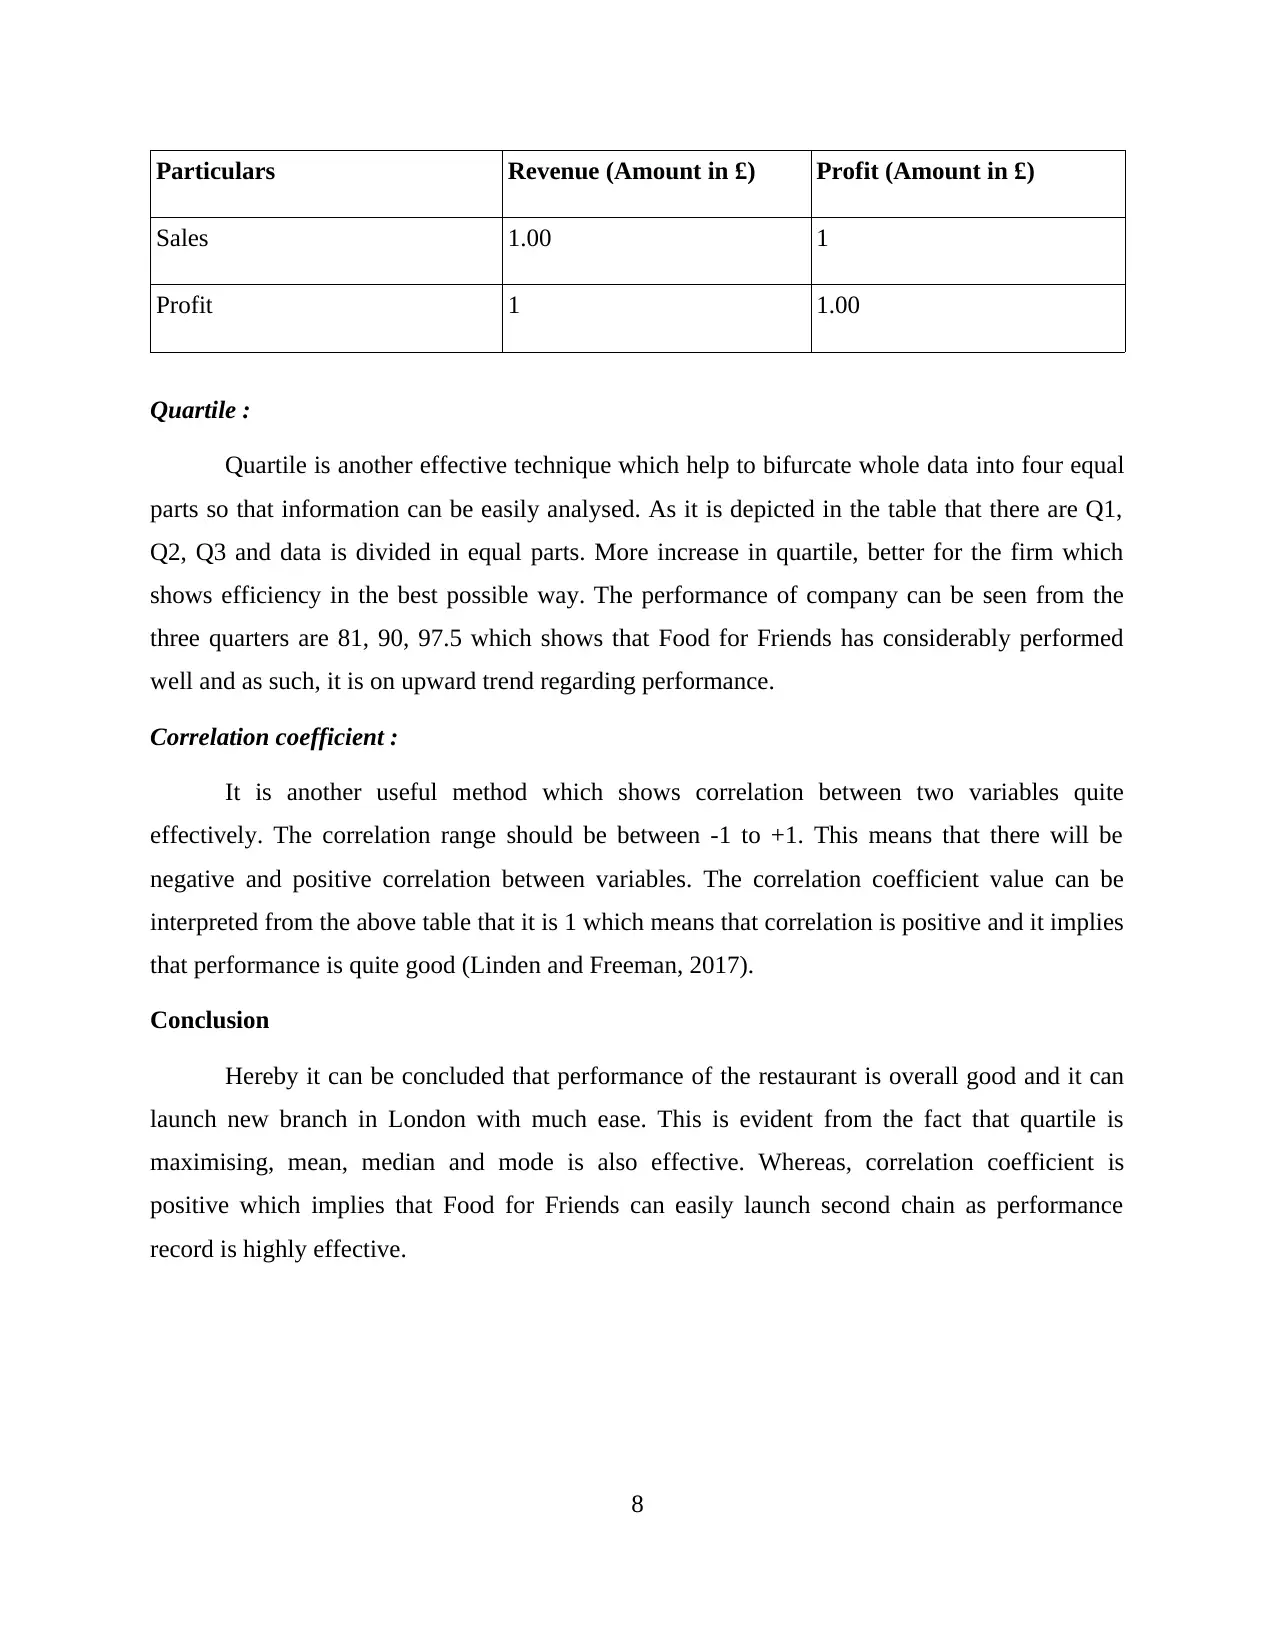
Quartile :
Quartile is another effective technique which help to bifurcate whole data into four equal
parts so that information can be easily analysed. As it is depicted in the table that there are Q1,
Q2, Q3 and data is divided in equal parts. More increase in quartile, better for the firm which
shows efficiency in the best possible way. The performance of company can be seen from the
three quarters are 81, 90, 97.5 which shows that Food for Friends has considerably performed
well and as such, it is on upward trend regarding performance.
Correlation coefficient :
It is another useful method which shows correlation between two variables quite
effectively. The correlation range should be between -1 to +1. This means that there will be
negative and positive correlation between variables. The correlation coefficient value can be
interpreted from the above table that it is 1 which means that correlation is positive and it implies
that performance is quite good (Linden and Freeman, 2017).
Conclusion
Hereby it can be concluded that performance of the restaurant is overall good and it can
launch new branch in London with much ease. This is evident from the fact that quartile is
maximising, mean, median and mode is also effective. Whereas, correlation coefficient is
positive which implies that Food for Friends can easily launch second chain as performance
record is highly effective.
8
Sales 1.00 1
Profit 1 1.00
Quartile :
Quartile is another effective technique which help to bifurcate whole data into four equal
parts so that information can be easily analysed. As it is depicted in the table that there are Q1,
Q2, Q3 and data is divided in equal parts. More increase in quartile, better for the firm which
shows efficiency in the best possible way. The performance of company can be seen from the
three quarters are 81, 90, 97.5 which shows that Food for Friends has considerably performed
well and as such, it is on upward trend regarding performance.
Correlation coefficient :
It is another useful method which shows correlation between two variables quite
effectively. The correlation range should be between -1 to +1. This means that there will be
negative and positive correlation between variables. The correlation coefficient value can be
interpreted from the above table that it is 1 which means that correlation is positive and it implies
that performance is quite good (Linden and Freeman, 2017).
Conclusion
Hereby it can be concluded that performance of the restaurant is overall good and it can
launch new branch in London with much ease. This is evident from the fact that quartile is
maximising, mean, median and mode is also effective. Whereas, correlation coefficient is
positive which implies that Food for Friends can easily launch second chain as performance
record is highly effective.
8
Paraphrase This Document
Need a fresh take? Get an instant paraphrase of this document with our AI Paraphraser
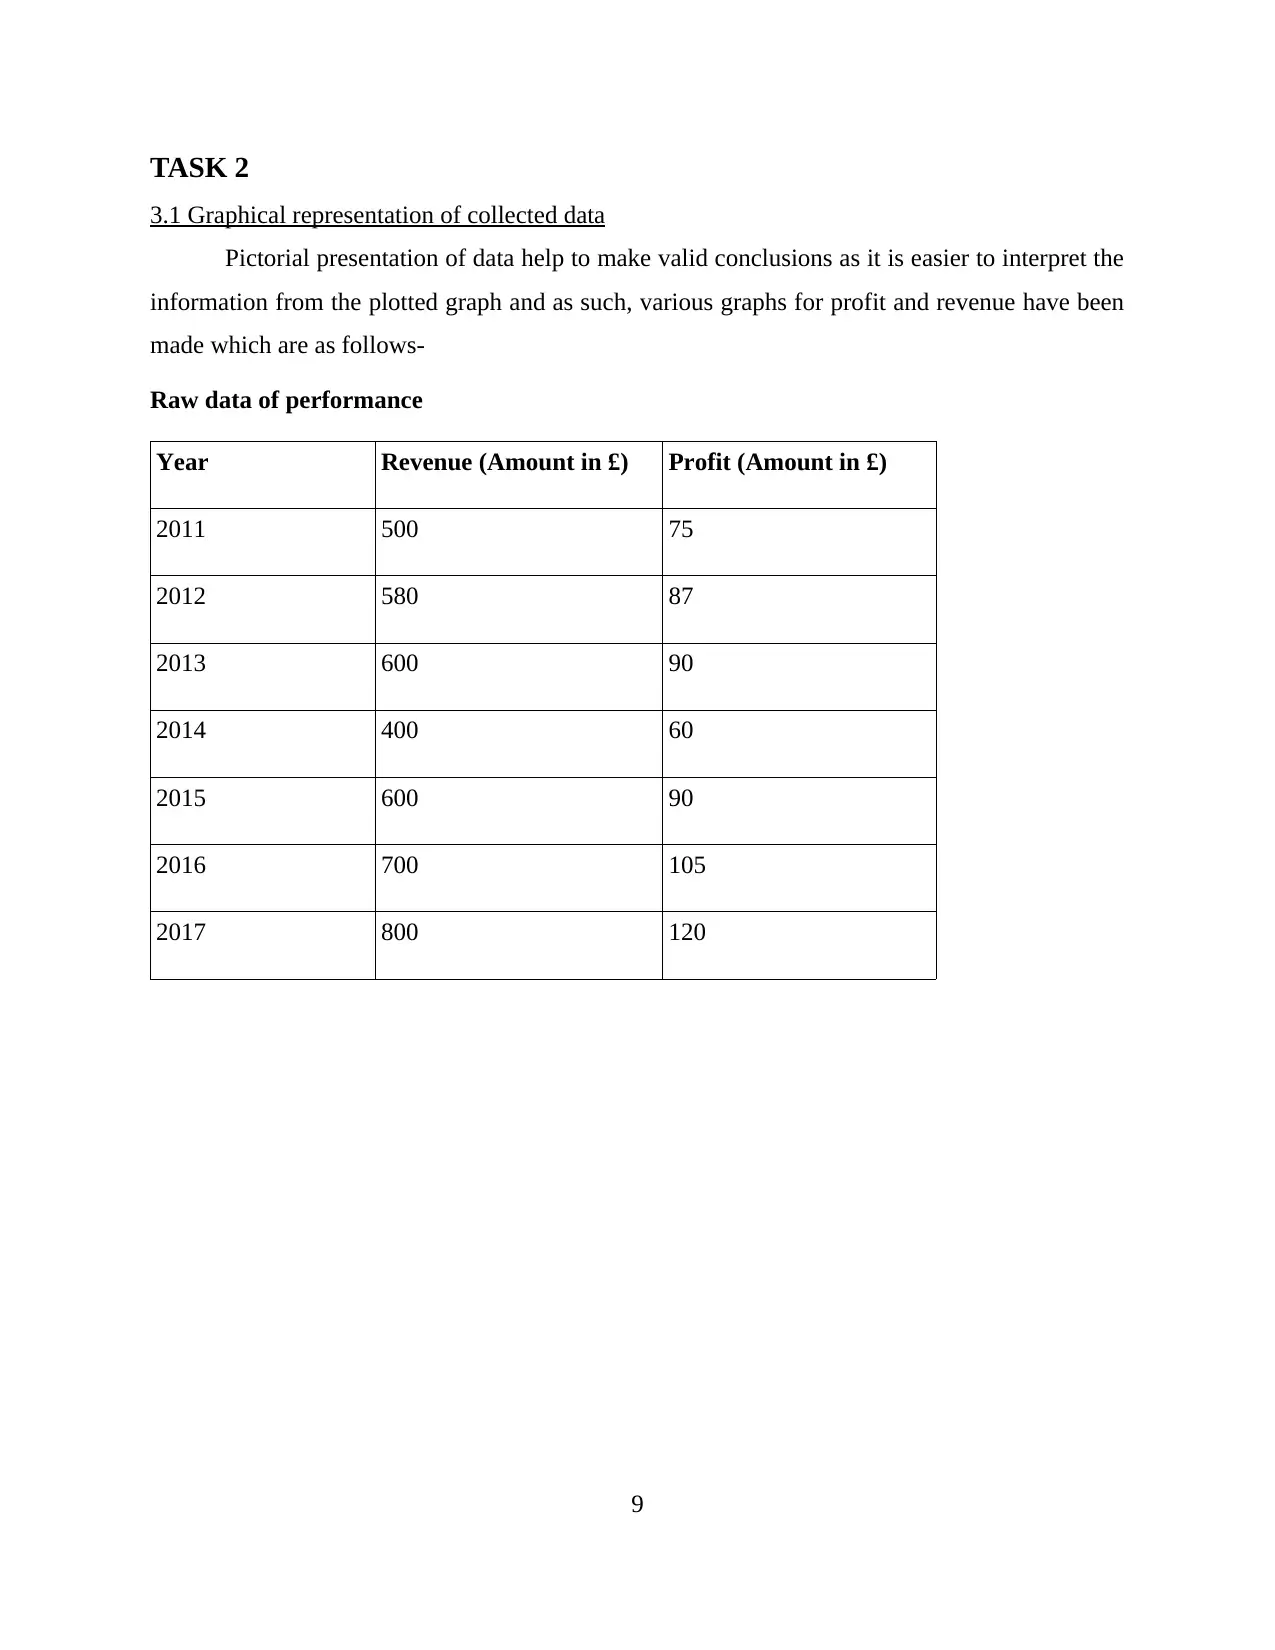
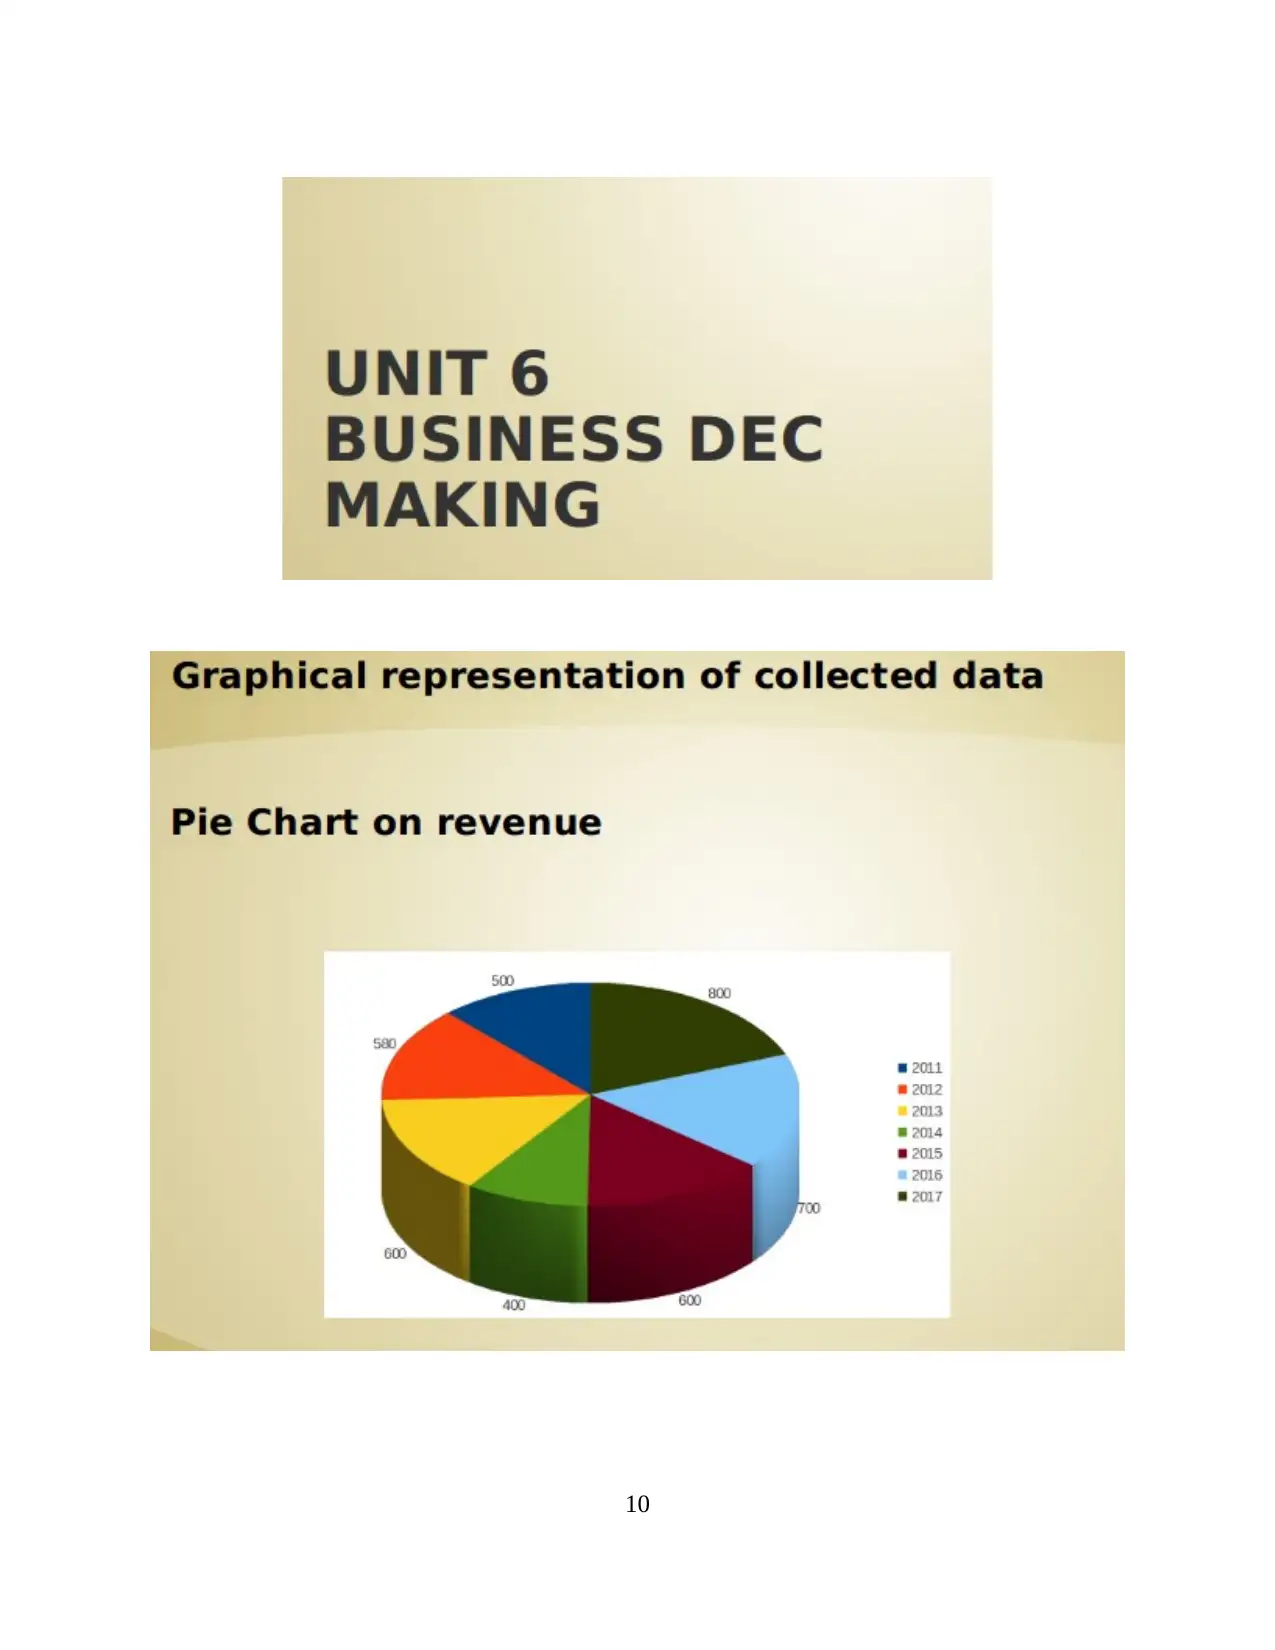
TASK 2
3.1 Graphical representation of collected data
Pictorial presentation of data help to make valid conclusions as it is easier to interpret the
information from the plotted graph and as such, various graphs for profit and revenue have been
made which are as follows-
Raw data of performance
Year Revenue (Amount in £) Profit (Amount in £)
2011 500 75
2012 580 87
2013 600 90
2014 400 60
2015 600 90
2016 700 105
2017 800 120
9
10
⊘ This is a preview!⊘
Do you want full access?
Subscribe today to unlock all pages.
Trusted by 1+ million students worldwide
1 out of 27
Related Documents


Your All-in-One AI-Powered Toolkit for Academic Success.
+13062052269
info@desklib.com
Available 24*7 on WhatsApp / Email
![[object Object]](/_next/static/media/star-bottom.7253800d.svg)
Unlock your academic potential
Copyright © 2020–2026 A2Z Services. All Rights Reserved. Developed and managed by ZUCOL.