Business Decision Making Report: Analyzing Data for Business Decisions
VerifiedAdded on 2020/07/22
|18
|3963
|51
Report
AI Summary
This report addresses business decision-making for a hypothetical company, Balti Palace, planning to expand its operations. The report begins with a plan for gathering both primary and secondary data, detailing survey methodologies and sampling frames, and includes a designed questionnaire. The core of the report involves data analysis, summarizing survey results, and drawing valid conclusions using measures of central tendency and dispersion. The student uses statistical tools to analyze sales and net profit data, calculate means, medians, and modes, and presents the findings. Furthermore, the report includes the creation of graphs using spreadsheets to visualize and interpret the data, including the use of trend lines for forecasting. The report also touches upon financial tools and project planning for decision-making, concluding with a formal business report summarizing the key findings and recommendations for Balti Palace's business expansion. The report covers various aspects of decision making, from data gathering to analysis and final reporting. This assignment solution provides a comprehensive overview of business decision making, data analysis, and strategic planning.
BUSINESS DECISION MAKING
Paraphrase This Document
Need a fresh take? Get an instant paraphrase of this document with our AI Paraphraser
Table of Contents
INTRODUCTION ..........................................................................................................................1
TASK 1............................................................................................................................................1
1.1 Plan for gathering of primary and secondary data for mention business problem...........1
1.2 Survey methodology and sampling frame used................................................................2
1.3 Prepare questionnaire for given business problem...........................................................3
TASK 2............................................................................................................................................5
2.1 Develop information for decision making through summarising data.............................5
2.2 Results to draw valid conclusions in business context.....................................................6
2.3 Data using measures of dispersion to inform...................................................................8
2.4 Quartiles, percentiles and correlation coefficient are used to draw useful conclusions...8
TASK 3............................................................................................................................................9
3.1 Graphs using Spreadsheets and draw valid conclusions based on information derived. .9
3.2 Trend lines in spreadsheet graphs to assist in forecasting for particular business
information...........................................................................................................................11
3.3 Covered in PPT...............................................................................................................11
3.4 Formal business report...................................................................................................11
TASK 4..........................................................................................................................................12
4.1 Appropriate information processing tools......................................................................12
4.2 Project plan for an activity and ascertain critical path...................................................12
4.3 Financial tools for decision making...............................................................................13
CONCLUSION..............................................................................................................................14
REFERENCES..............................................................................................................................15
.......................................................................................................................................................16
INTRODUCTION
Decision making is a necessary and integral part of modern management. It is an
important part which is necessary after having proper research as well as applying capabilities
through talented or expert staff in a business firm. Balti palace wants to start its one unit in
London, but before opining a new firm, it is necessary to this company to do survey or
conducting a research regarding that place where Balti palace is going to start its business in an
effective manner (Barlett, 2016). From this, Balti palace needs to conduct a survey for collecting
some necessary or accurate data so that company can develop effective strategies for the purpose
of enhancing business. In order to do this, it has been observed that business needs an effective
process of decision making so that company can achieve it sets objectives and aim with in a
specific time period.
TASK 1
1.1 Plan for gathering of primary and secondary data for mention business problem
Data collection plan is developed after the research so from this the decision related to
business can be taken in an effective or proper manner. It also require to make business
retainable as well as profitable. In context to this, it is noticed that the process of data collection
is not effective so it is necessary to the executives of business to frame all decisions in a proper
or appropriate manner. There are two methods which are helpful in gathering the data or
information and these are primary and secondary.
Primary data- This type of data is collected for first time. Primary data is a fresh data which is
used first time. It needs more attention at the time of gathering data through this primary
technique. During gathering data, it needs more attention (Bayne and Woolcock, 2011). Under
this, more time and also cost consumed. In order to collect the relevant data, researcher or
manager needs more time. There are many different ways to collect primary data which are given
below:
Questionnaire
Observation
Personal interviews
Survey
1
⊘ This is a preview!⊘
Do you want full access?
Subscribe today to unlock all pages.
Trusted by 1+ million students worldwide
Secondary data- This data is already present and also determined through the various persons.
Under this method, data can be gathered through the internal as well as external source.
Secondary data is very cheap and easy to collect for research. The data which is used by the
researcher already used. There is no more time consumed and it is easy to take information for
research. There are various ways of collection data which are mention below:
Internet
Books
Journals
Before gathering data, there are different methods mention below which are necessary in
gathering information and data:
Decision on methods- Under this, there are some different methods which are necessary
to execute in context to collect data. In this, qualitative and quantitative both are the
defective ways to collect data (Brown and et. al., 2010). In quantitative data is collective
in teams of quality. On the other hand in qualitative, data is collected in terms numbers,
quantity etc.
Before gathering information and data, there is requirement to determine regarding need
of some intend users. There are some users who can used this collected information:
Government- It used data or information in order to develop an effective plan, emerged,
execute, monitor and control economic and social programmes.
Individuals- They need information and data for doing survey. It is that type of survey
which are developed through using defined tools, concepts and also process data or information.
Businesses- In business, there is a need to information in context to do some adequate and
effective decisions which are in favour of staff members, branding services and products,
developing new plans and policies at work place.
1.2 Survey methodology and sampling frame used
Survey refers to a technique or method which is necessary to execute for collecting
information and data in an effective manner (García-Peñalvo and Conde, 2014). It is necessary
that collected data should be accurate and relevant. In context to preparing report in an effective
manner, there is a requirement to have some primary research which is helpful in providing a
valid result.
2
Paraphrase This Document
Need a fresh take? Get an instant paraphrase of this document with our AI Paraphraser
Survey methodologies- This is insistent for Balti palace business to use an effective
survey methodology in order to take some effective decisions related to the business. There are
different methods which can be used through this like for an instance personal interviews or
questionnaire. Balti palace uses these two methods for doing the research in an effective manner.
On the questionnaire, there are various kinds of questions are mentioned for the survey according
of different aspects like cost, quality and other things (Wu and Pagell, 2011).
Sample framework- In order to conducting survey, it is necessary to select a sample and
in this there are some different techniques which can used
Cluster sampling,
Random sampling
Stratifies sampling
These all are the effective methods of sample framework. But among all method, random
sampling is an effective and easiest method to gather data on the random basis from total
population and there is no systematic way to describe this (Tzeng and Huang, 2011.). The major
benefit of this ransom sampling is that there is a less chance of biasness or partially in this. So
from this, this method is used by the Balti Palace in order to conducting a survey. All collected
data is helpful in accomplishing the aims and objectives or an organisation in an effective or
systematic manner.
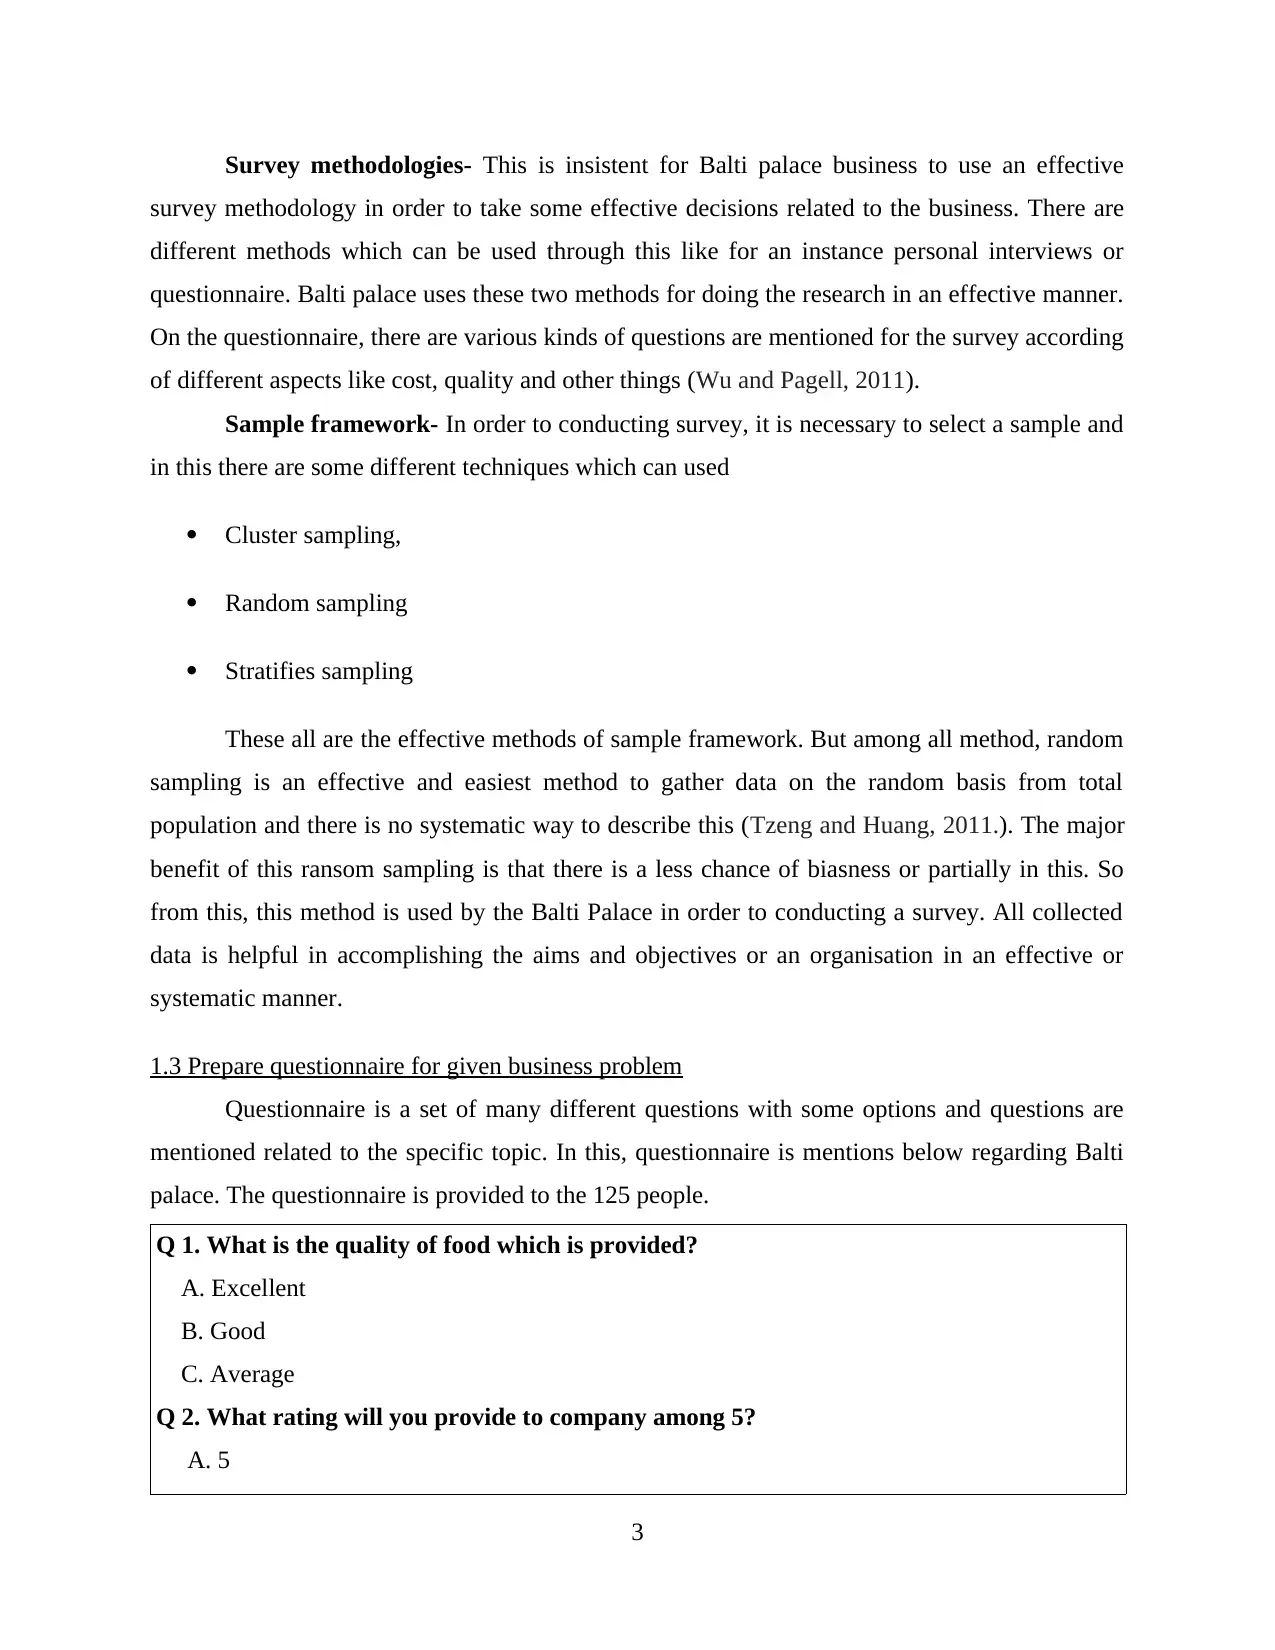
1.3 Prepare questionnaire for given business problem
Questionnaire is a set of many different questions with some options and questions are
mentioned related to the specific topic. In this, questionnaire is mentions below regarding Balti
palace. The questionnaire is provided to the 125 people.
Q 1. What is the quality of food which is provided?
A. Excellent
B. Good
C. Average
Q 2. What rating will you provide to company among 5?
A. 5
3
survey methodology in order to take some effective decisions related to the business. There are
different methods which can be used through this like for an instance personal interviews or
questionnaire. Balti palace uses these two methods for doing the research in an effective manner.
On the questionnaire, there are various kinds of questions are mentioned for the survey according
of different aspects like cost, quality and other things (Wu and Pagell, 2011).
Sample framework- In order to conducting survey, it is necessary to select a sample and
in this there are some different techniques which can used
Cluster sampling,
Random sampling
Stratifies sampling
These all are the effective methods of sample framework. But among all method, random
sampling is an effective and easiest method to gather data on the random basis from total
population and there is no systematic way to describe this (Tzeng and Huang, 2011.). The major
benefit of this ransom sampling is that there is a less chance of biasness or partially in this. So
from this, this method is used by the Balti Palace in order to conducting a survey. All collected
data is helpful in accomplishing the aims and objectives or an organisation in an effective or
systematic manner.
1.3 Prepare questionnaire for given business problem
Questionnaire is a set of many different questions with some options and questions are
mentioned related to the specific topic. In this, questionnaire is mentions below regarding Balti
palace. The questionnaire is provided to the 125 people.
Q 1. What is the quality of food which is provided?
A. Excellent
B. Good
C. Average
Q 2. What rating will you provide to company among 5?
A. 5
3
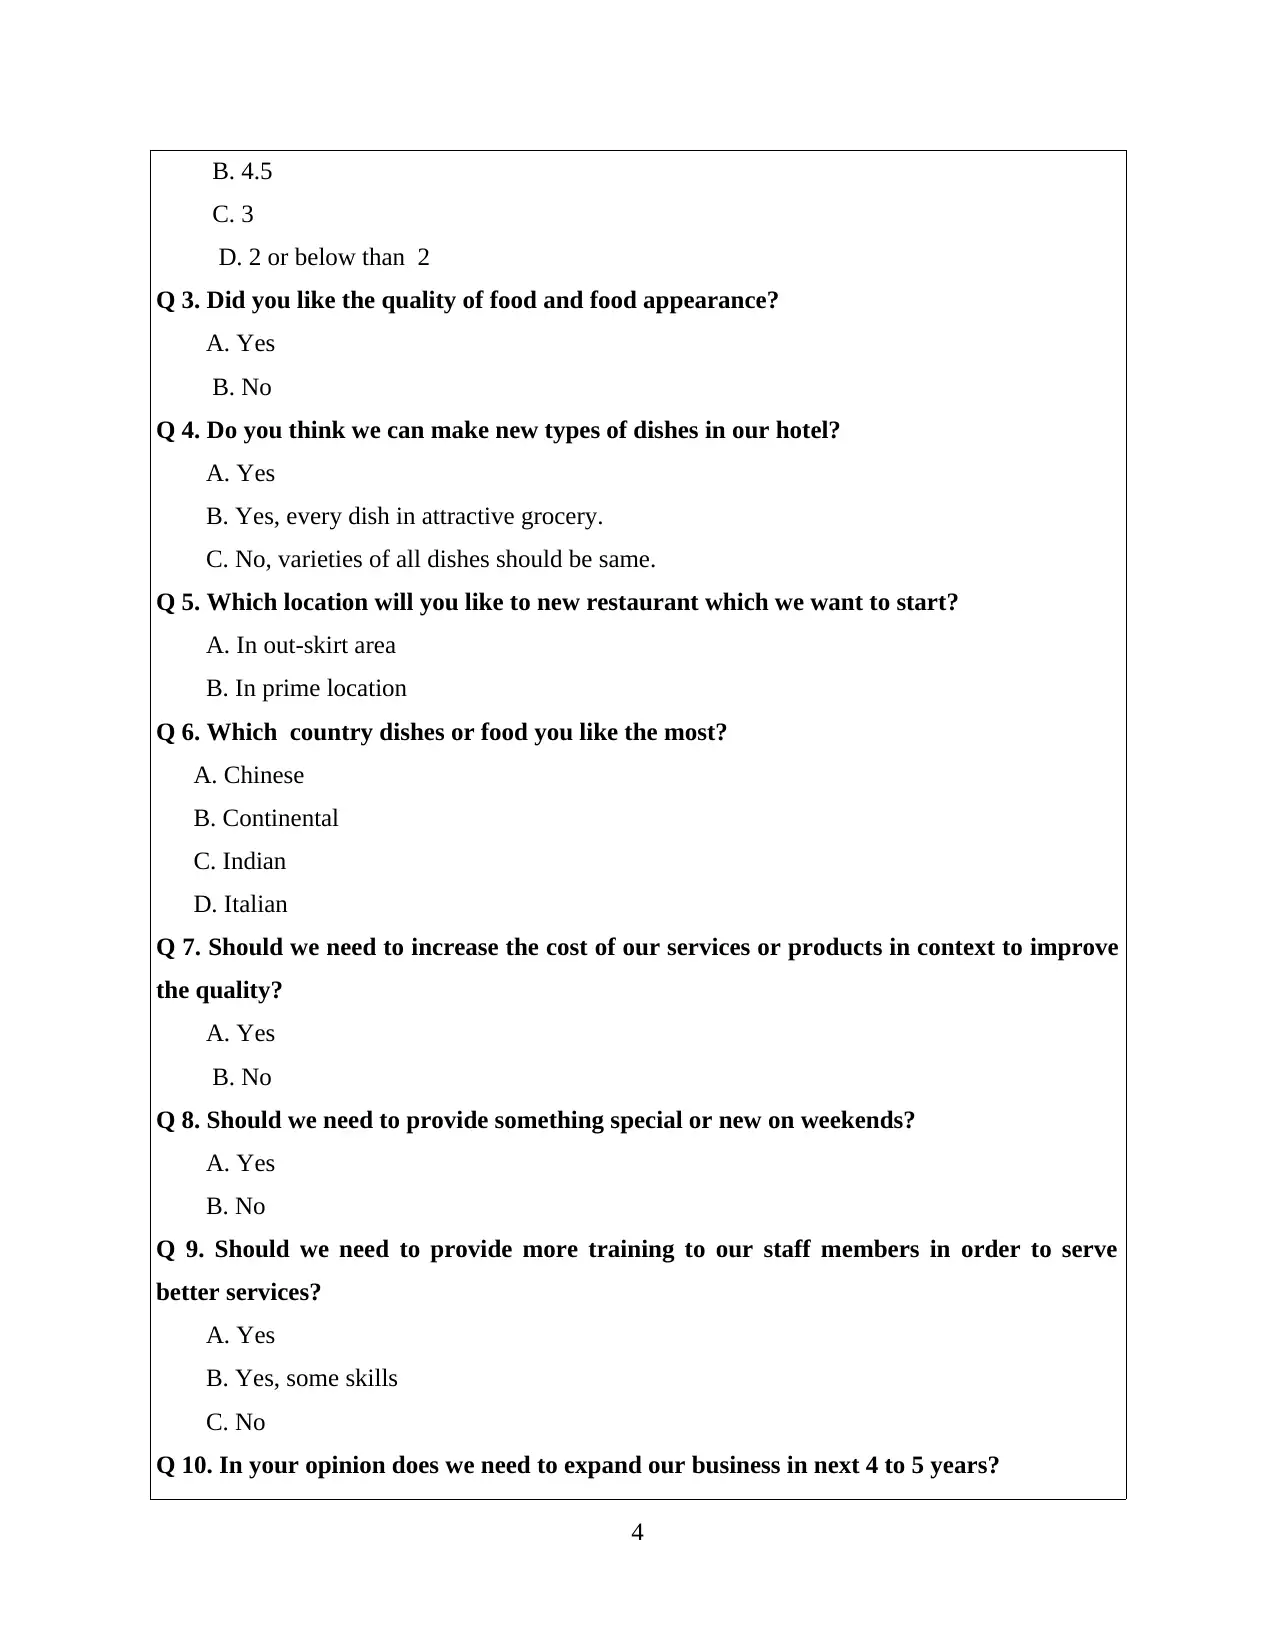
B. 4.5
C. 3
D. 2 or below than 2
Q 3. Did you like the quality of food and food appearance?
A. Yes
B. No
Q 4. Do you think we can make new types of dishes in our hotel?
A. Yes
B. Yes, every dish in attractive grocery.
C. No, varieties of all dishes should be same.
Q 5. Which location will you like to new restaurant which we want to start?
A. In out-skirt area
B. In prime location
Q 6. Which country dishes or food you like the most?
A. Chinese
B. Continental
C. Indian
D. Italian
Q 7. Should we need to increase the cost of our services or products in context to improve
the quality?
A. Yes
B. No
Q 8. Should we need to provide something special or new on weekends?
A. Yes
B. No
Q 9. Should we need to provide more training to our staff members in order to serve
better services?
A. Yes
B. Yes, some skills
C. No
Q 10. In your opinion does we need to expand our business in next 4 to 5 years?
4
⊘ This is a preview!⊘
Do you want full access?
Subscribe today to unlock all pages.
Trusted by 1+ million students worldwide
A. Yes
B. No
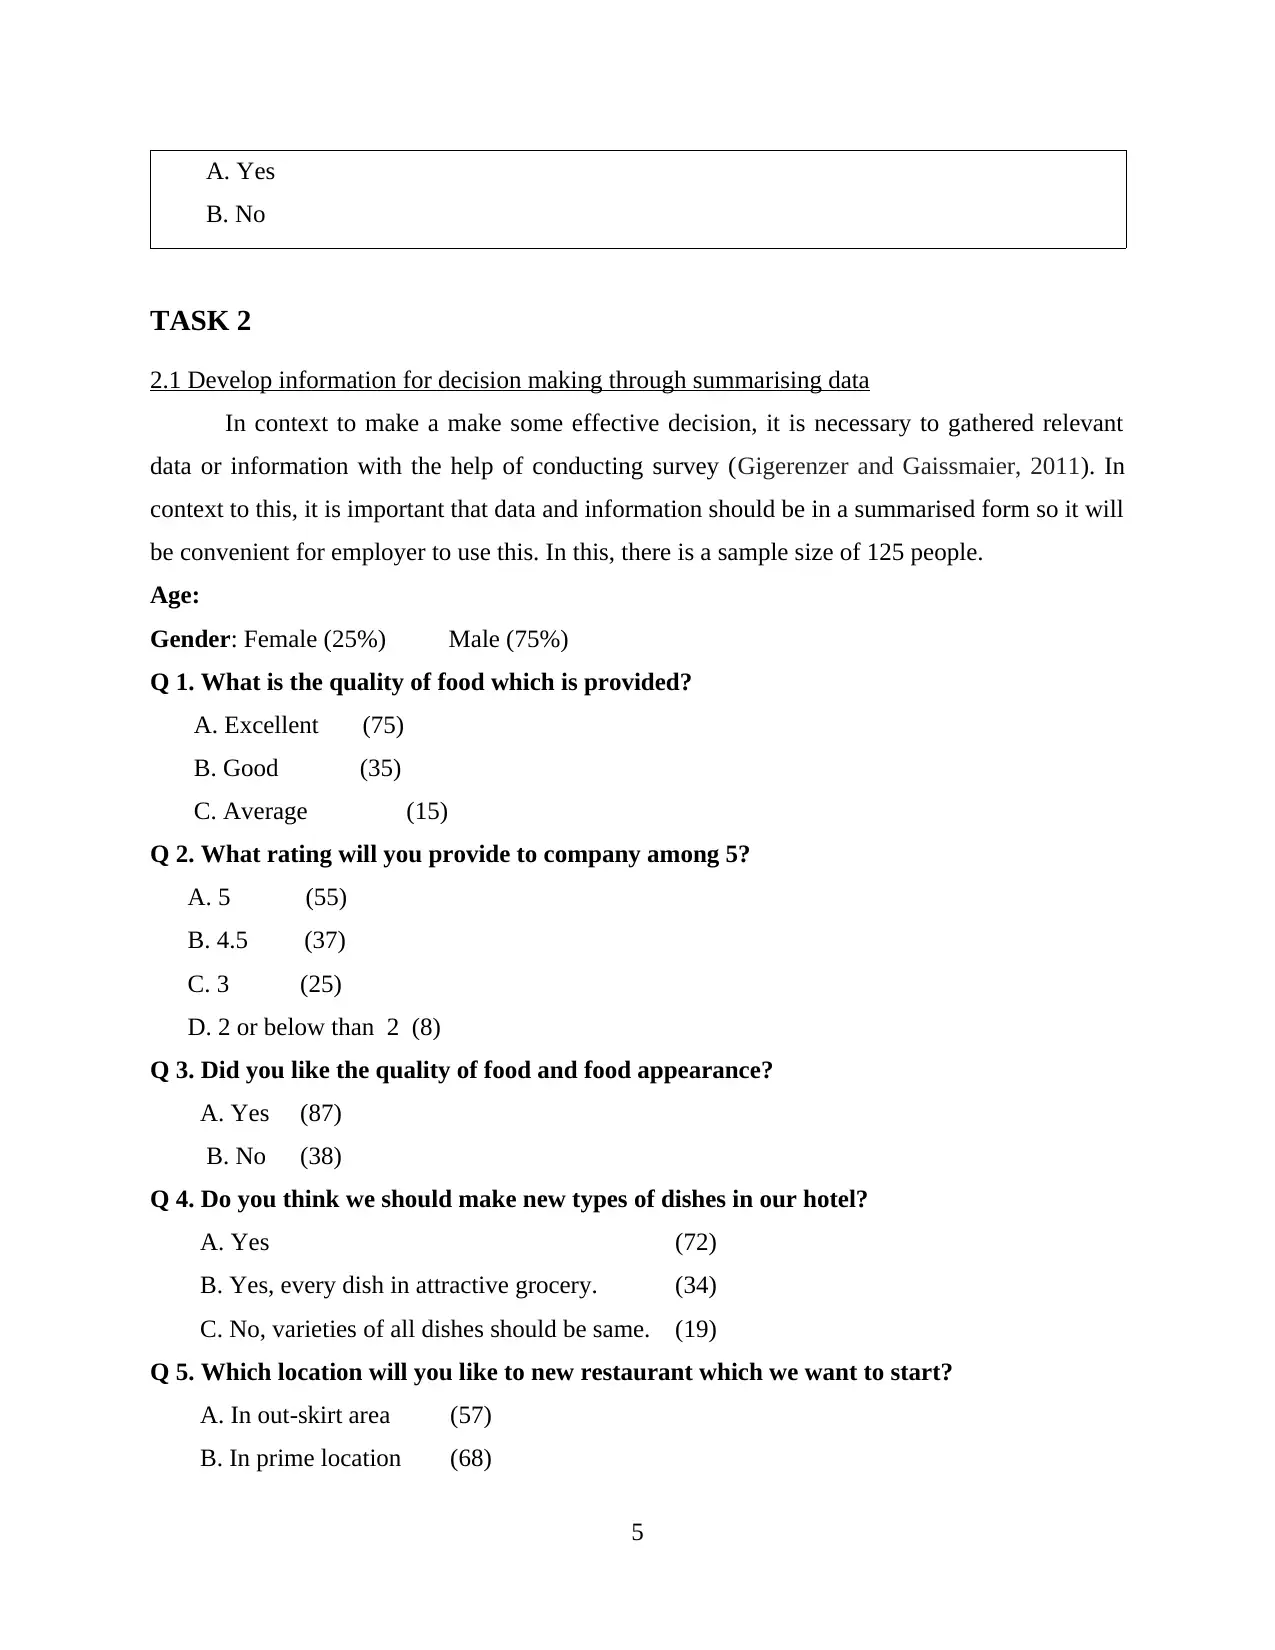
TASK 2
2.1 Develop information for decision making through summarising data
In context to make a make some effective decision, it is necessary to gathered relevant
data or information with the help of conducting survey (Gigerenzer and Gaissmaier, 2011). In
context to this, it is important that data and information should be in a summarised form so it will
be convenient for employer to use this. In this, there is a sample size of 125 people.
Age:
Gender: Female (25%) Male (75%)
Q 1. What is the quality of food which is provided?
A. Excellent (75)
B. Good (35)
C. Average (15)
Q 2. What rating will you provide to company among 5?
A. 5 (55)
B. 4.5 (37)
C. 3 (25)
D. 2 or below than 2 (8)
Q 3. Did you like the quality of food and food appearance?
A. Yes (87)
B. No (38)
Q 4. Do you think we should make new types of dishes in our hotel?
A. Yes (72)
B. Yes, every dish in attractive grocery. (34)
C. No, varieties of all dishes should be same. (19)
Q 5. Which location will you like to new restaurant which we want to start?
A. In out-skirt area (57)
B. In prime location (68)
5
B. No
TASK 2
2.1 Develop information for decision making through summarising data
In context to make a make some effective decision, it is necessary to gathered relevant
data or information with the help of conducting survey (Gigerenzer and Gaissmaier, 2011). In
context to this, it is important that data and information should be in a summarised form so it will
be convenient for employer to use this. In this, there is a sample size of 125 people.
Age:
Gender: Female (25%) Male (75%)
Q 1. What is the quality of food which is provided?
A. Excellent (75)
B. Good (35)
C. Average (15)
Q 2. What rating will you provide to company among 5?
A. 5 (55)
B. 4.5 (37)
C. 3 (25)
D. 2 or below than 2 (8)
Q 3. Did you like the quality of food and food appearance?
A. Yes (87)
B. No (38)
Q 4. Do you think we should make new types of dishes in our hotel?
A. Yes (72)
B. Yes, every dish in attractive grocery. (34)
C. No, varieties of all dishes should be same. (19)
Q 5. Which location will you like to new restaurant which we want to start?
A. In out-skirt area (57)
B. In prime location (68)
5
Paraphrase This Document
Need a fresh take? Get an instant paraphrase of this document with our AI Paraphraser
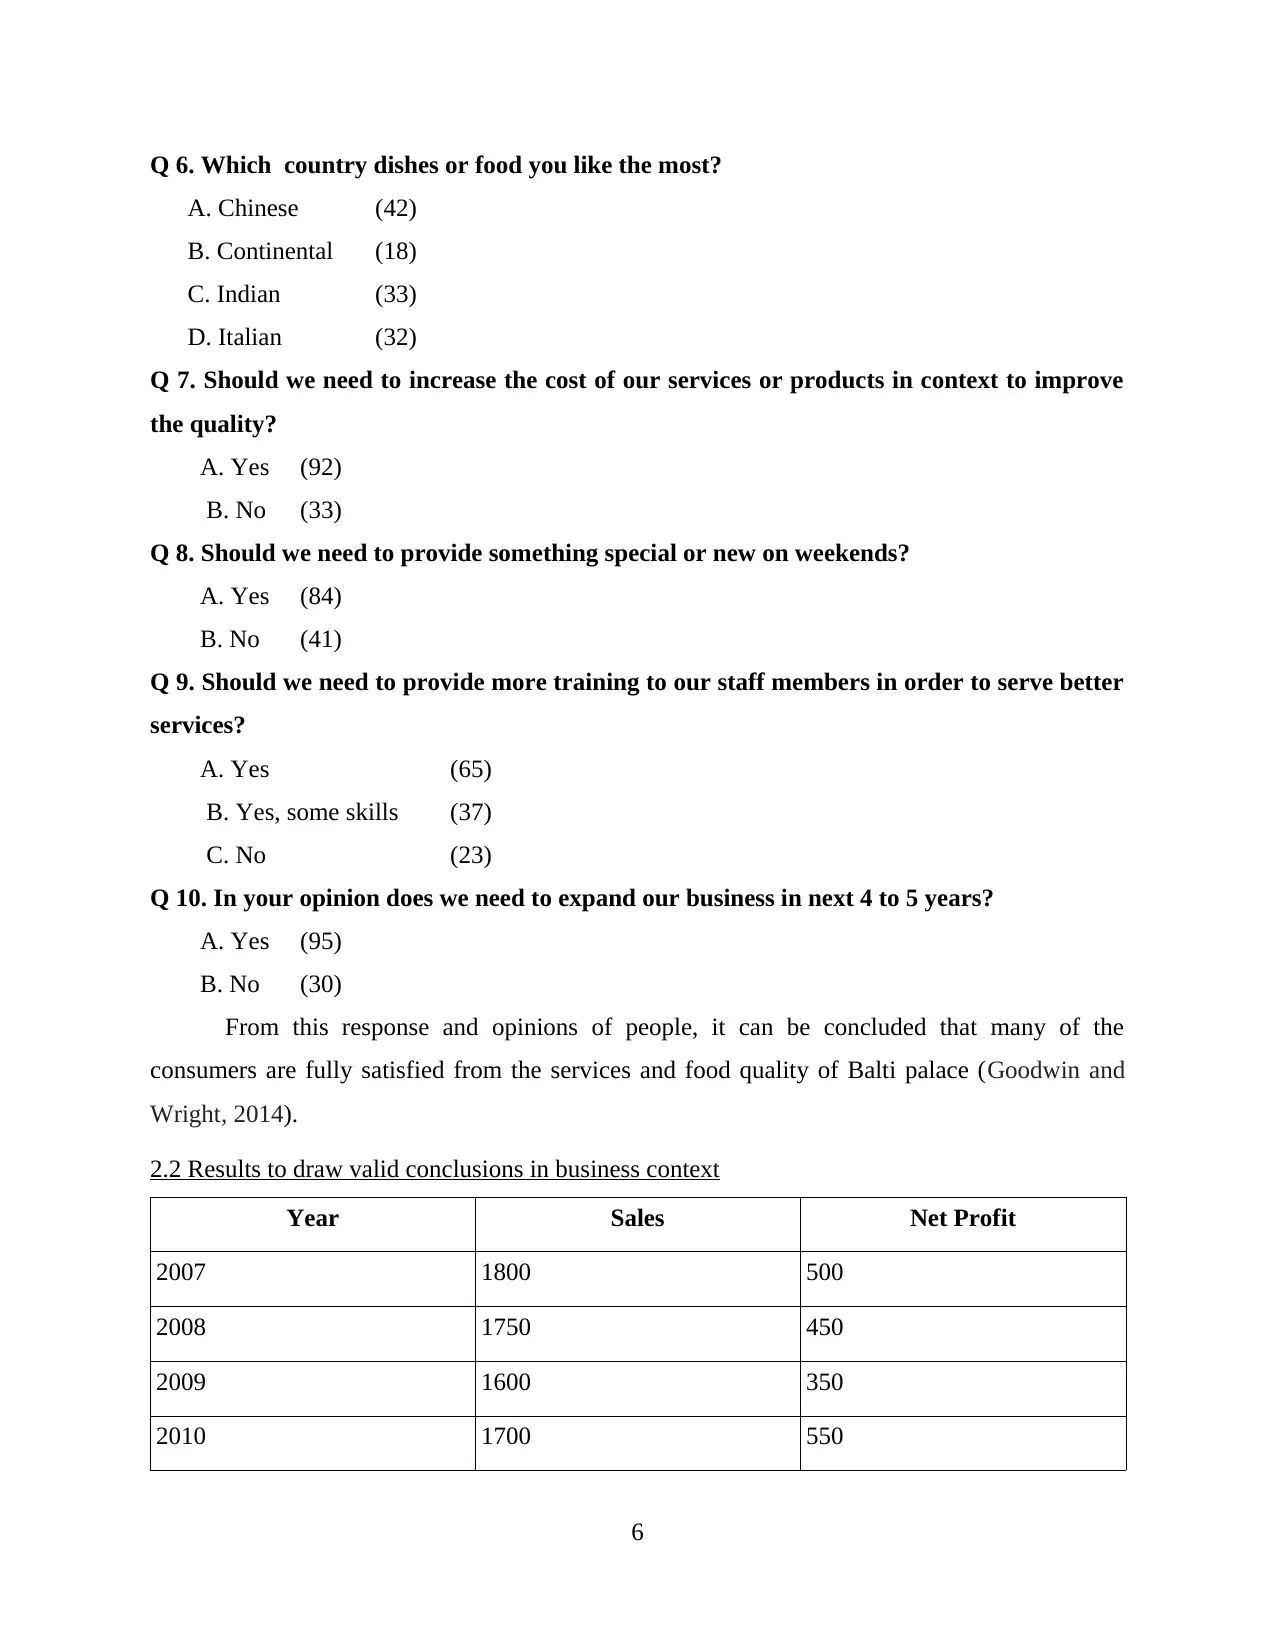
Q 6. Which country dishes or food you like the most?
A. Chinese (42)
B. Continental (18)
C. Indian (33)
D. Italian (32)
Q 7. Should we need to increase the cost of our services or products in context to improve
the quality?
A. Yes (92)
B. No (33)
Q 8. Should we need to provide something special or new on weekends?
A. Yes (84)
B. No (41)
Q 9. Should we need to provide more training to our staff members in order to serve better
services?
A. Yes (65)
B. Yes, some skills (37)
C. No (23)
Q 10. In your opinion does we need to expand our business in next 4 to 5 years?
A. Yes (95)
B. No (30)
From this response and opinions of people, it can be concluded that many of the
consumers are fully satisfied from the services and food quality of Balti palace (Goodwin and
Wright, 2014).
2.2 Results to draw valid conclusions in business context
Year Sales Net Profit
2007 1800 500
2008 1750 450
2009 1600 350
2010 1700 550
6
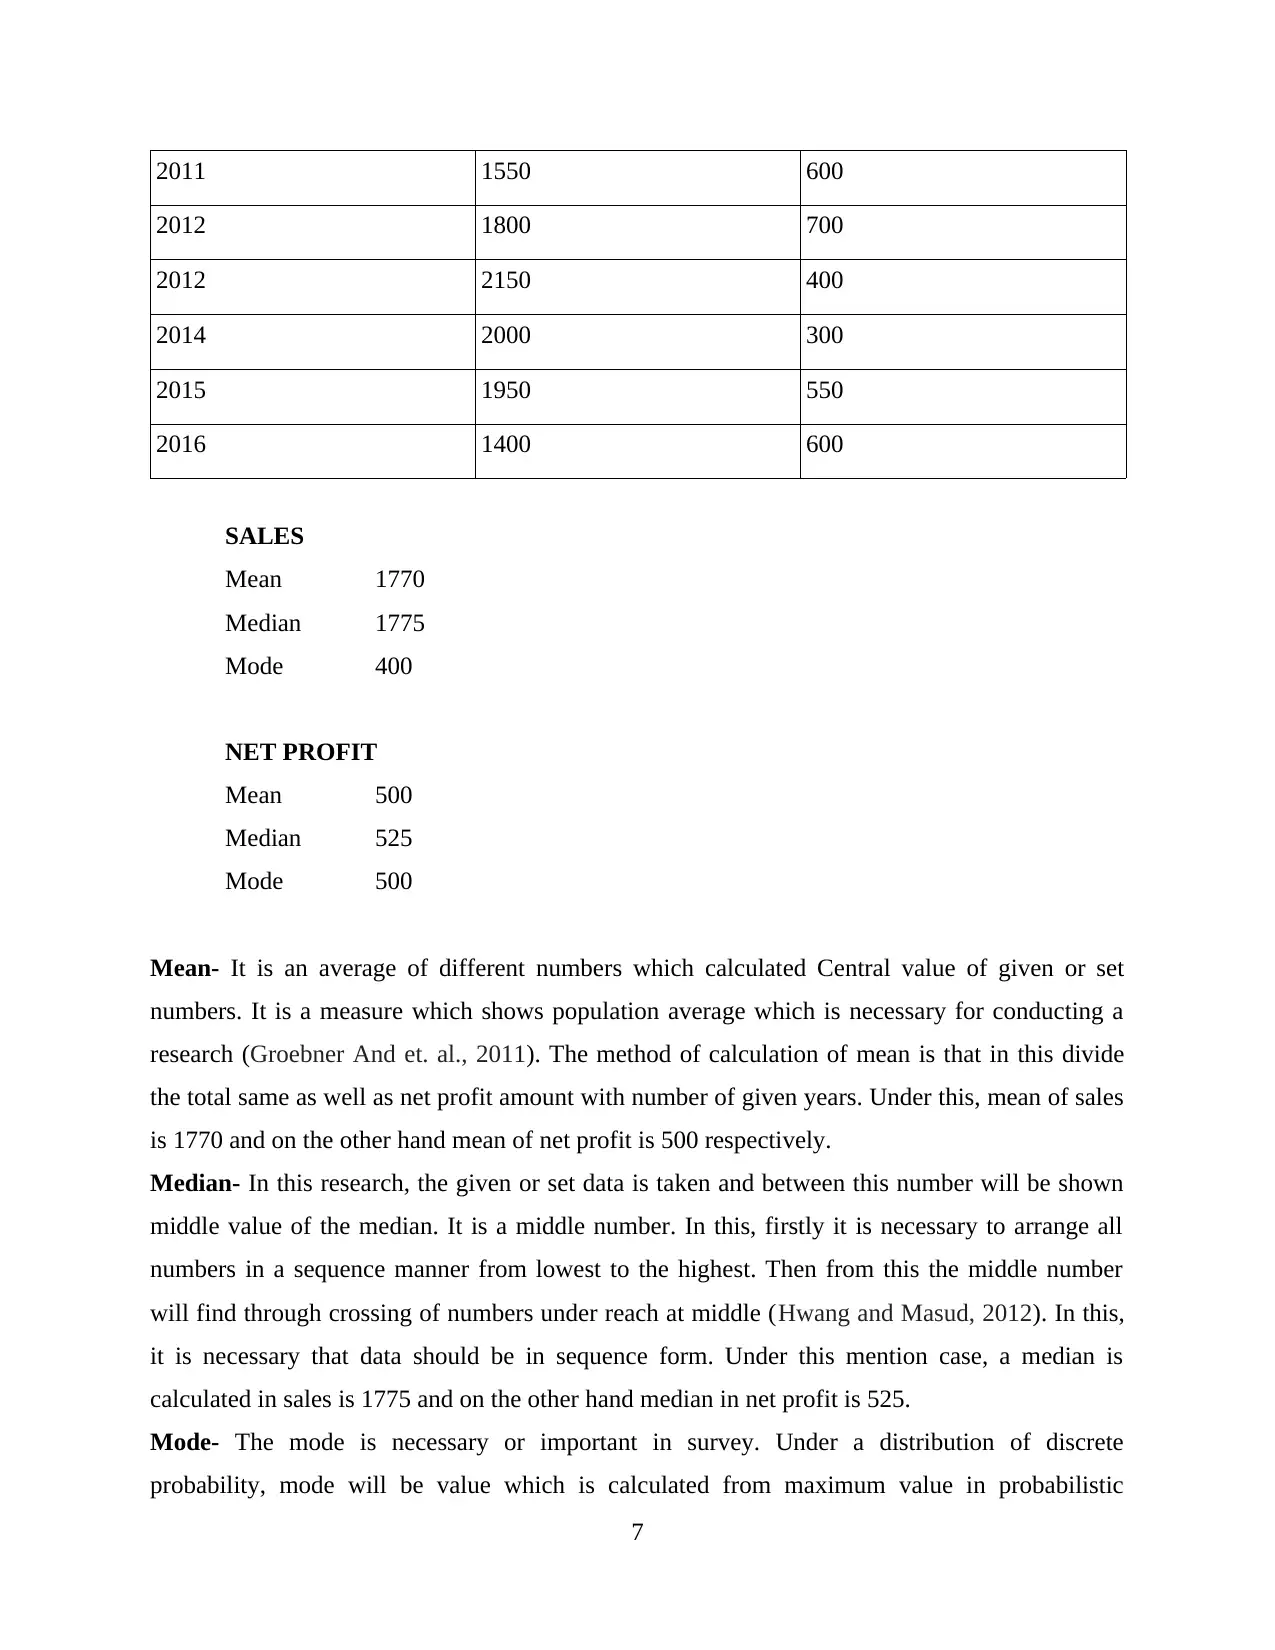
2011 1550 600
2012 1800 700
2012 2150 400
2014 2000 300
2015 1950 550
2016 1400 600
SALES
Mean 1770
Median 1775
Mode 400
NET PROFIT
Mean 500
Median 525
Mode 500
Mean- It is an average of different numbers which calculated Central value of given or set
numbers. It is a measure which shows population average which is necessary for conducting a
research (Groebner And et. al., 2011). The method of calculation of mean is that in this divide
the total same as well as net profit amount with number of given years. Under this, mean of sales
is 1770 and on the other hand mean of net profit is 500 respectively.
Median- In this research, the given or set data is taken and between this number will be shown
middle value of the median. It is a middle number. In this, firstly it is necessary to arrange all
numbers in a sequence manner from lowest to the highest. Then from this the middle number
will find through crossing of numbers under reach at middle (Hwang and Masud, 2012). In this,
it is necessary that data should be in sequence form. Under this mention case, a median is
calculated in sales is 1775 and on the other hand median in net profit is 525.
Mode- The mode is necessary or important in survey. Under a distribution of discrete
probability, mode will be value which is calculated from maximum value in probabilistic
7
⊘ This is a preview!⊘
Do you want full access?
Subscribe today to unlock all pages.
Trusted by 1+ million students worldwide
conditions The mode which is calculated in sales is 400 and on the second hand more is
calculated in the net profit is 500 respectively.
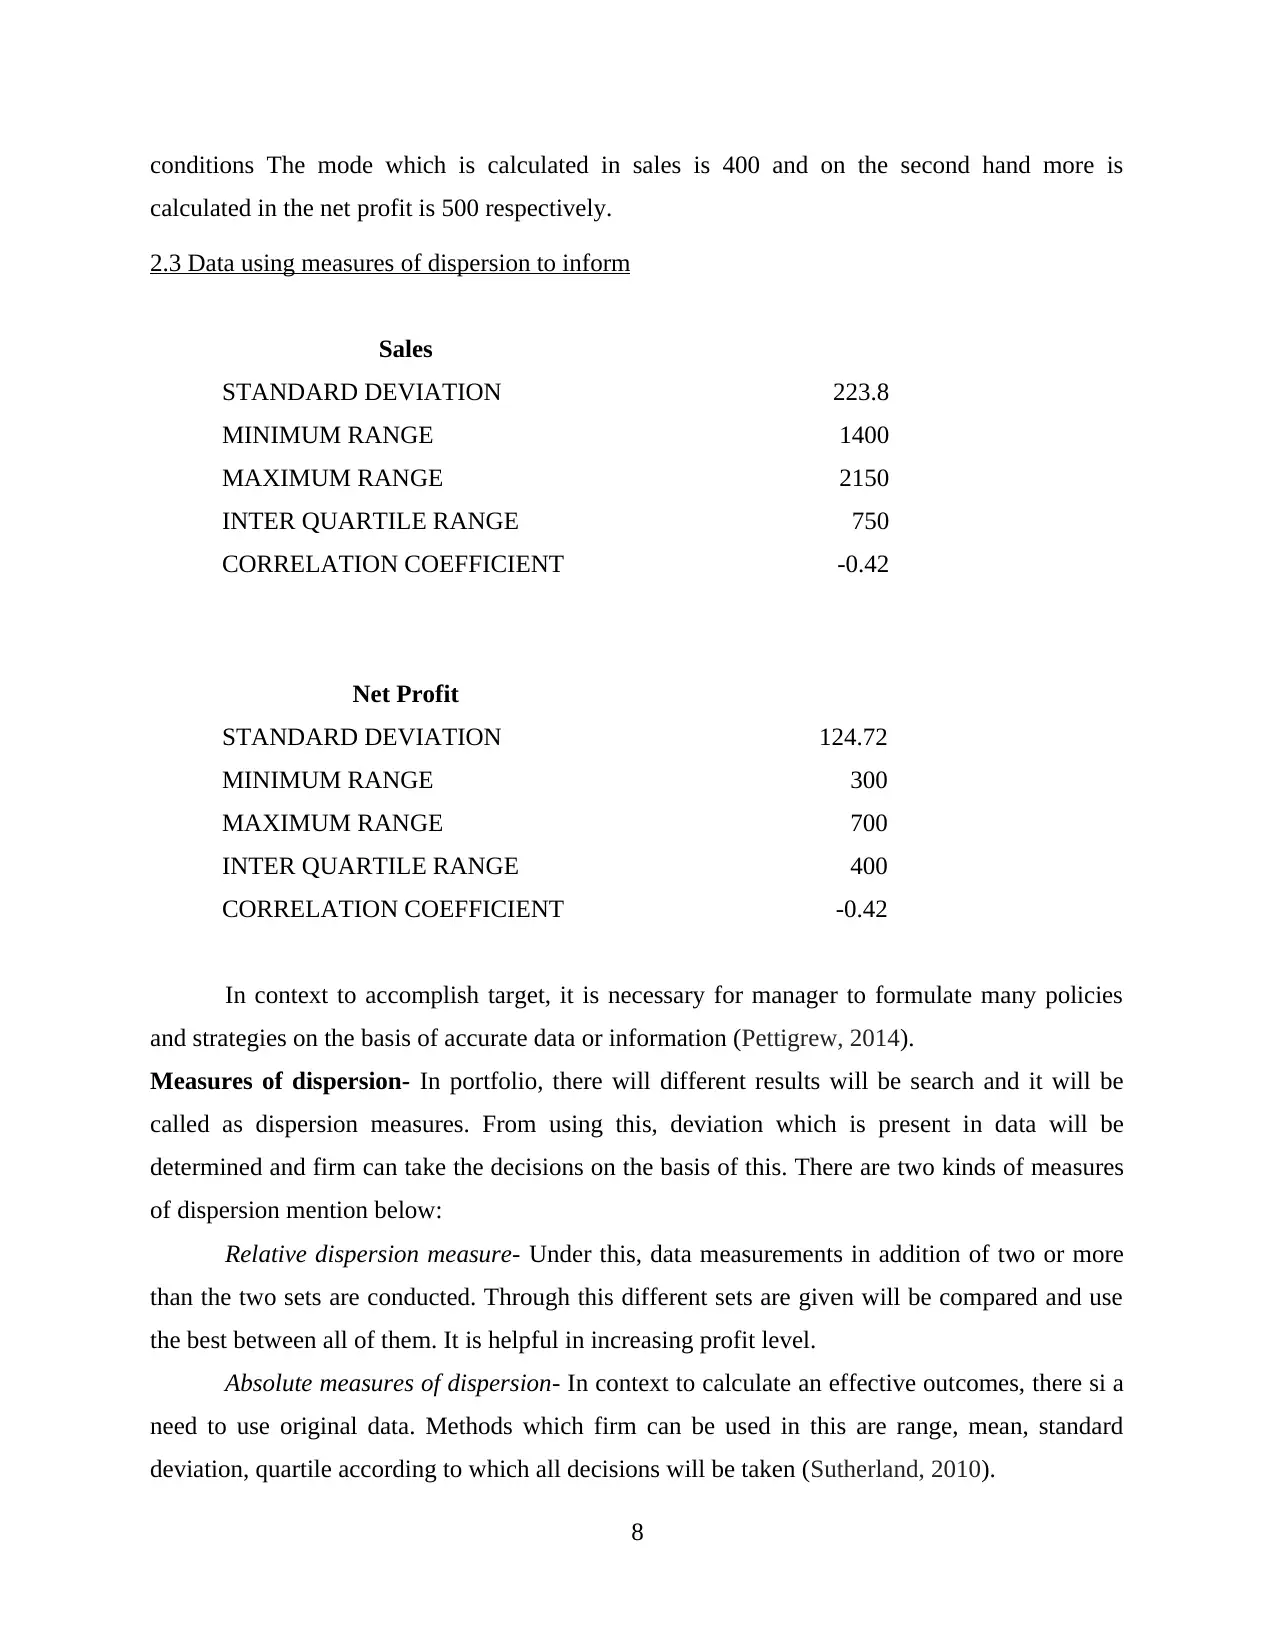
2.3 Data using measures of dispersion to inform
Sales
STANDARD DEVIATION 223.8
MINIMUM RANGE 1400
MAXIMUM RANGE 2150
INTER QUARTILE RANGE 750
CORRELATION COEFFICIENT -0.42
Net Profit
STANDARD DEVIATION 124.72
MINIMUM RANGE 300
MAXIMUM RANGE 700
INTER QUARTILE RANGE 400
CORRELATION COEFFICIENT -0.42
In context to accomplish target, it is necessary for manager to formulate many policies
and strategies on the basis of accurate data or information (Pettigrew, 2014).
Measures of dispersion- In portfolio, there will different results will be search and it will be
called as dispersion measures. From using this, deviation which is present in data will be
determined and firm can take the decisions on the basis of this. There are two kinds of measures
of dispersion mention below:
Relative dispersion measure- Under this, data measurements in addition of two or more
than the two sets are conducted. Through this different sets are given will be compared and use
the best between all of them. It is helpful in increasing profit level.
Absolute measures of dispersion- In context to calculate an effective outcomes, there si a
need to use original data. Methods which firm can be used in this are range, mean, standard
deviation, quartile according to which all decisions will be taken (Sutherland, 2010).
8
calculated in the net profit is 500 respectively.
2.3 Data using measures of dispersion to inform
Sales
STANDARD DEVIATION 223.8
MINIMUM RANGE 1400
MAXIMUM RANGE 2150
INTER QUARTILE RANGE 750
CORRELATION COEFFICIENT -0.42
Net Profit
STANDARD DEVIATION 124.72
MINIMUM RANGE 300
MAXIMUM RANGE 700
INTER QUARTILE RANGE 400
CORRELATION COEFFICIENT -0.42
In context to accomplish target, it is necessary for manager to formulate many policies
and strategies on the basis of accurate data or information (Pettigrew, 2014).
Measures of dispersion- In portfolio, there will different results will be search and it will be
called as dispersion measures. From using this, deviation which is present in data will be
determined and firm can take the decisions on the basis of this. There are two kinds of measures
of dispersion mention below:
Relative dispersion measure- Under this, data measurements in addition of two or more
than the two sets are conducted. Through this different sets are given will be compared and use
the best between all of them. It is helpful in increasing profit level.
Absolute measures of dispersion- In context to calculate an effective outcomes, there si a
need to use original data. Methods which firm can be used in this are range, mean, standard
deviation, quartile according to which all decisions will be taken (Sutherland, 2010).
8
Paraphrase This Document
Need a fresh take? Get an instant paraphrase of this document with our AI Paraphraser
2.4 Quartiles, percentiles and correlation coefficient are used to draw useful conclusions
Quartiles- In business, there are many different segments as well as variables which are
present and for this it is necessary to business to segment in to the different groups. Generally, in
this three kinds of quartiles are used such as upper, lower and inter. Upper quartile covered the
75 % of section whereas lower quartile consider 25 percent share. On the other hand al last inter
quartile undertaken 50 percent of business. Under this, the decisions which are taken by
company are according to this data.
Percentiles- It is a method through which data is displayed in a form of the percentages
which can be calculated through taking one measure as a base and under this decisions will taken
if percentage is maximum but it should be under limit of hundred percent (Tzeng and Huang,
2011).
Correlation coefficient- It is a measure through which relation among two variable is
identified and then decision should be take on the basis of this, when correlation will be among -
1 and 1, then it will be accepted other wise rejected. In mention case, this has been calculated at
the – 0.42 which is not good and decision is not in the favour of proposal.
TASK 3
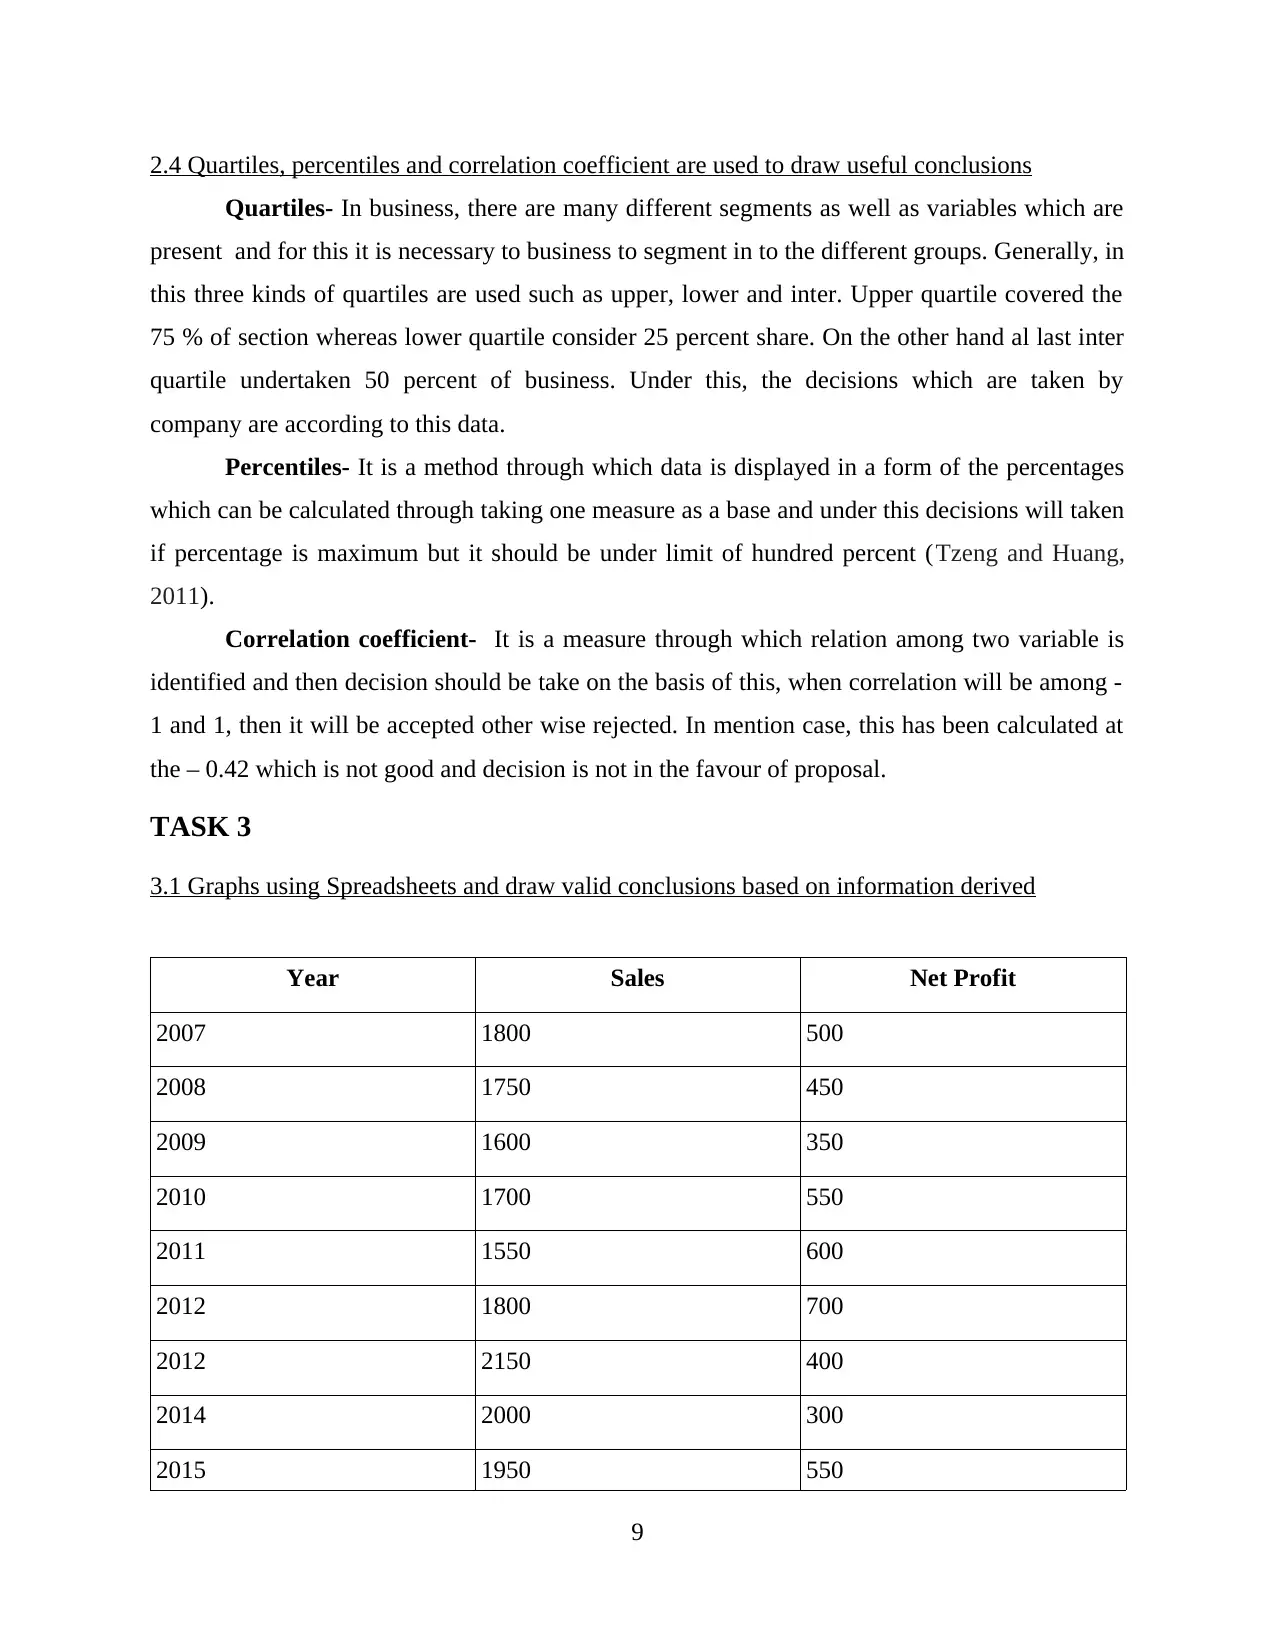
3.1 Graphs using Spreadsheets and draw valid conclusions based on information derived
Year Sales Net Profit
2007 1800 500
2008 1750 450
2009 1600 350
2010 1700 550
2011 1550 600
2012 1800 700
2012 2150 400
2014 2000 300
2015 1950 550
9
Quartiles- In business, there are many different segments as well as variables which are
present and for this it is necessary to business to segment in to the different groups. Generally, in
this three kinds of quartiles are used such as upper, lower and inter. Upper quartile covered the
75 % of section whereas lower quartile consider 25 percent share. On the other hand al last inter
quartile undertaken 50 percent of business. Under this, the decisions which are taken by
company are according to this data.
Percentiles- It is a method through which data is displayed in a form of the percentages
which can be calculated through taking one measure as a base and under this decisions will taken
if percentage is maximum but it should be under limit of hundred percent (Tzeng and Huang,
2011).
Correlation coefficient- It is a measure through which relation among two variable is
identified and then decision should be take on the basis of this, when correlation will be among -
1 and 1, then it will be accepted other wise rejected. In mention case, this has been calculated at
the – 0.42 which is not good and decision is not in the favour of proposal.
TASK 3
3.1 Graphs using Spreadsheets and draw valid conclusions based on information derived
Year Sales Net Profit
2007 1800 500
2008 1750 450
2009 1600 350
2010 1700 550
2011 1550 600
2012 1800 700
2012 2150 400
2014 2000 300
2015 1950 550
9
2016 1400 600
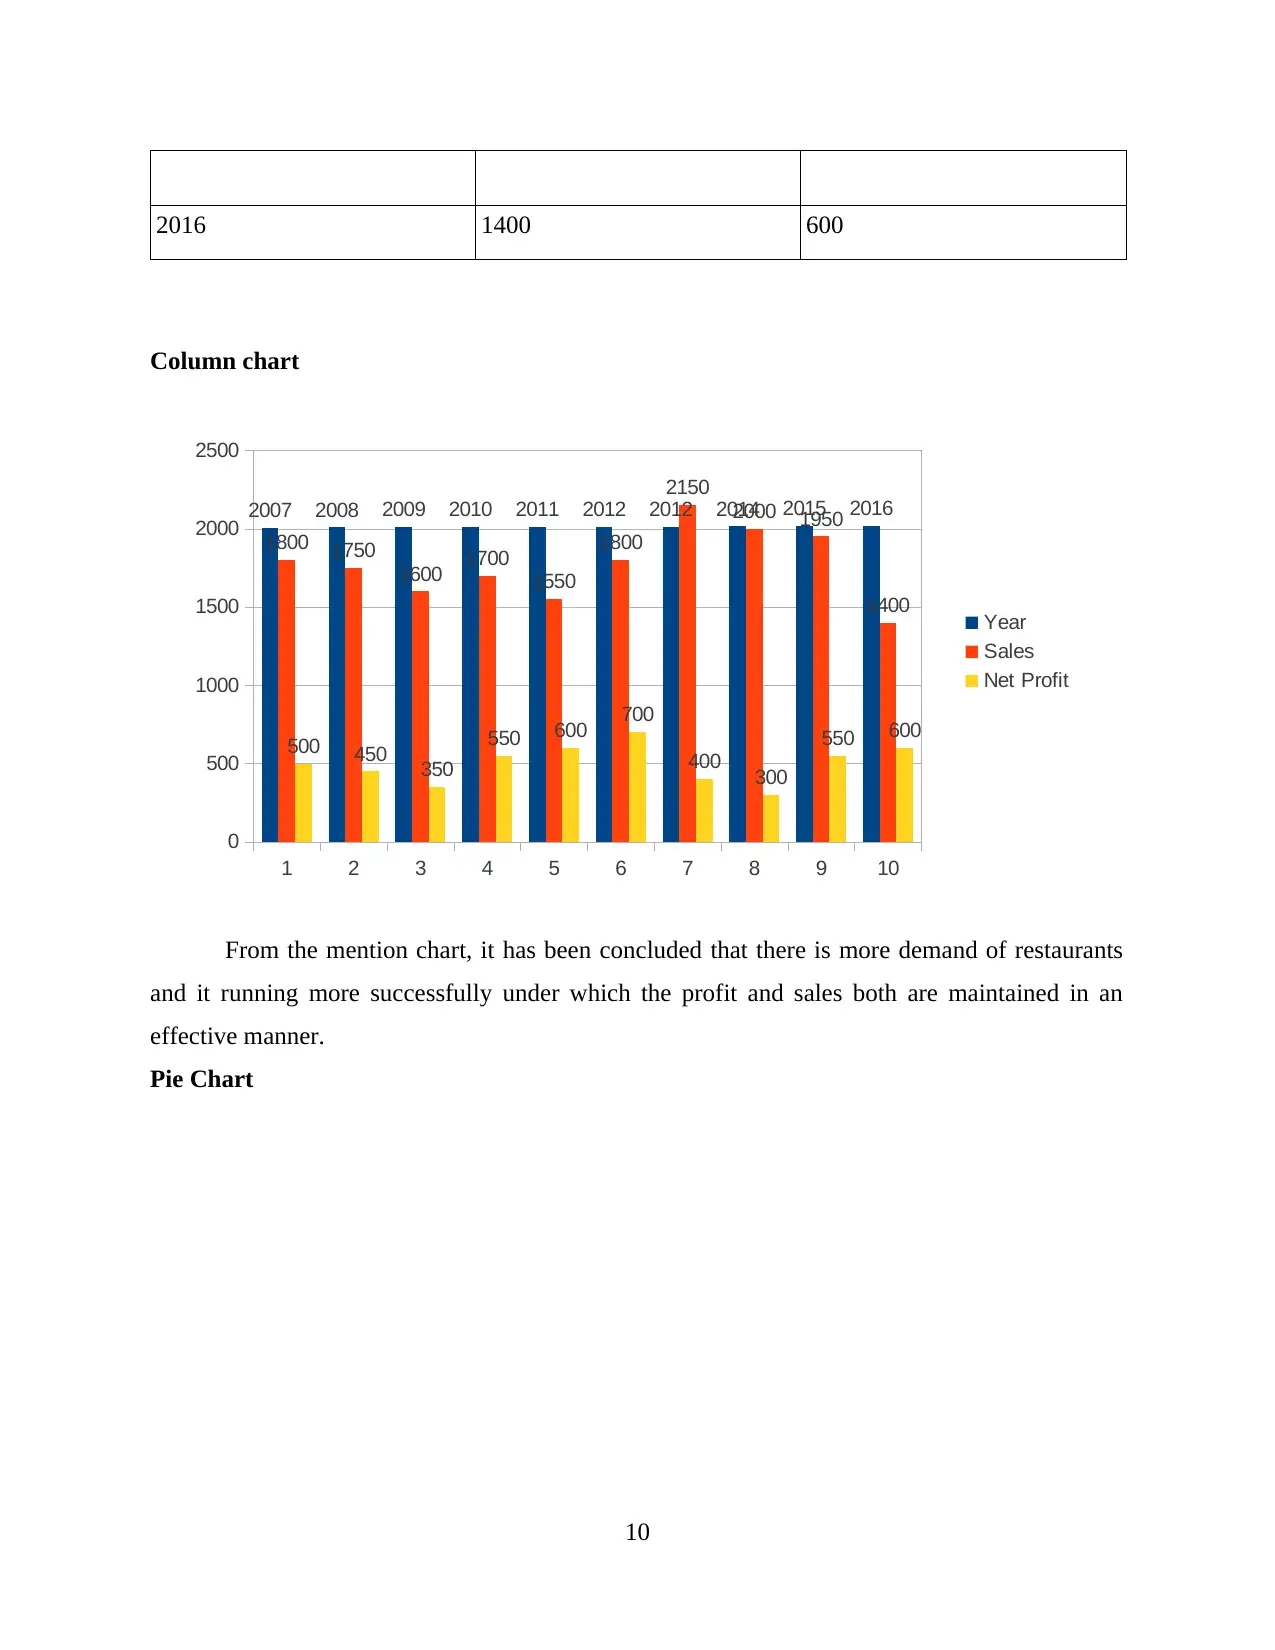
Column chart
1 2 3 4 5 6 7 8 9 10
0
500
1000
1500
2000
2500
2007 2008 2009 2010 2011 2012 2012 2014 2015 2016
1800 1750
1600 1700
1550
1800
2150
2000 1950
1400
500 450 350
550 600 700
400 300
550 600
Year
Sales
Net Profit
From the mention chart, it has been concluded that there is more demand of restaurants
and it running more successfully under which the profit and sales both are maintained in an
effective manner.
Pie Chart
10
⊘ This is a preview!⊘
Do you want full access?
Subscribe today to unlock all pages.
Trusted by 1+ million students worldwide
1 out of 18
Related Documents


Your All-in-One AI-Powered Toolkit for Academic Success.
+13062052269
info@desklib.com
Available 24*7 on WhatsApp / Email
![[object Object]](/_next/static/media/star-bottom.7253800d.svg)
Unlock your academic potential
Copyright © 2020–2026 A2Z Services. All Rights Reserved. Developed and managed by ZUCOL.