Business Decision Making Report: Data Analysis and Business Decisions
VerifiedAdded on 2020/07/23
|19
|3826
|127
Report
AI Summary
This report focuses on business decision-making, encompassing data collection, analysis, and presentation. It begins with an introduction to the importance of decision-making in modern business, followed by a detailed exploration of primary and secondary data collection methods, including survey methodology and questionnaire design. The report then delves into data analysis, covering techniques like summarizing data using representative values, drawing valid conclusions, and employing measures of dispersion. Graphical presentation and trend line forecasting are utilized to present the data effectively, culminating in a formal business report. Furthermore, the report discusses the use of information processing tools, a project plan for establishing a new brand, and the application of financial tools for sound investment decisions. The analysis includes statistical measures such as mean, median, standard deviation, quartiles, percentiles, and correlation coefficients to support the decision-making process. The report concludes by summarizing the key findings and providing actionable insights for businesses.
BUSINESS DECISION MAKING
Paraphrase This Document
Need a fresh take? Get an instant paraphrase of this document with our AI Paraphraser
Table of Contents
INTRODUCTION...........................................................................................................................1
TASK -1...........................................................................................................................................1
1.1 The data collection methods.............................................................................................1
1.2 The survey methodology and sampling frame.................................................................1
1.3 Questionnaire....................................................................................................................2
TASK 2............................................................................................................................................3
2.1 Creating information for decision making by summarizing primary data set..................3
2.2 Analyzing results to draw valid conclusion......................................................................6
2.3 Assessing data set through using measures of dispersion................................................7
2.4 Explaining the use of quartile, percentile and correlation co-efficient in decision making
................................................................................................................................................7
TASK 3............................................................................................................................................8
3.1 Graphical presentation......................................................................................................8
3.2 Forecasting through trend line........................................................................................10
3.3 Power point presentation................................................................................................10
3.4 Formal business report...................................................................................................11
TASK-4..........................................................................................................................................11
4.1 Use of appropriate information processing tools............................................................11
4.2 Project plan to establish new brand of Food for Friend in London................................12
4.3 Using financial tools for good investment decisions......................................................14
CONCLUSION..............................................................................................................................15
REFERENCES..............................................................................................................................15
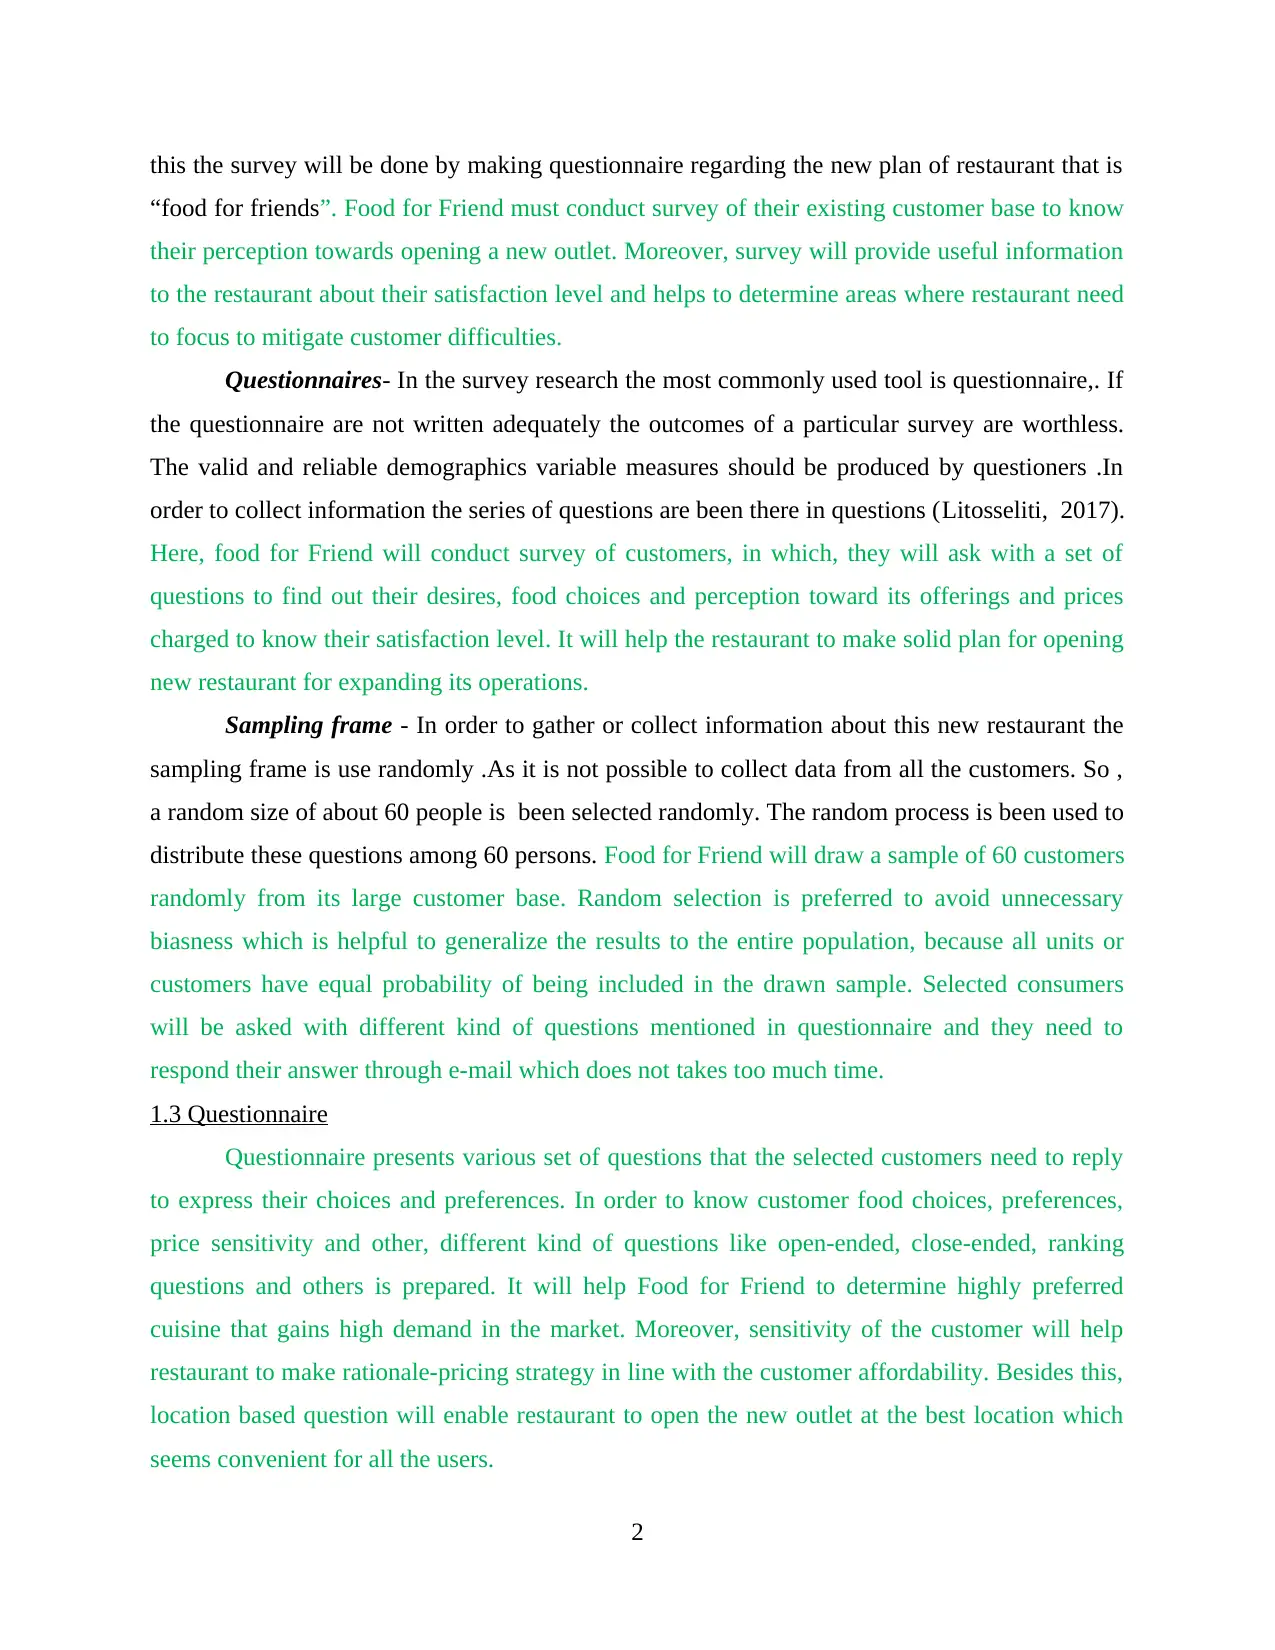
INTRODUCTION
In the modern times, management plays an integral part is being played by decision-
making. Both organizational and managerial activities are been determined by decisions. In the
success of the organization the decision-making plays a vital role (Weigold,Weigold and Russell,
2013). Good decision means good business. In the company or organization the efficient and
effective decision are being made by the managers in order to make use that profit is being
gained in the business.In this report, the data will be collected for the new restaurants that is
“Food for Friends”. Further, different tools will be applied to the data which is been collected
regarding this new restaurant.
TASK -1
1.1 The data collection methods
Data collection – It is the process by which the data can be collected and measures
information on targeted variables in an established systematic fashion. The questions are been
asked in order to analyze the outcomes. For a particular purpose, the data is being gathered
systematically. The data is being collected in order to make decision about important issues. In
all fields of research, data collection can be used. There are basically two types of data collection
methods that is been used to collect data about the new food restaurant that is “food for friends”
Primary data – In this data is being gathered for the first time and it is fresh. Under the
control and supervisor of an investor the data is been gathered. It is a form original data that is
been collected for the specific purpose. The surveys, experiments, focus groups etc are some
type of primary research methods through which data can be gathered. In order to gather data for
this new restaurant a real survey of customers was conducted (Orkin, 2014).
Secondary research- In this the data is being collected by someone for before. For
another purpose, the data is being gathered in this. The time and cost and efforts that is need in
the collection of data is less in this in comparison with primary as it is taking place for the first
time. It is being used again in different context. The some of the resources of secondary data are
magazines, the internet, newspaper, books and journals etc. For this new restaurant the secondary
data that is being used is sales, profit , history of customer for 10 years is been used.
1.2 The survey methodology and sampling frame
The survey methodology examines the sampling of individual units from a population
and the associated survey techniques of data collection such as construction of questioners. In
1
⊘ This is a preview!⊘
Do you want full access?
Subscribe today to unlock all pages.
Trusted by 1+ million students worldwide
this the survey will be done by making questionnaire regarding the new plan of restaurant that is
“food for friends”. Food for Friend must conduct survey of their existing customer base to know
their perception towards opening a new outlet. Moreover, survey will provide useful information
to the restaurant about their satisfaction level and helps to determine areas where restaurant need
to focus to mitigate customer difficulties.
Questionnaires- In the survey research the most commonly used tool is questionnaire,. If
the questionnaire are not written adequately the outcomes of a particular survey are worthless.
The valid and reliable demographics variable measures should be produced by questioners .In
order to collect information the series of questions are been there in questions (Litosseliti, 2017).
Here, food for Friend will conduct survey of customers, in which, they will ask with a set of
questions to find out their desires, food choices and perception toward its offerings and prices
charged to know their satisfaction level. It will help the restaurant to make solid plan for opening
new restaurant for expanding its operations.
Sampling frame - In order to gather or collect information about this new restaurant the
sampling frame is use randomly .As it is not possible to collect data from all the customers. So ,
a random size of about 60 people is been selected randomly. The random process is been used to
distribute these questions among 60 persons. Food for Friend will draw a sample of 60 customers
randomly from its large customer base. Random selection is preferred to avoid unnecessary
biasness which is helpful to generalize the results to the entire population, because all units or
customers have equal probability of being included in the drawn sample. Selected consumers
will be asked with different kind of questions mentioned in questionnaire and they need to
respond their answer through e-mail which does not takes too much time.
1.3 Questionnaire
Questionnaire presents various set of questions that the selected customers need to reply
to express their choices and preferences. In order to know customer food choices, preferences,
price sensitivity and other, different kind of questions like open-ended, close-ended, ranking
questions and others is prepared. It will help Food for Friend to determine highly preferred
cuisine that gains high demand in the market. Moreover, sensitivity of the customer will help
restaurant to make rationale-pricing strategy in line with the customer affordability. Besides this,
location based question will enable restaurant to open the new outlet at the best location which
seems convenient for all the users.
2
Paraphrase This Document
Need a fresh take? Get an instant paraphrase of this document with our AI Paraphraser
1.The number of times you go to a restaurant form lunch or dinner?
Several time a week
About once a week
3-3 times in month
Never
Less than 2-3 years
2. The number of money that is been spent on each person when you go out in a restaurant
Less than $ 10
In between $ 12 and $ 20
In between $ 21 and $ 35
In between $ 35 and $ 49
More than $ 49
3. The main reasons for you to got to a restaurant
To have good food
For some events such as anniversary, apry
Others
4. What are the criteria that are more important for you when you go in a restaurant
Concept of restaurant
Quality of food
Service
Price
Convenience
5. The style of restaurant that is most preferred by you?
Traditional
Homey
Modern
Mixture of tradition and modern
6. The type of cuisine preferred by you?
American
Thai
Indian
3
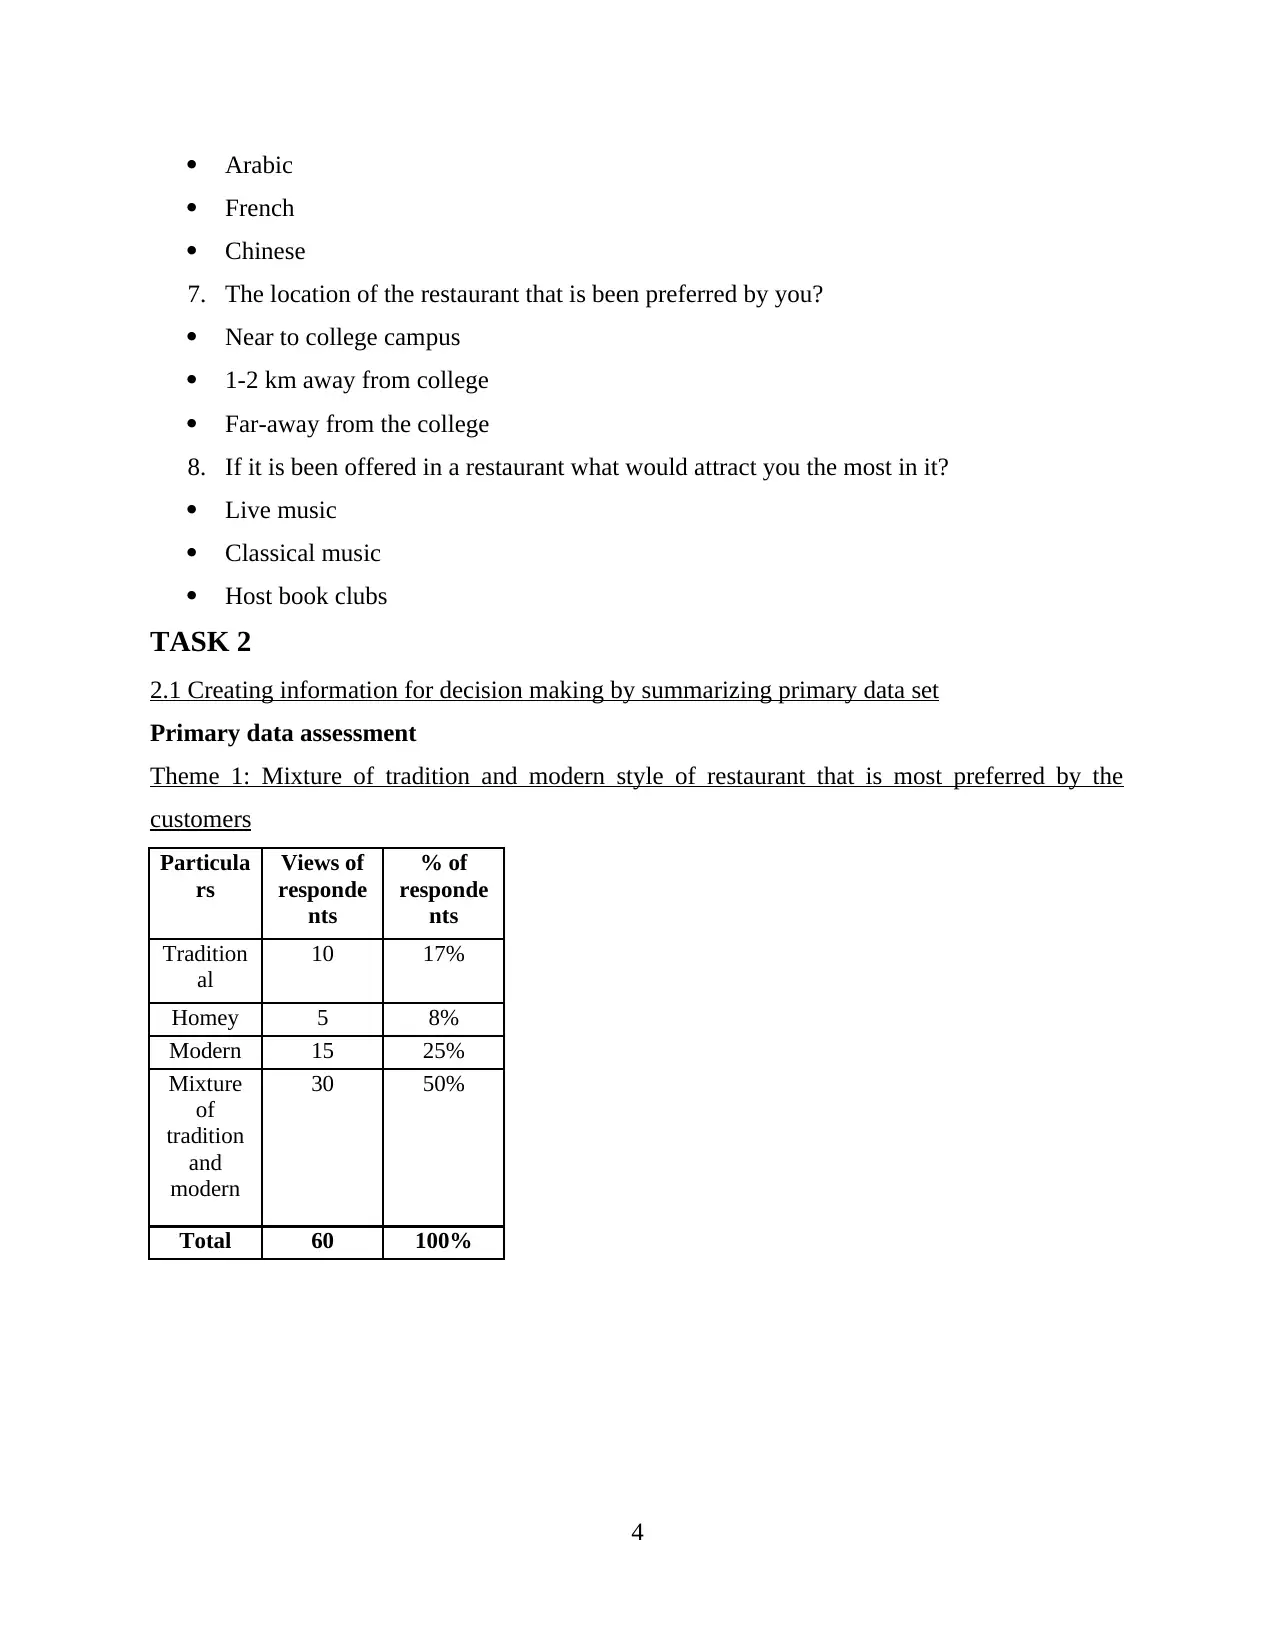
Arabic
French
Chinese
7. The location of the restaurant that is been preferred by you?
Near to college campus
1-2 km away from college
Far-away from the college
8. If it is been offered in a restaurant what would attract you the most in it?
Live music
Classical music
Host book clubs
TASK 2
2.1 Creating information for decision making by summarizing primary data set
Primary data assessment
Theme 1: Mixture of tradition and modern style of restaurant that is most preferred by the
customers
Particula
rs
Views of
responde
nts
% of
responde
nts
Tradition
al
10 17%
Homey 5 8%
Modern 15 25%
Mixture
of
tradition
and
modern
30 50%
Total 60 100%
4
⊘ This is a preview!⊘
Do you want full access?
Subscribe today to unlock all pages.
Trusted by 1+ million students worldwide
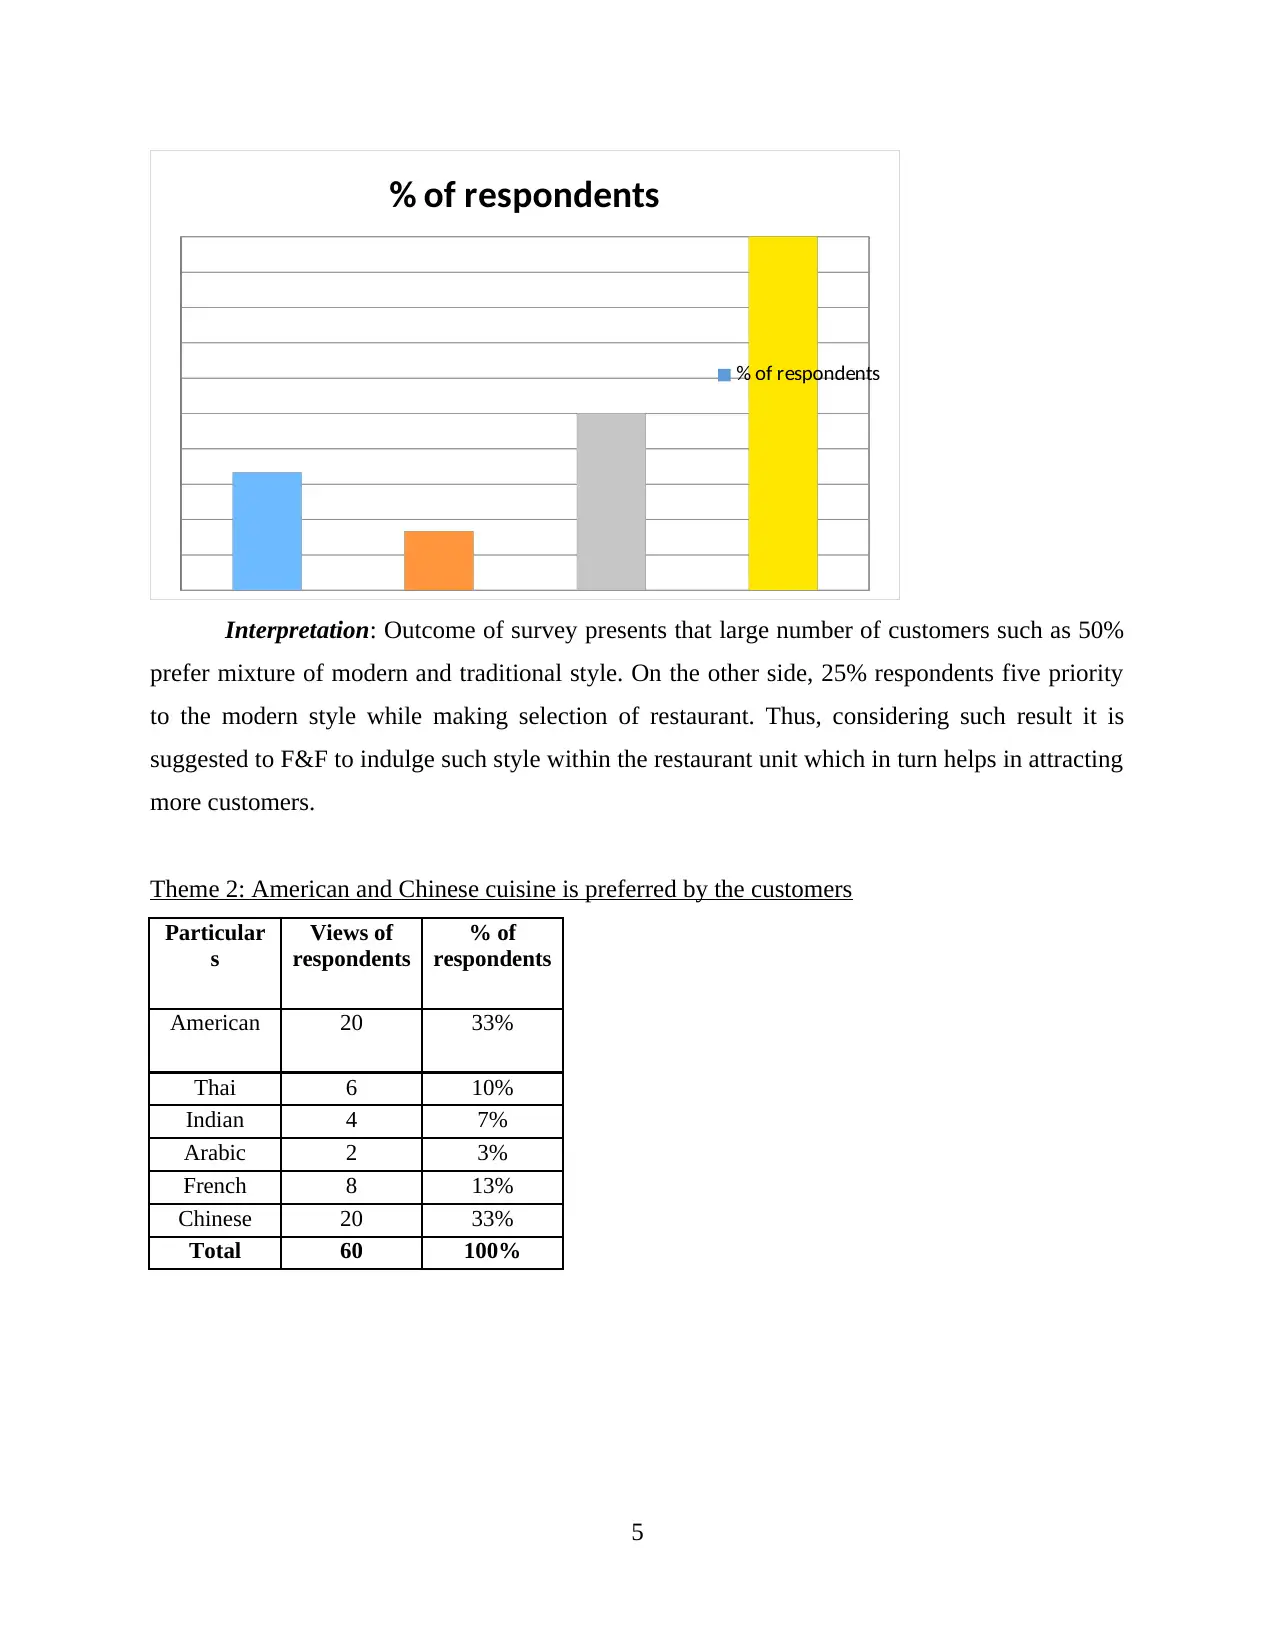
% of respondents
% of respondents
Interpretation: Outcome of survey presents that large number of customers such as 50%
prefer mixture of modern and traditional style. On the other side, 25% respondents five priority
to the modern style while making selection of restaurant. Thus, considering such result it is
suggested to F&F to indulge such style within the restaurant unit which in turn helps in attracting
more customers.
Theme 2: American and Chinese cuisine is preferred by the customers
Particular
s
Views of
respondents
% of
respondents
American 20 33%
Thai 6 10%
Indian 4 7%
Arabic 2 3%
French 8 13%
Chinese 20 33%
Total 60 100%
5
Paraphrase This Document
Need a fresh take? Get an instant paraphrase of this document with our AI Paraphraser
% of respondents
% of respondents
Interpretation: In survey, 33% respondents said that they prefer American style, whereas
7% people like Indian food. Further, out of selected respondents 13% stated that French food is
the most likely preferred by them. In contrast to this, 33% customers, who are selected as
respondents, like Chinese food menu. Thus, considering the preference of customers F&F should
include more American and Chinese dishes in menu.
Theme 3: Live music concert is mostly offered by the customers in a restaurant
Particular
s
Views of
respondents
% of
respondents
Live music 32 53%
Classical
music
18 30%
Host book
clubs
10 17%
Total 60 100%
6
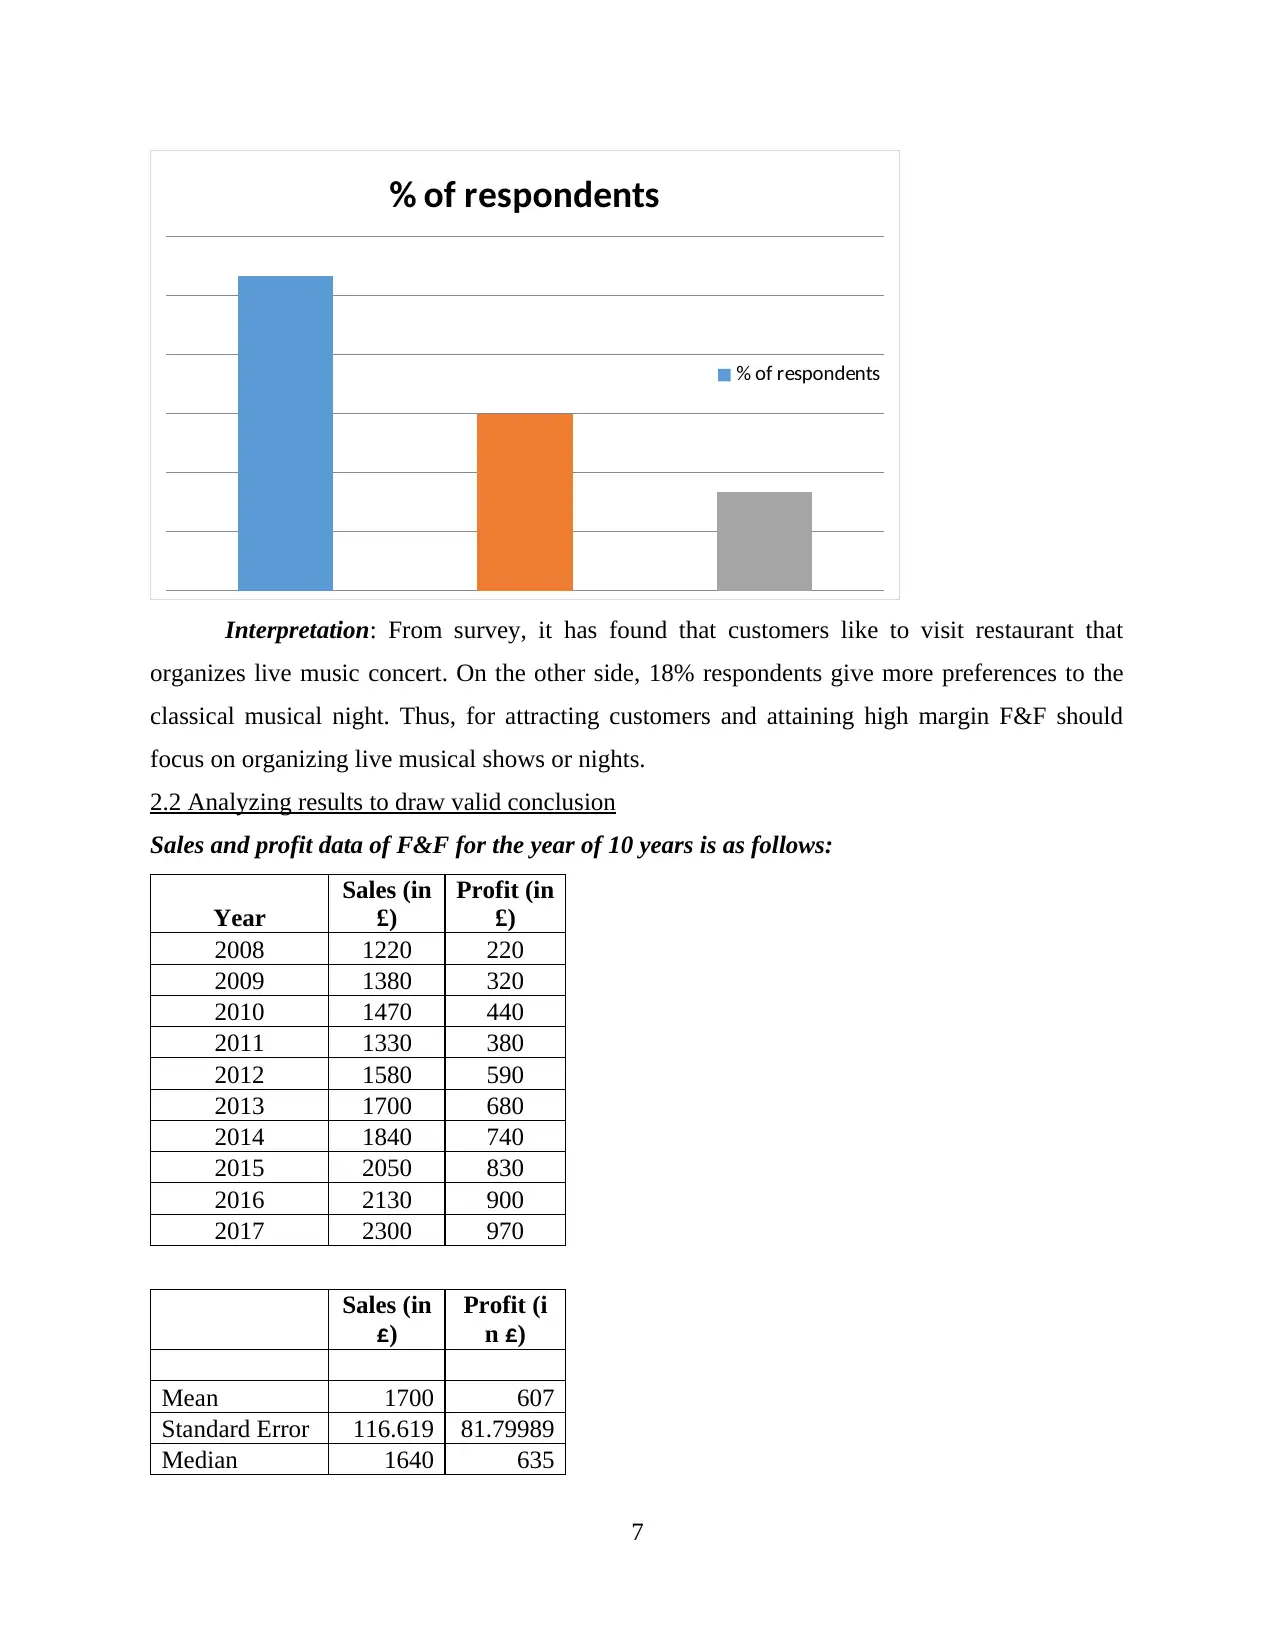
% of respondents
% of respondents
Interpretation: From survey, it has found that customers like to visit restaurant that
organizes live music concert. On the other side, 18% respondents give more preferences to the
classical musical night. Thus, for attracting customers and attaining high margin F&F should
focus on organizing live musical shows or nights.
2.2 Analyzing results to draw valid conclusion
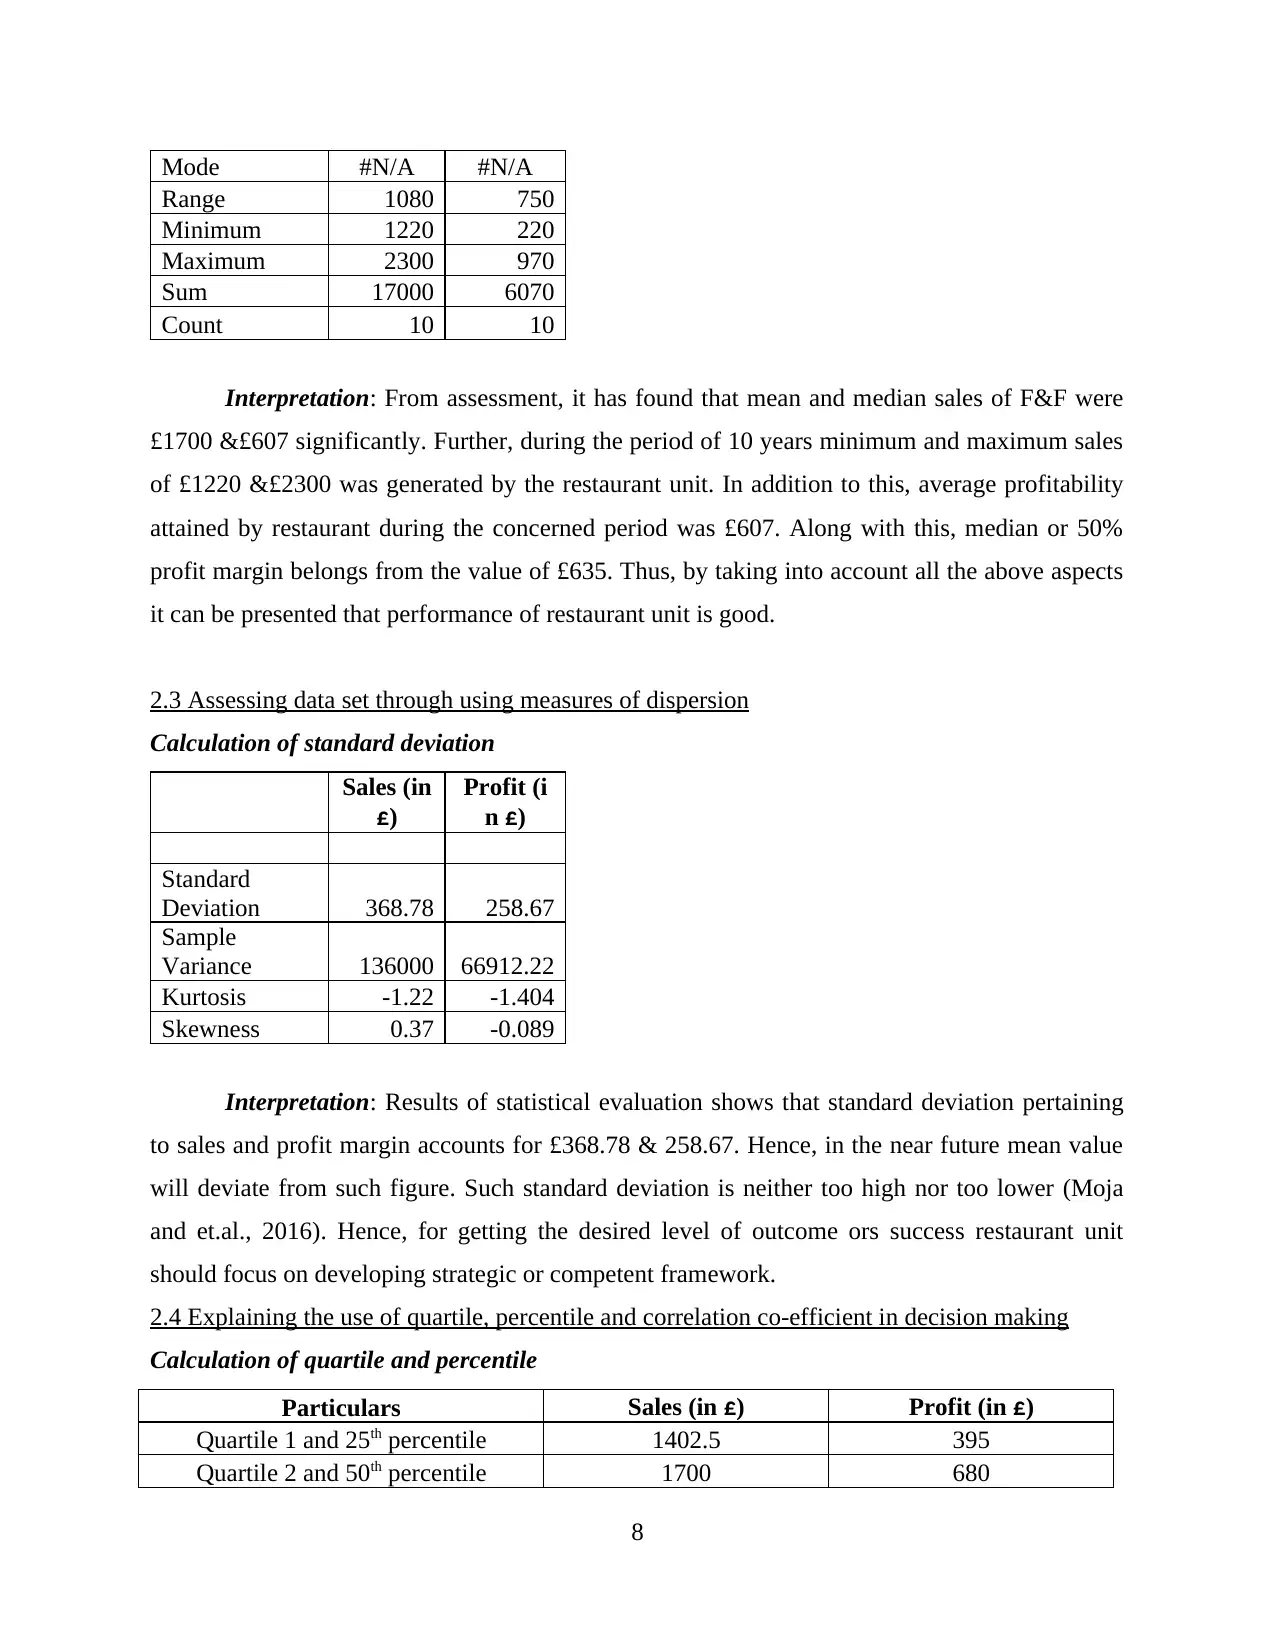
Sales and profit data of F&F for the year of 10 years is as follows:
Year
Sales (in
£)
Profit (in
£)
2008 1220 220
2009 1380 320
2010 1470 440
2011 1330 380
2012 1580 590
2013 1700 680
2014 1840 740
2015 2050 830
2016 2130 900
2017 2300 970
Sales (in
£)
Profit (i
n £)
Mean 1700 607
Standard Error 116.619 81.79989
Median 1640 635
7
% of respondents
Interpretation: From survey, it has found that customers like to visit restaurant that
organizes live music concert. On the other side, 18% respondents give more preferences to the
classical musical night. Thus, for attracting customers and attaining high margin F&F should
focus on organizing live musical shows or nights.
2.2 Analyzing results to draw valid conclusion
Sales and profit data of F&F for the year of 10 years is as follows:
Year
Sales (in
£)
Profit (in
£)
2008 1220 220
2009 1380 320
2010 1470 440
2011 1330 380
2012 1580 590
2013 1700 680
2014 1840 740
2015 2050 830
2016 2130 900
2017 2300 970
Sales (in
£)
Profit (i
n £)
Mean 1700 607
Standard Error 116.619 81.79989
Median 1640 635
7
⊘ This is a preview!⊘
Do you want full access?
Subscribe today to unlock all pages.
Trusted by 1+ million students worldwide
Mode #N/A #N/A
Range 1080 750
Minimum 1220 220
Maximum 2300 970
Sum 17000 6070
Count 10 10
Interpretation: From assessment, it has found that mean and median sales of F&F were
£1700 &£607 significantly. Further, during the period of 10 years minimum and maximum sales
of £1220 &£2300 was generated by the restaurant unit. In addition to this, average profitability
attained by restaurant during the concerned period was £607. Along with this, median or 50%
profit margin belongs from the value of £635. Thus, by taking into account all the above aspects
it can be presented that performance of restaurant unit is good.
2.3 Assessing data set through using measures of dispersion
Calculation of standard deviation
Sales (in
£)
Profit (i
n £)
Standard
Deviation 368.78 258.67
Sample
Variance 136000 66912.22
Kurtosis -1.22 -1.404
Skewness 0.37 -0.089
Interpretation: Results of statistical evaluation shows that standard deviation pertaining
to sales and profit margin accounts for £368.78 & 258.67. Hence, in the near future mean value
will deviate from such figure. Such standard deviation is neither too high nor too lower (Moja
and et.al., 2016). Hence, for getting the desired level of outcome ors success restaurant unit
should focus on developing strategic or competent framework.
2.4 Explaining the use of quartile, percentile and correlation co-efficient in decision making
Calculation of quartile and percentile
Particulars Sales (in £) Profit (in £)
Quartile 1 and 25th percentile 1402.5 395
Quartile 2 and 50th percentile 1700 680
8
Paraphrase This Document
Need a fresh take? Get an instant paraphrase of this document with our AI Paraphraser
Quartile 3 and 75th percentile 2070 847.5
Interpretation: Outcome of statistical analysis shows that quartile 1 and 3 pertaining to
sales of F&F accounts for £1402.5 &£2070 respectively. Further, quartile 2 implies for median
which in turn shows that 50% of sales is related to £1700 significantly. Along with this, profit of
F&F also increased from quartile 1 to 3 to a great extent. Referring such statistical result it can
be depicted that sales and margin of the concerned restaurant unit is continuously increasing.
Correlation co-efficient
Sales Profit
Sales 1 .98
Profit .98 1
Interpretation: By doing statistical analysis, it has found that highly positive relationship
takes place between the concerned variables such as sales and profit. On the basis of such aspect,
both the concerned variables will move in a similar tandem (Mukaka, 2012). Thus, F&F should
lay emphasis on effectual promotional campaign which in turn helps in enhancing both sales as
well as profit margin.
TASK 3
3.1 Graphical presentation
Financial data set
in £
9
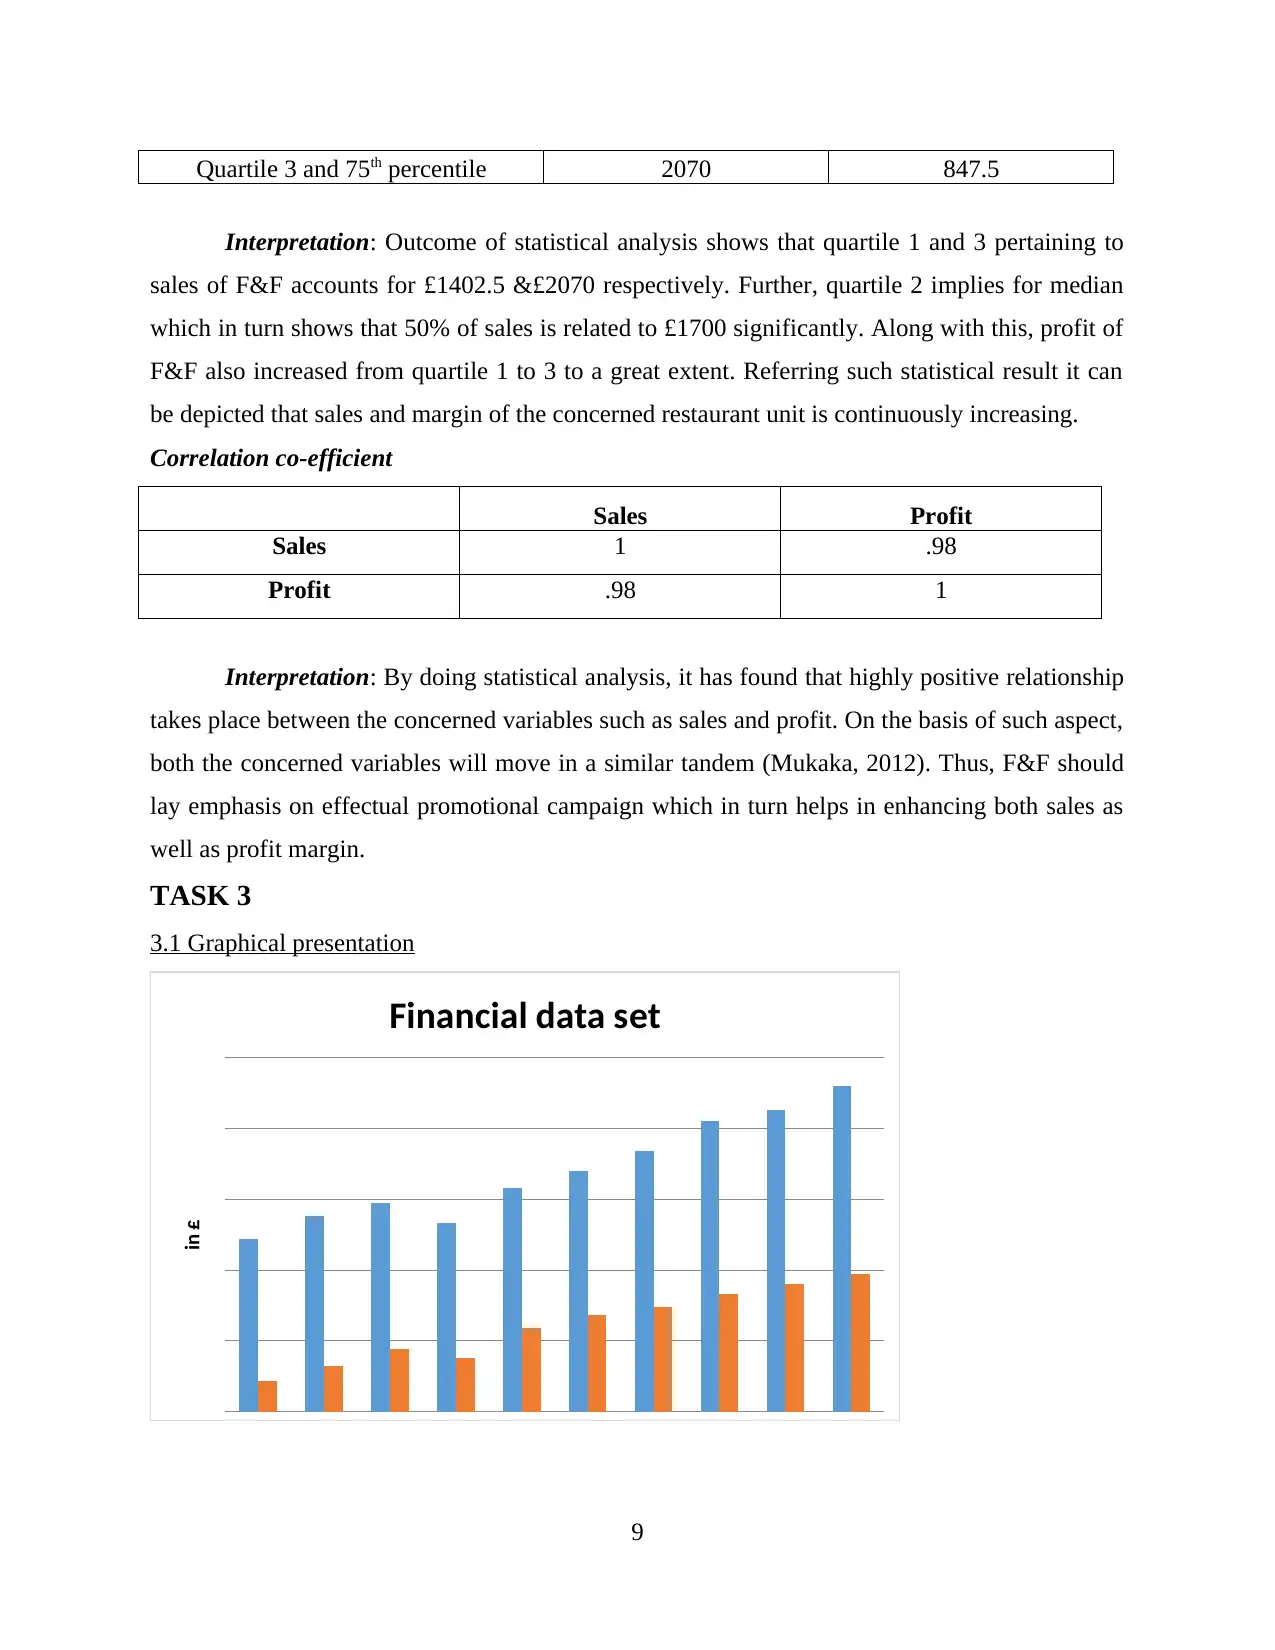
2008 2009 2010 2011 2012 2013 2014 2015 2016 2017
1220 1380 1470 1330
1580 1700 1840
2050 2130
2300
220 320 440 380
590 680 740 830 900 970
Line chart
Sales (in £) Profit (in £)
2008
2009
2010
2011
2012
2013
2014
2015
2016
2017
1220
1380
1470
1330
1580
1700
1840
2050
2130
2300
220
320
440
380
590
680
740
830
900
970
Bar chart
Profit (in £) Sales (in £)
Interpretation: The above column graph presents that in the year of 2008 sales of F&F
accounted for £1220 respectively. On the other side, at the end of 2017 sales revenue of
restaurant unit reached on £2300 significantly. Along with this, due to having positive
relationship profit margin of F&F also moved from £220 to £970. Hence, considering the trend
of financial data set it can be stated that customers prefer to visit restaurant more frequently.
Increasing sales pattern exhibits that customers are highly satisfied from the dinning services
which are offered by F&F.
10
⊘ This is a preview!⊘
Do you want full access?
Subscribe today to unlock all pages.
Trusted by 1+ million students worldwide
1 out of 19
Related Documents


Your All-in-One AI-Powered Toolkit for Academic Success.
+13062052269
info@desklib.com
Available 24*7 on WhatsApp / Email
![[object Object]](/_next/static/media/star-bottom.7253800d.svg)
Unlock your academic potential
Copyright © 2020–2026 A2Z Services. All Rights Reserved. Developed and managed by ZUCOL.