Business Decision Making Report: Balti Palace Expansion Plan
VerifiedAdded on 2020/01/07
|30
|5151
|489
Report
AI Summary
This report focuses on business decision-making for a restaurant chain, Balti Palace, planning to open a second location. The study assesses market potential and customer preferences regarding taste, price, and location through primary and secondary data collection. Primary data collection involved a survey using questionnaires to gather customer insights on dining habits, preferences, and spending. Secondary data includes past sales records and economic reports. The report summarizes the collected data using representative values like mean, mode, and median, along with graphical representations to analyze customer behavior and trends. It also explores measures of dispersion, quartiles, percentiles, and correlation in a business context. Furthermore, the report includes trend lines for forecasting and concludes with a business presentation and a formal business report, incorporating information processing and financial tools for decision-making regarding the new restaurant venture.

BUSINESS DECISION
MAKING
MAKING
Paraphrase This Document
Need a fresh take? Get an instant paraphrase of this document with our AI Paraphraser
Table of Contents
INTRODUCTION...........................................................................................................................1
TASK 1............................................................................................................................................1
1.1 Presenting data gathering plan..........................................................................................1
1.2: Methodology of survey and used sample framework.....................................................2
1.3: Designing a questionnaire...............................................................................................3
TASK 2............................................................................................................................................5
2.1: Summary of data by the use of representative values.....................................................5
2.2: Analysis of the result.....................................................................................................11
2.3: Analysing data using measures of dispersion................................................................11
2.4: Explanation of quartile, percentile and correlation in business context........................12
TASK 3..........................................................................................................................................14
3.1: Producing graphs for drawing valid conclusions..........................................................14
3.2: Trend line to forecast future information......................................................................16
3.3: Business presentation....................................................................................................16
3.4: Formal business report..................................................................................................22
TASK 4..........................................................................................................................................23
4.1: Information processing tools.........................................................................................23
4.2: Project plan for new restaurant......................................................................................23
4.3: Financial tools for decision making..............................................................................25
CONCLUSION..............................................................................................................................26
REFERENCES..............................................................................................................................27

⊘ This is a preview!⊘
Do you want full access?
Subscribe today to unlock all pages.
Trusted by 1+ million students worldwide
INTRODUCTION
The business decisions are key drivers which leads an organization towards the success,
as the organization productivity and profitability is mostly depend on the business decision
which they take. The business decision are considered as choosing the action from a set of
alternatives for the purpose of achieve managerial and organizational goals and objectives. The
decision making process is consistent and indispensable component of controlling any business
activities of the organization. The business decision making cover the overall operations which
an organization perform, decision are made each and every level of the organization or the
purpose of ensuring that the goals and objectives set by the organization achieve smoothly and
efficiently(Yager and Kacprzyk, 2012). The present study is focused upon a restaurant chain the
Balti palace who are offering the food and associated services to their customers. Are planning to
open their second restaurant in London. For this purpose shareholder of the restaurant want to
know the potentiality of the market, so the study is focused on accessing the customer preference
about the taste price and location. The role of mean, mode, median, co-relation also been
discussed so that the viable argument can be made.
TASK 1
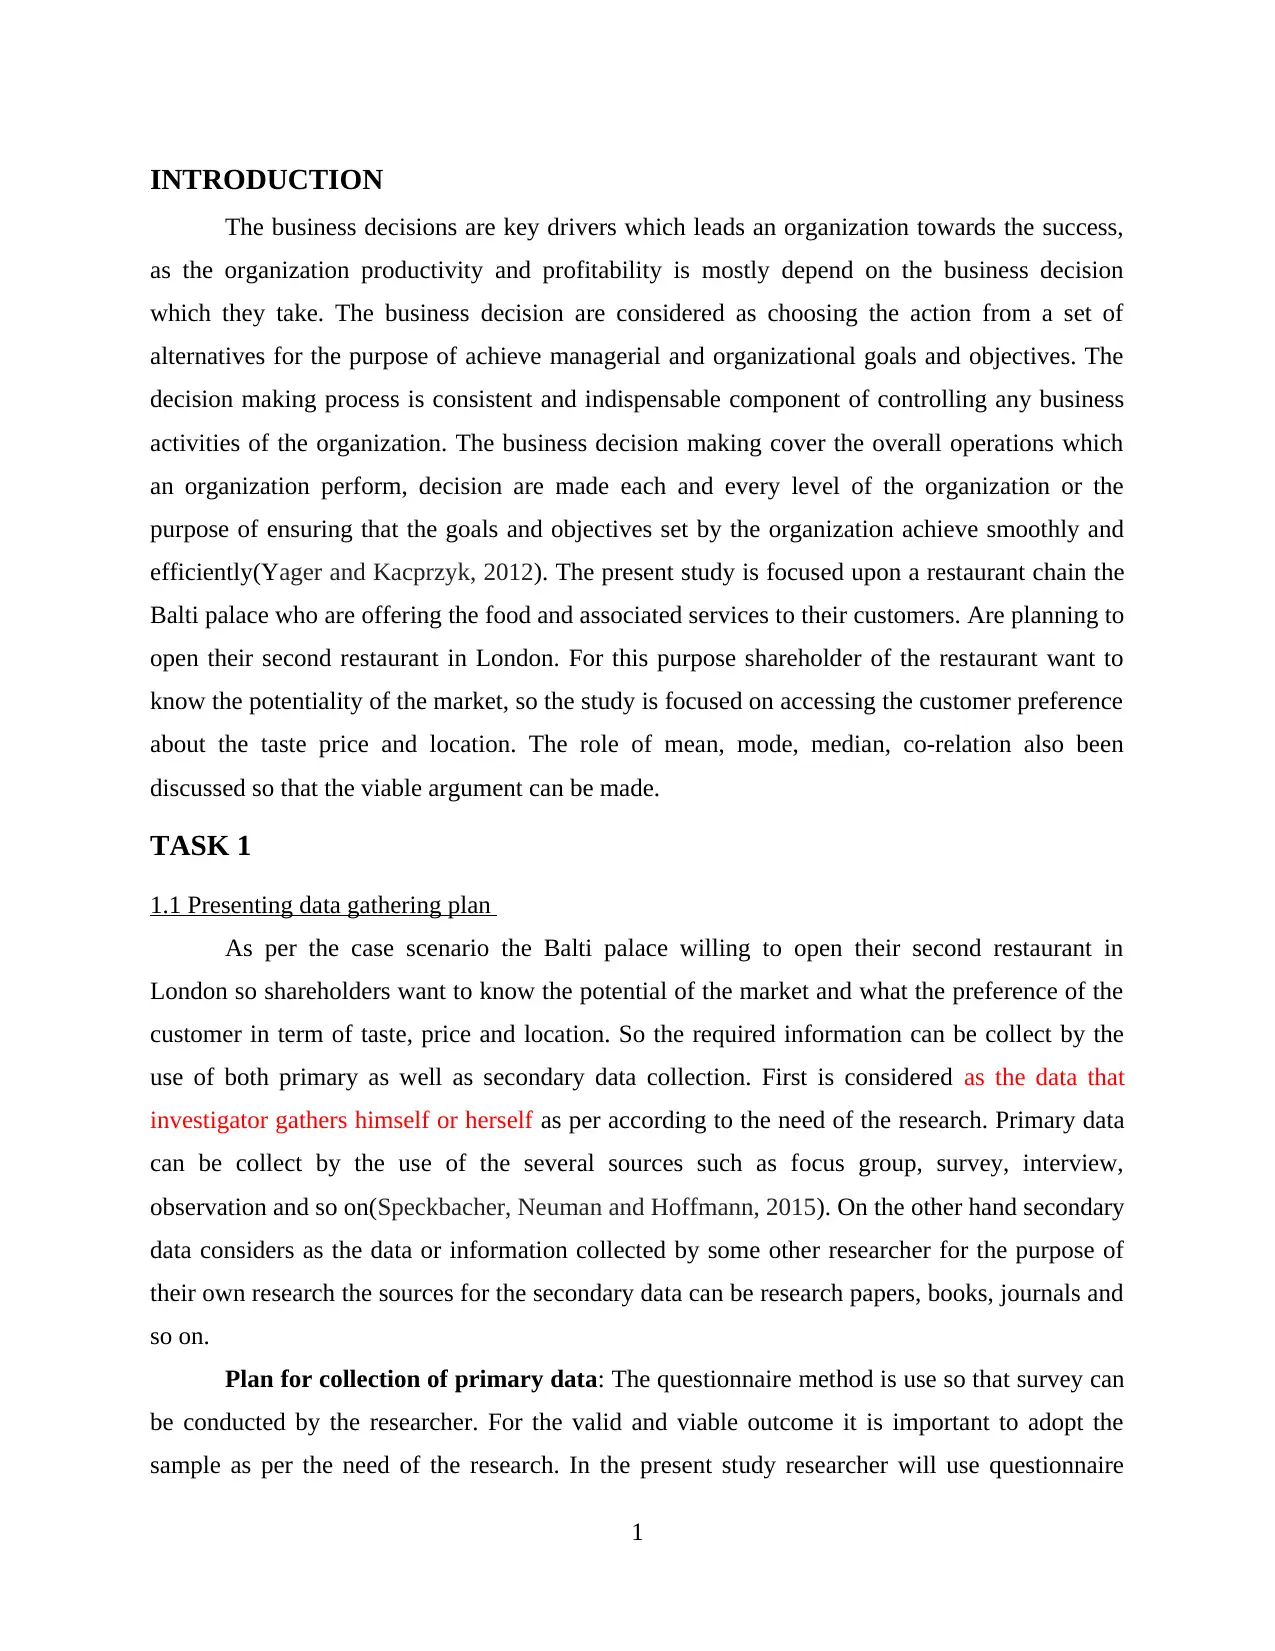
1.1 Presenting data gathering plan
As per the case scenario the Balti palace willing to open their second restaurant in
London so shareholders want to know the potential of the market and what the preference of the
customer in term of taste, price and location. So the required information can be collect by the
use of both primary as well as secondary data collection. First is considered as the data that
investigator gathers himself or herself as per according to the need of the research. Primary data
can be collect by the use of the several sources such as focus group, survey, interview,
observation and so on(Speckbacher, Neuman and Hoffmann, 2015). On the other hand secondary
data considers as the data or information collected by some other researcher for the purpose of
their own research the sources for the secondary data can be research papers, books, journals and
so on.
Plan for collection of primary data: The questionnaire method is use so that survey can
be conducted by the researcher. For the valid and viable outcome it is important to adopt the
sample as per the need of the research. In the present study researcher will use questionnaire
1
The business decisions are key drivers which leads an organization towards the success,
as the organization productivity and profitability is mostly depend on the business decision
which they take. The business decision are considered as choosing the action from a set of
alternatives for the purpose of achieve managerial and organizational goals and objectives. The
decision making process is consistent and indispensable component of controlling any business
activities of the organization. The business decision making cover the overall operations which
an organization perform, decision are made each and every level of the organization or the
purpose of ensuring that the goals and objectives set by the organization achieve smoothly and
efficiently(Yager and Kacprzyk, 2012). The present study is focused upon a restaurant chain the
Balti palace who are offering the food and associated services to their customers. Are planning to
open their second restaurant in London. For this purpose shareholder of the restaurant want to
know the potentiality of the market, so the study is focused on accessing the customer preference
about the taste price and location. The role of mean, mode, median, co-relation also been
discussed so that the viable argument can be made.
TASK 1
1.1 Presenting data gathering plan
As per the case scenario the Balti palace willing to open their second restaurant in
London so shareholders want to know the potential of the market and what the preference of the
customer in term of taste, price and location. So the required information can be collect by the
use of both primary as well as secondary data collection. First is considered as the data that
investigator gathers himself or herself as per according to the need of the research. Primary data
can be collect by the use of the several sources such as focus group, survey, interview,
observation and so on(Speckbacher, Neuman and Hoffmann, 2015). On the other hand secondary
data considers as the data or information collected by some other researcher for the purpose of
their own research the sources for the secondary data can be research papers, books, journals and
so on.
Plan for collection of primary data: The questionnaire method is use so that survey can
be conducted by the researcher. For the valid and viable outcome it is important to adopt the
sample as per the need of the research. In the present study researcher will use questionnaire
1
Paraphrase This Document
Need a fresh take? Get an instant paraphrase of this document with our AI Paraphraser
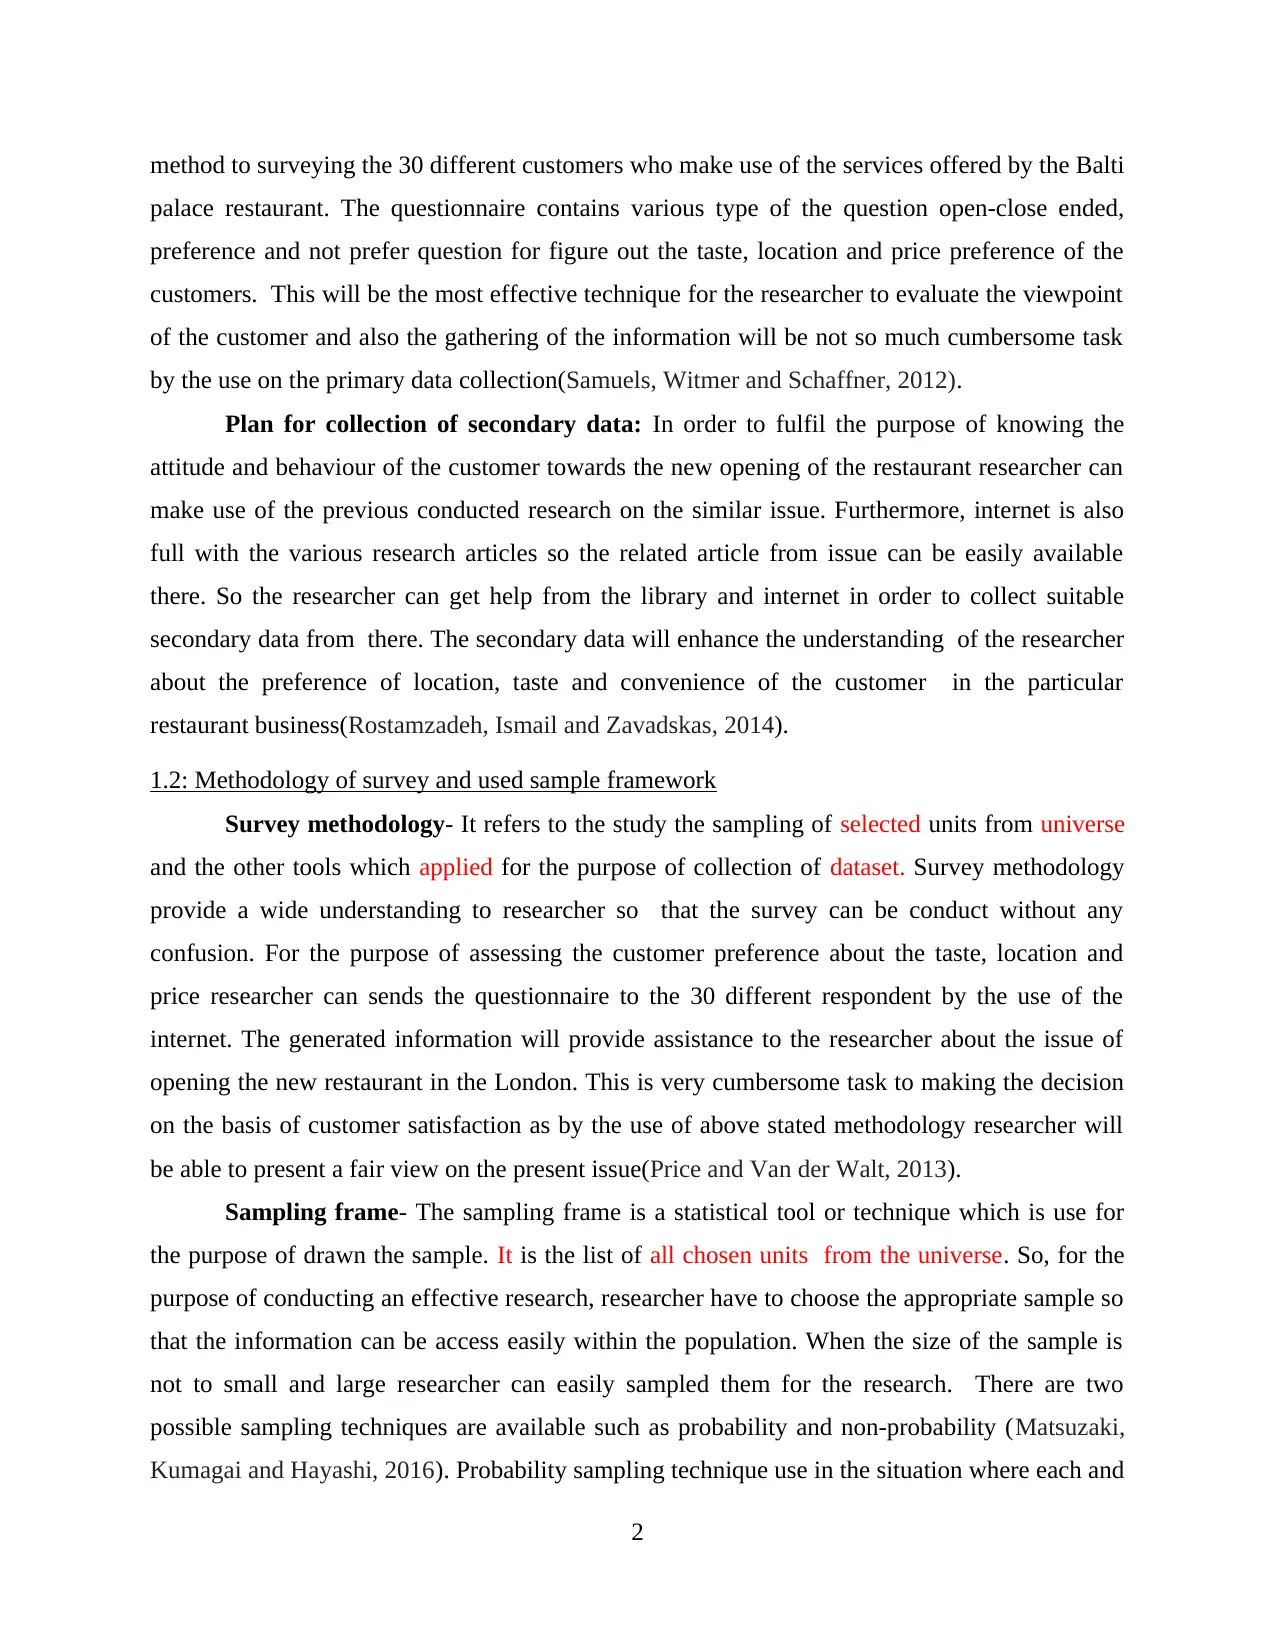
method to surveying the 30 different customers who make use of the services offered by the Balti
palace restaurant. The questionnaire contains various type of the question open-close ended,
preference and not prefer question for figure out the taste, location and price preference of the
customers. This will be the most effective technique for the researcher to evaluate the viewpoint
of the customer and also the gathering of the information will be not so much cumbersome task
by the use on the primary data collection(Samuels, Witmer and Schaffner, 2012).
Plan for collection of secondary data: In order to fulfil the purpose of knowing the
attitude and behaviour of the customer towards the new opening of the restaurant researcher can
make use of the previous conducted research on the similar issue. Furthermore, internet is also
full with the various research articles so the related article from issue can be easily available
there. So the researcher can get help from the library and internet in order to collect suitable
secondary data from there. The secondary data will enhance the understanding of the researcher
about the preference of location, taste and convenience of the customer in the particular
restaurant business(Rostamzadeh, Ismail and Zavadskas, 2014).
1.2: Methodology of survey and used sample framework
Survey methodology- It refers to the study the sampling of selected units from universe
and the other tools which applied for the purpose of collection of dataset. Survey methodology
provide a wide understanding to researcher so that the survey can be conduct without any
confusion. For the purpose of assessing the customer preference about the taste, location and
price researcher can sends the questionnaire to the 30 different respondent by the use of the
internet. The generated information will provide assistance to the researcher about the issue of
opening the new restaurant in the London. This is very cumbersome task to making the decision
on the basis of customer satisfaction as by the use of above stated methodology researcher will
be able to present a fair view on the present issue(Price and Van der Walt, 2013).
Sampling frame- The sampling frame is a statistical tool or technique which is use for
the purpose of drawn the sample. It is the list of all chosen units from the universe. So, for the
purpose of conducting an effective research, researcher have to choose the appropriate sample so
that the information can be access easily within the population. When the size of the sample is
not to small and large researcher can easily sampled them for the research. There are two
possible sampling techniques are available such as probability and non-probability (Matsuzaki,
Kumagai and Hayashi, 2016). Probability sampling technique use in the situation where each and
2
every person among the population get the chance to being selected in the sample. On the other
hand in the non-probability sampling technique researcher will select the sample size on the basis
of aim and objectives of the study. The sampling frame in the present study consist 30
respondent.
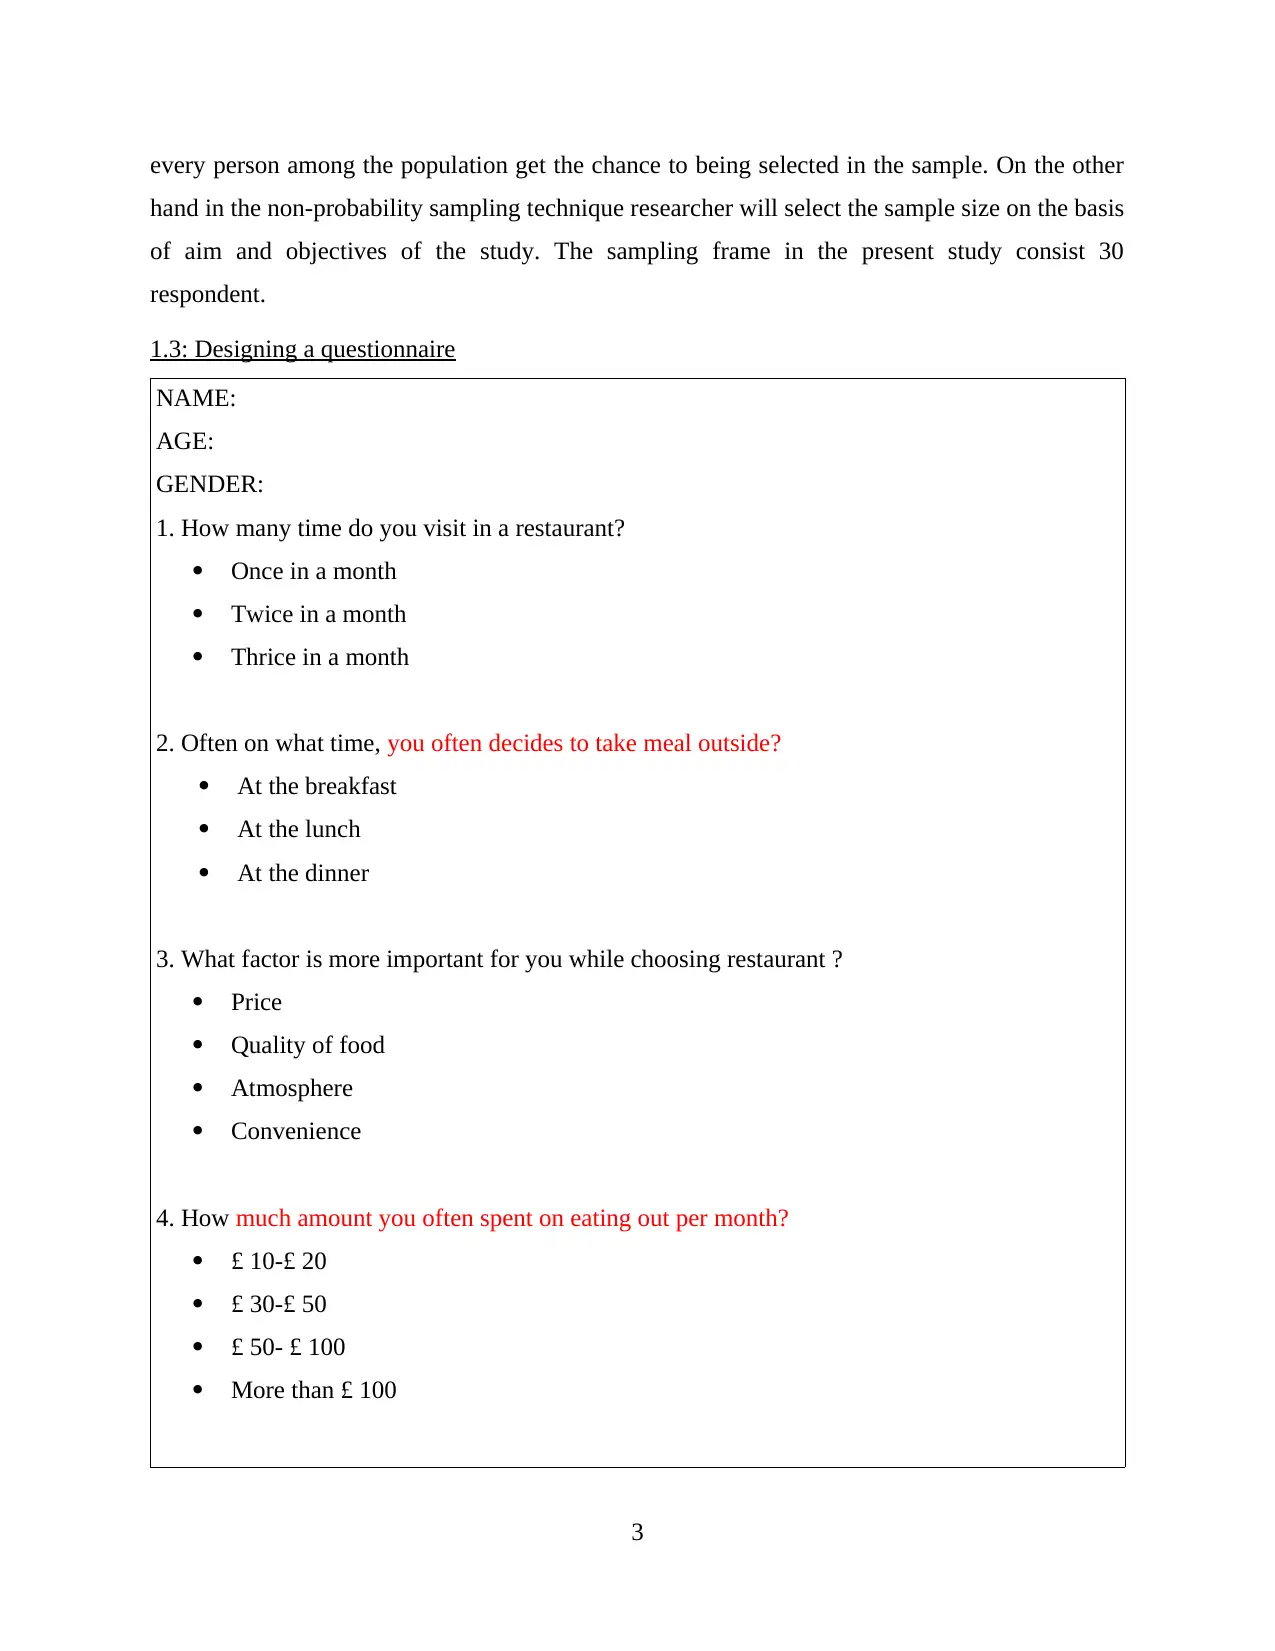
1.3: Designing a questionnaire
NAME:
AGE:
GENDER:
1. How many time do you visit in a restaurant?
Once in a month
Twice in a month
Thrice in a month
2. Often on what time, you often decides to take meal outside?
At the breakfast
At the lunch
At the dinner
3. What factor is more important for you while choosing restaurant ?
Price
Quality of food
Atmosphere
Convenience
4. How much amount you often spent on eating out per month?
£ 10-£ 20
£ 30-£ 50
£ 50- £ 100
More than £ 100
3
hand in the non-probability sampling technique researcher will select the sample size on the basis
of aim and objectives of the study. The sampling frame in the present study consist 30
respondent.
1.3: Designing a questionnaire
NAME:
AGE:
GENDER:
1. How many time do you visit in a restaurant?
Once in a month
Twice in a month
Thrice in a month
2. Often on what time, you often decides to take meal outside?
At the breakfast
At the lunch
At the dinner
3. What factor is more important for you while choosing restaurant ?
Price
Quality of food
Atmosphere
Convenience
4. How much amount you often spent on eating out per month?
£ 10-£ 20
£ 30-£ 50
£ 50- £ 100
More than £ 100
3
⊘ This is a preview!⊘
Do you want full access?
Subscribe today to unlock all pages.
Trusted by 1+ million students worldwide
5. What are the challenges which you face during eating in a restaurant?
Cuisine
Communication barrier
Different charges
Variety of meal
6. While your go in the restaurant, which factors highly encourage or motivate you?
Ambiance
Quality of services
Hygiene
Deals and offers
7. Among the following restaurant which one is on the top in your priority list ?
Black-friars restaurant
Food for friends
Murano
Balti palace
8. Do you choose such restaurants which provide dine-in or take away facilities?
Dine in
Take away
Both
9. Which type of food you mostly like to have ?
Chinese
Spanish
Indian
Intercontinental
10. Any recommendation which you want to give to Balti palace.............................
4
Paraphrase This Document
Need a fresh take? Get an instant paraphrase of this document with our AI Paraphraser
TASK 2
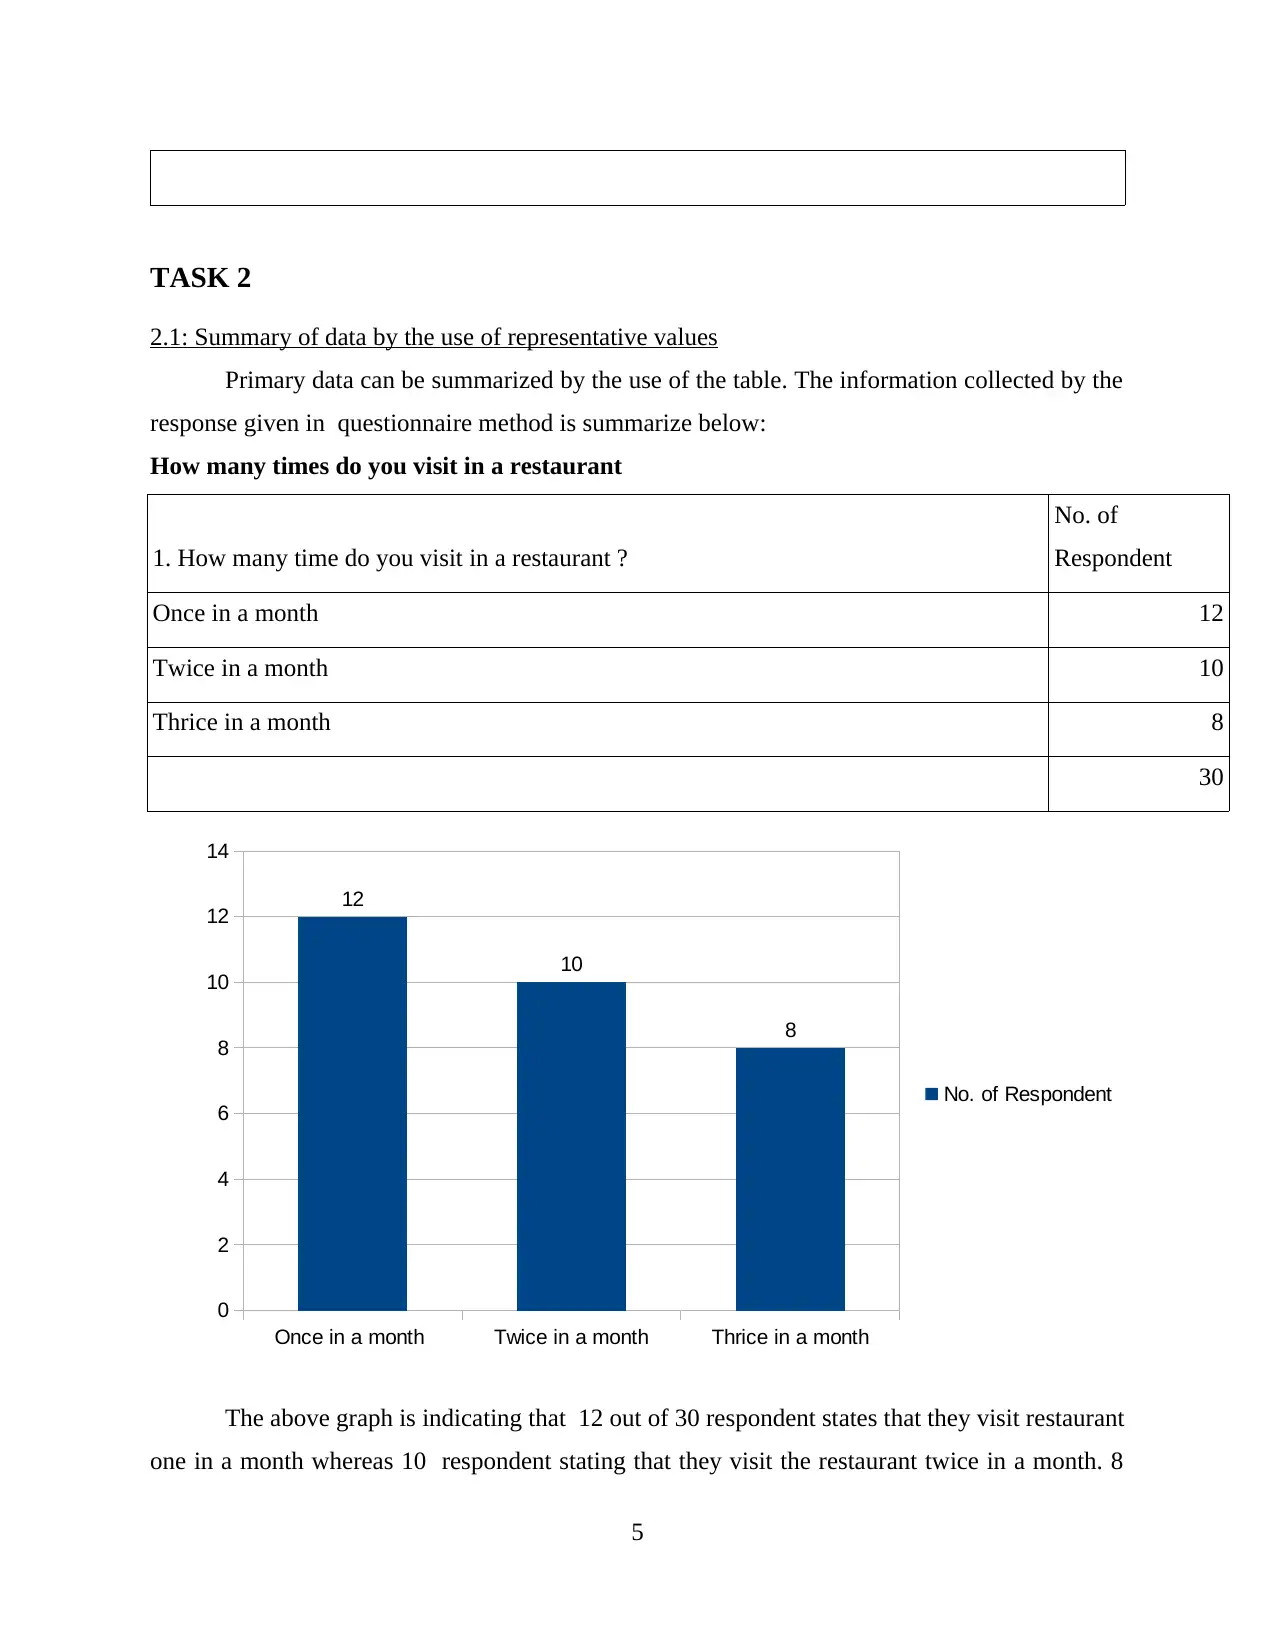
2.1: Summary of data by the use of representative values
Primary data can be summarized by the use of the table. The information collected by the
response given in questionnaire method is summarize below:
How many times do you visit in a restaurant
1. How many time do you visit in a restaurant ?
No. of
Respondent
Once in a month 12
Twice in a month 10
Thrice in a month 8
30
The above graph is indicating that 12 out of 30 respondent states that they visit restaurant
one in a month whereas 10 respondent stating that they visit the restaurant twice in a month. 8
5
Once in a month Twice in a month Thrice in a month
0
2
4
6
8
10
12
14
12
10
8
No. of Respondent
respondent visit in a restaurant thrice in a month. The analysis of collected data is clearly
indicating that people are interested in visiting in a restaurant several time in a month which is a
positive indicator for the Balti palace to start their second restaurant (Loe, Ferrell and Mansfield,
2013).
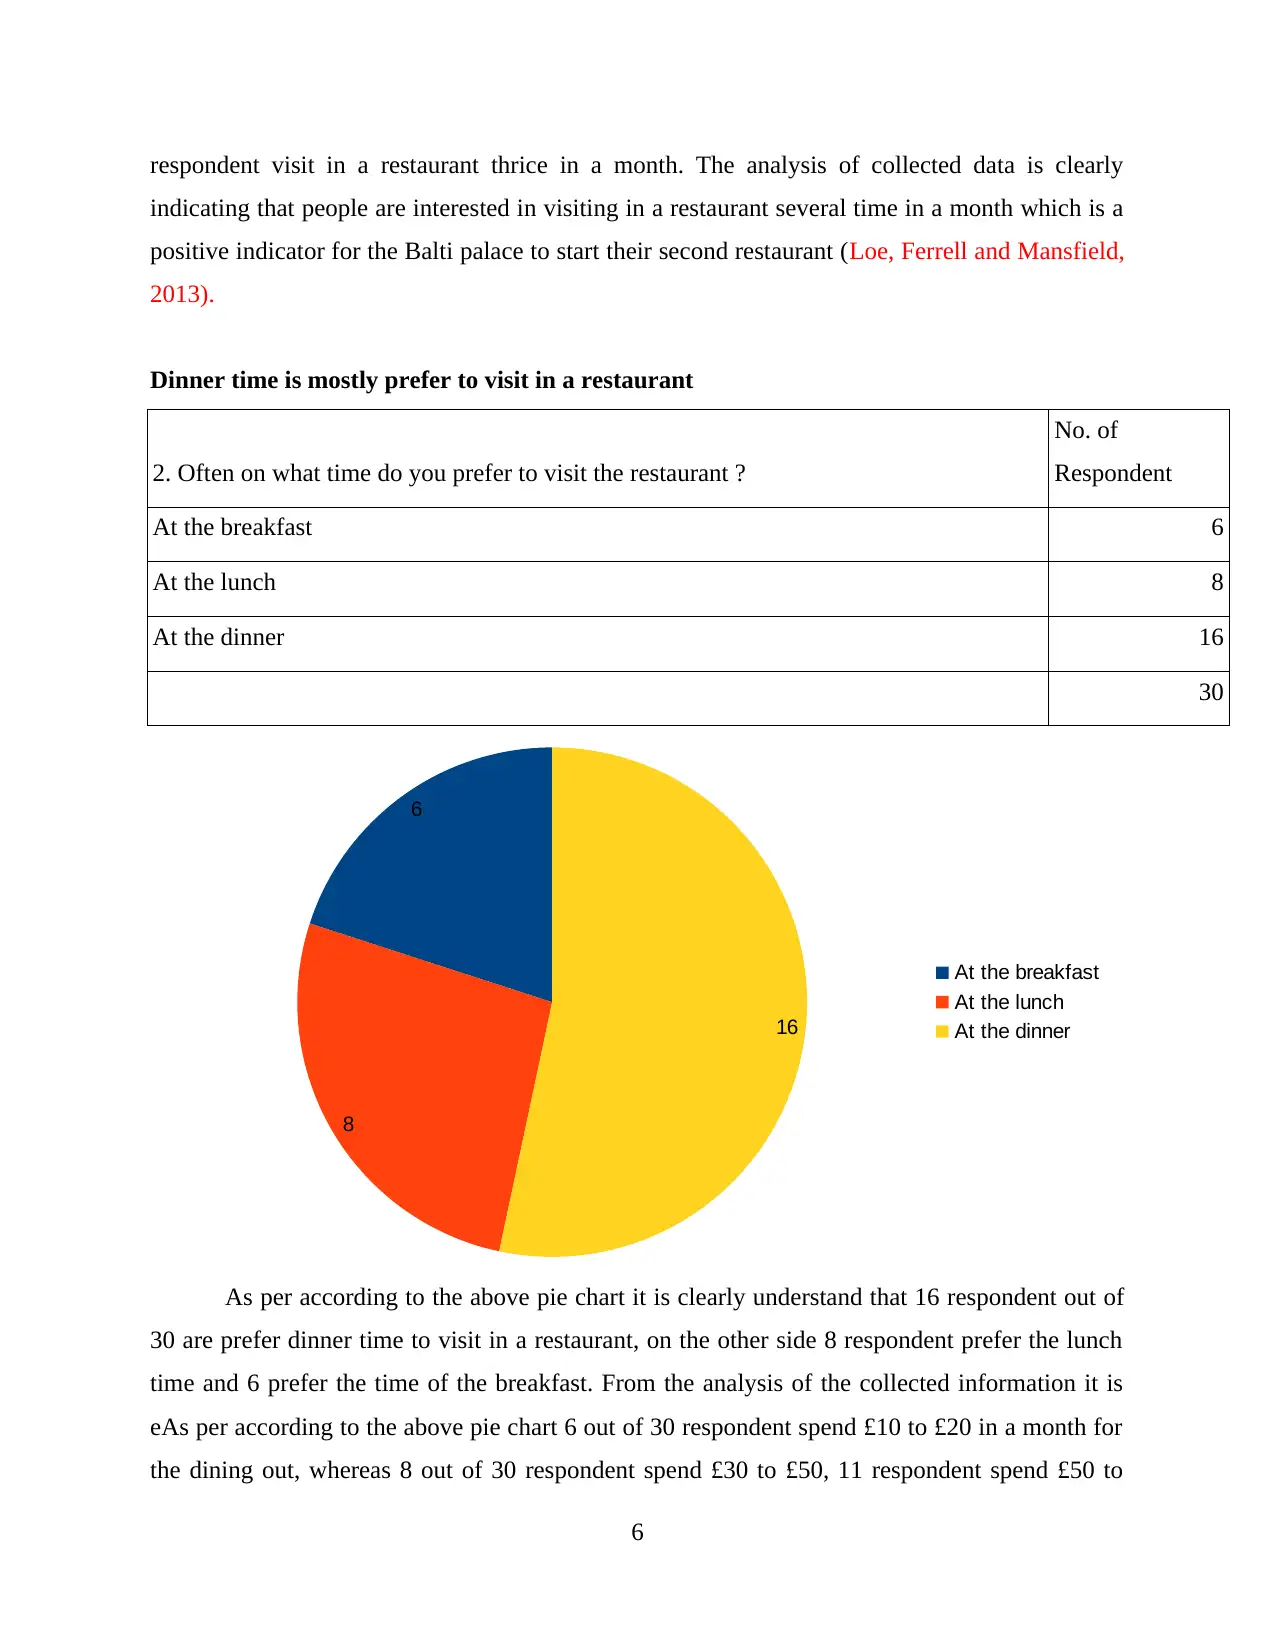
Dinner time is mostly prefer to visit in a restaurant
2. Often on what time do you prefer to visit the restaurant ?
No. of
Respondent
At the breakfast 6
At the lunch 8
At the dinner 16
30
As per according to the above pie chart it is clearly understand that 16 respondent out of
30 are prefer dinner time to visit in a restaurant, on the other side 8 respondent prefer the lunch
time and 6 prefer the time of the breakfast. From the analysis of the collected information it is
eAs per according to the above pie chart 6 out of 30 respondent spend £10 to £20 in a month for
the dining out, whereas 8 out of 30 respondent spend £30 to £50, 11 respondent spend £50 to
6
6
8
16
At the breakfast
At the lunch
At the dinner
indicating that people are interested in visiting in a restaurant several time in a month which is a
positive indicator for the Balti palace to start their second restaurant (Loe, Ferrell and Mansfield,
2013).
Dinner time is mostly prefer to visit in a restaurant
2. Often on what time do you prefer to visit the restaurant ?
No. of
Respondent
At the breakfast 6
At the lunch 8
At the dinner 16
30
As per according to the above pie chart it is clearly understand that 16 respondent out of
30 are prefer dinner time to visit in a restaurant, on the other side 8 respondent prefer the lunch
time and 6 prefer the time of the breakfast. From the analysis of the collected information it is
eAs per according to the above pie chart 6 out of 30 respondent spend £10 to £20 in a month for
the dining out, whereas 8 out of 30 respondent spend £30 to £50, 11 respondent spend £50 to
6
6
8
16
At the breakfast
At the lunch
At the dinner
⊘ This is a preview!⊘
Do you want full access?
Subscribe today to unlock all pages.
Trusted by 1+ million students worldwide
£100 in a month and 5 respondent spend more than £100 in a month. The analysis of the
collected information easily making the understanding that people are often spend on the dining
out so it will be beneficial for the Balti palace to open a restaurant. asily understand that Balti
palace should target the dinner time to attract the more customer in their new restaurant.
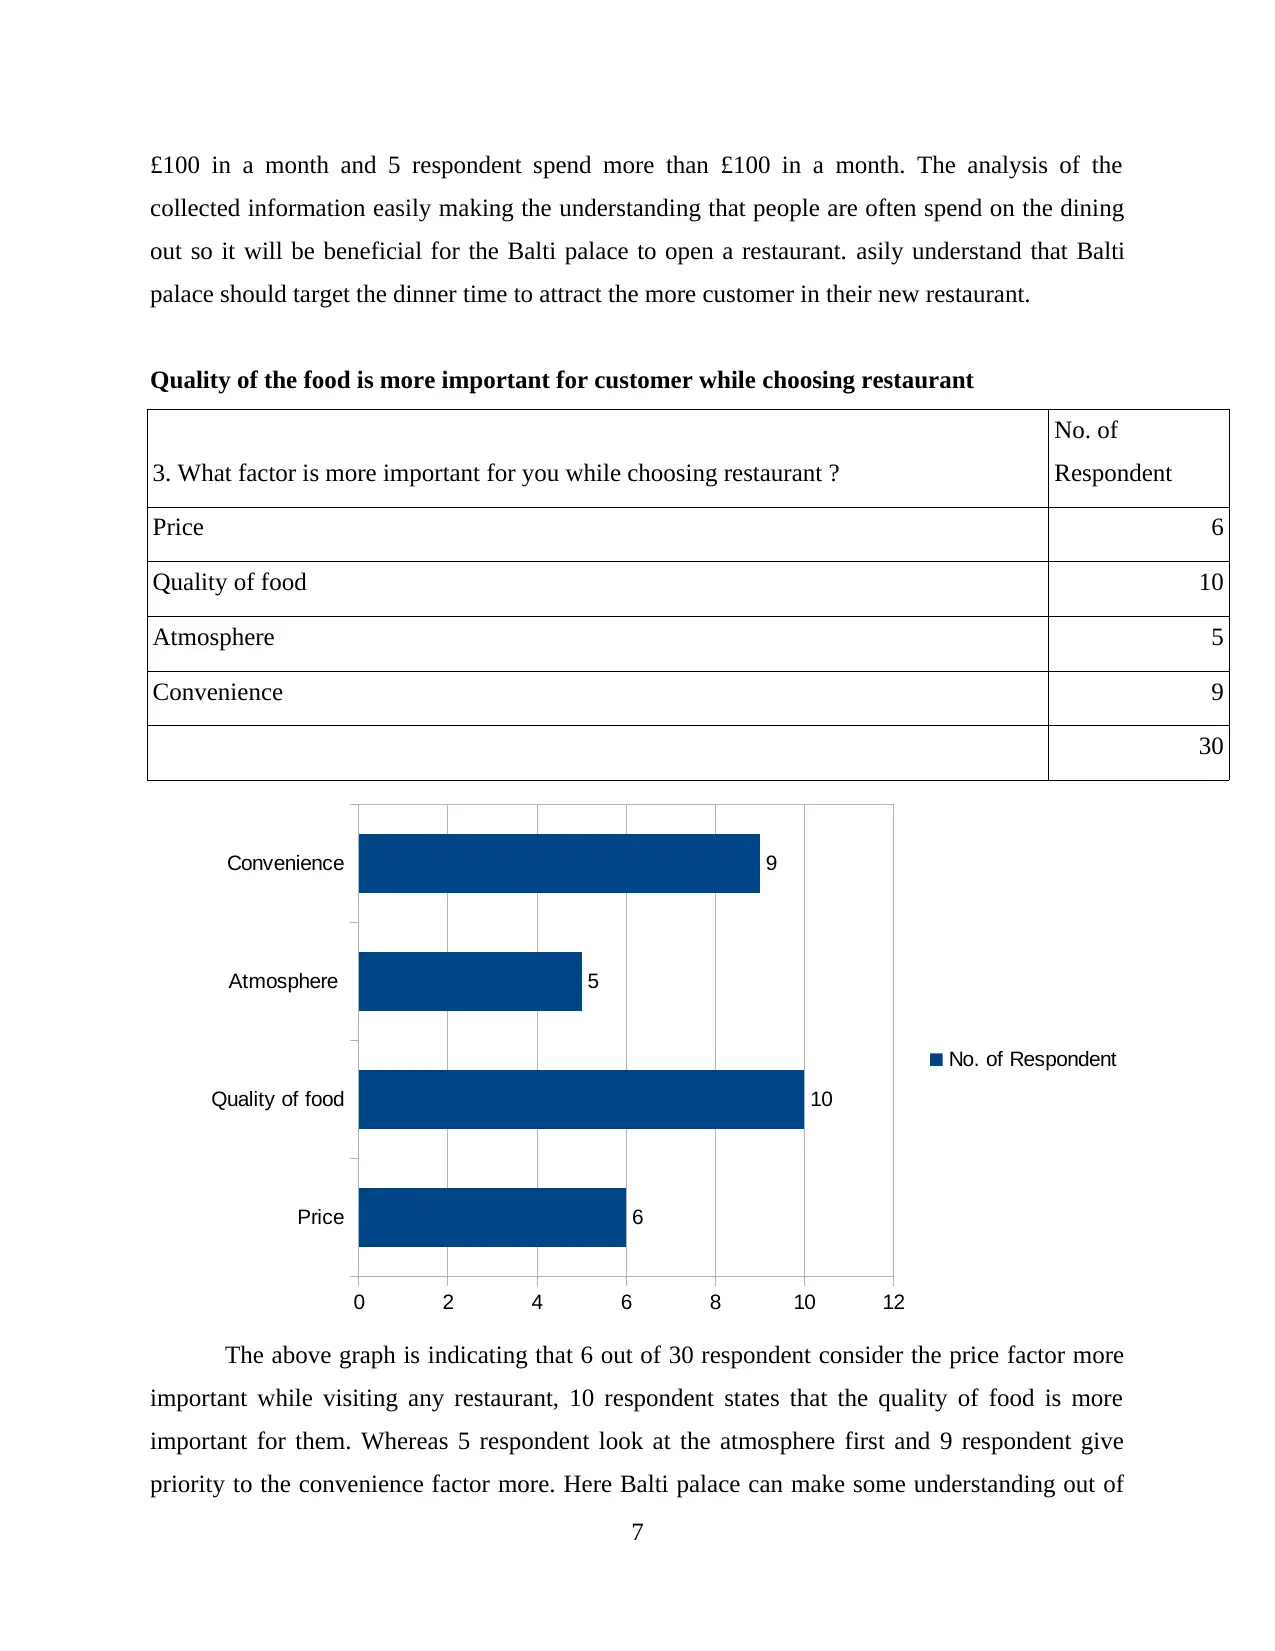
Quality of the food is more important for customer while choosing restaurant
3. What factor is more important for you while choosing restaurant ?
No. of
Respondent
Price 6
Quality of food 10
Atmosphere 5
Convenience 9
30
The above graph is indicating that 6 out of 30 respondent consider the price factor more
important while visiting any restaurant, 10 respondent states that the quality of food is more
important for them. Whereas 5 respondent look at the atmosphere first and 9 respondent give
priority to the convenience factor more. Here Balti palace can make some understanding out of
7
Price
Quality of food
Atmosphere
Convenience
0 2 4 6 8 10 12
6
10
5
9
No. of Respondent
collected information easily making the understanding that people are often spend on the dining
out so it will be beneficial for the Balti palace to open a restaurant. asily understand that Balti
palace should target the dinner time to attract the more customer in their new restaurant.
Quality of the food is more important for customer while choosing restaurant
3. What factor is more important for you while choosing restaurant ?
No. of
Respondent
Price 6
Quality of food 10
Atmosphere 5
Convenience 9
30
The above graph is indicating that 6 out of 30 respondent consider the price factor more
important while visiting any restaurant, 10 respondent states that the quality of food is more
important for them. Whereas 5 respondent look at the atmosphere first and 9 respondent give
priority to the convenience factor more. Here Balti palace can make some understanding out of
7
Price
Quality of food
Atmosphere
Convenience
0 2 4 6 8 10 12
6
10
5
9
No. of Respondent
Paraphrase This Document
Need a fresh take? Get an instant paraphrase of this document with our AI Paraphraser
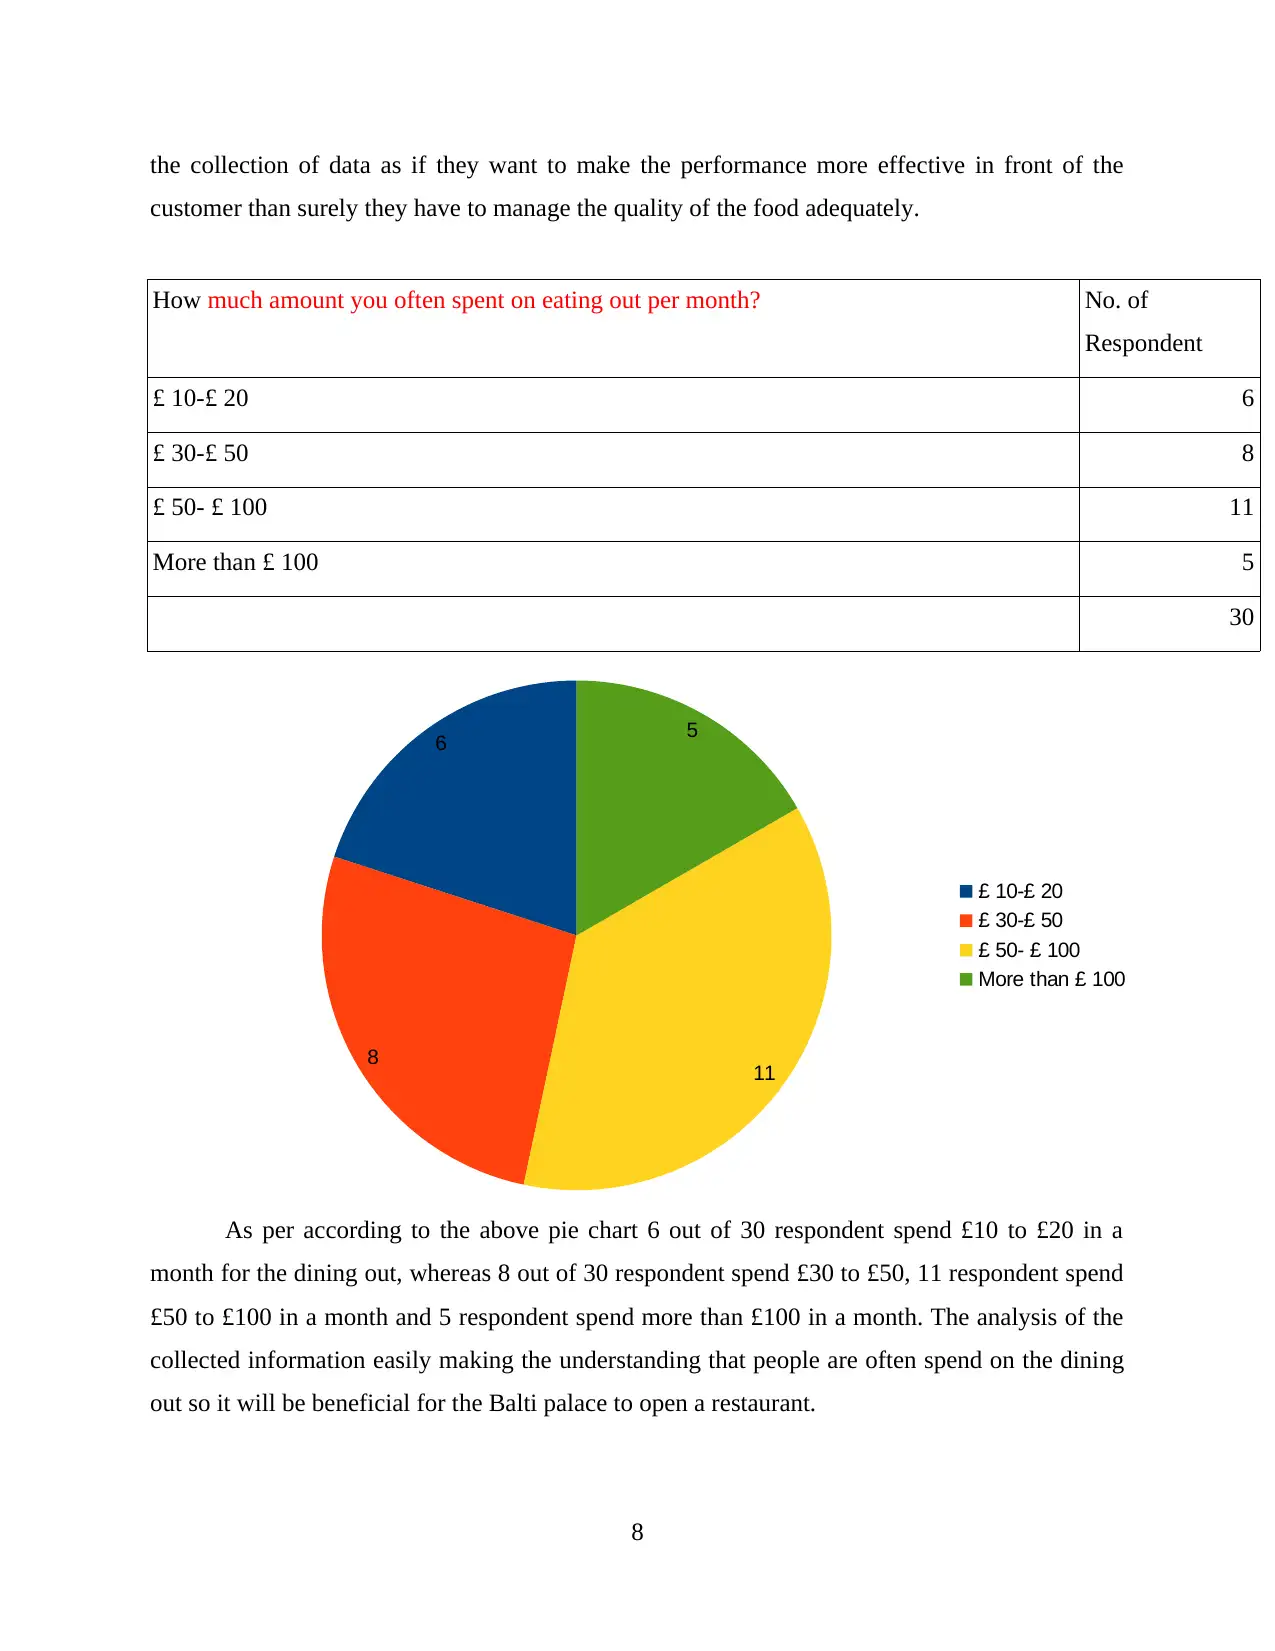
the collection of data as if they want to make the performance more effective in front of the
customer than surely they have to manage the quality of the food adequately.
How much amount you often spent on eating out per month? No. of
Respondent
£ 10-£ 20 6
£ 30-£ 50 8
£ 50- £ 100 11
More than £ 100 5
30
As per according to the above pie chart 6 out of 30 respondent spend £10 to £20 in a
month for the dining out, whereas 8 out of 30 respondent spend £30 to £50, 11 respondent spend
£50 to £100 in a month and 5 respondent spend more than £100 in a month. The analysis of the
collected information easily making the understanding that people are often spend on the dining
out so it will be beneficial for the Balti palace to open a restaurant.
8
6
8 11
5
£ 10-£ 20
£ 30-£ 50
£ 50- £ 100
More than £ 100
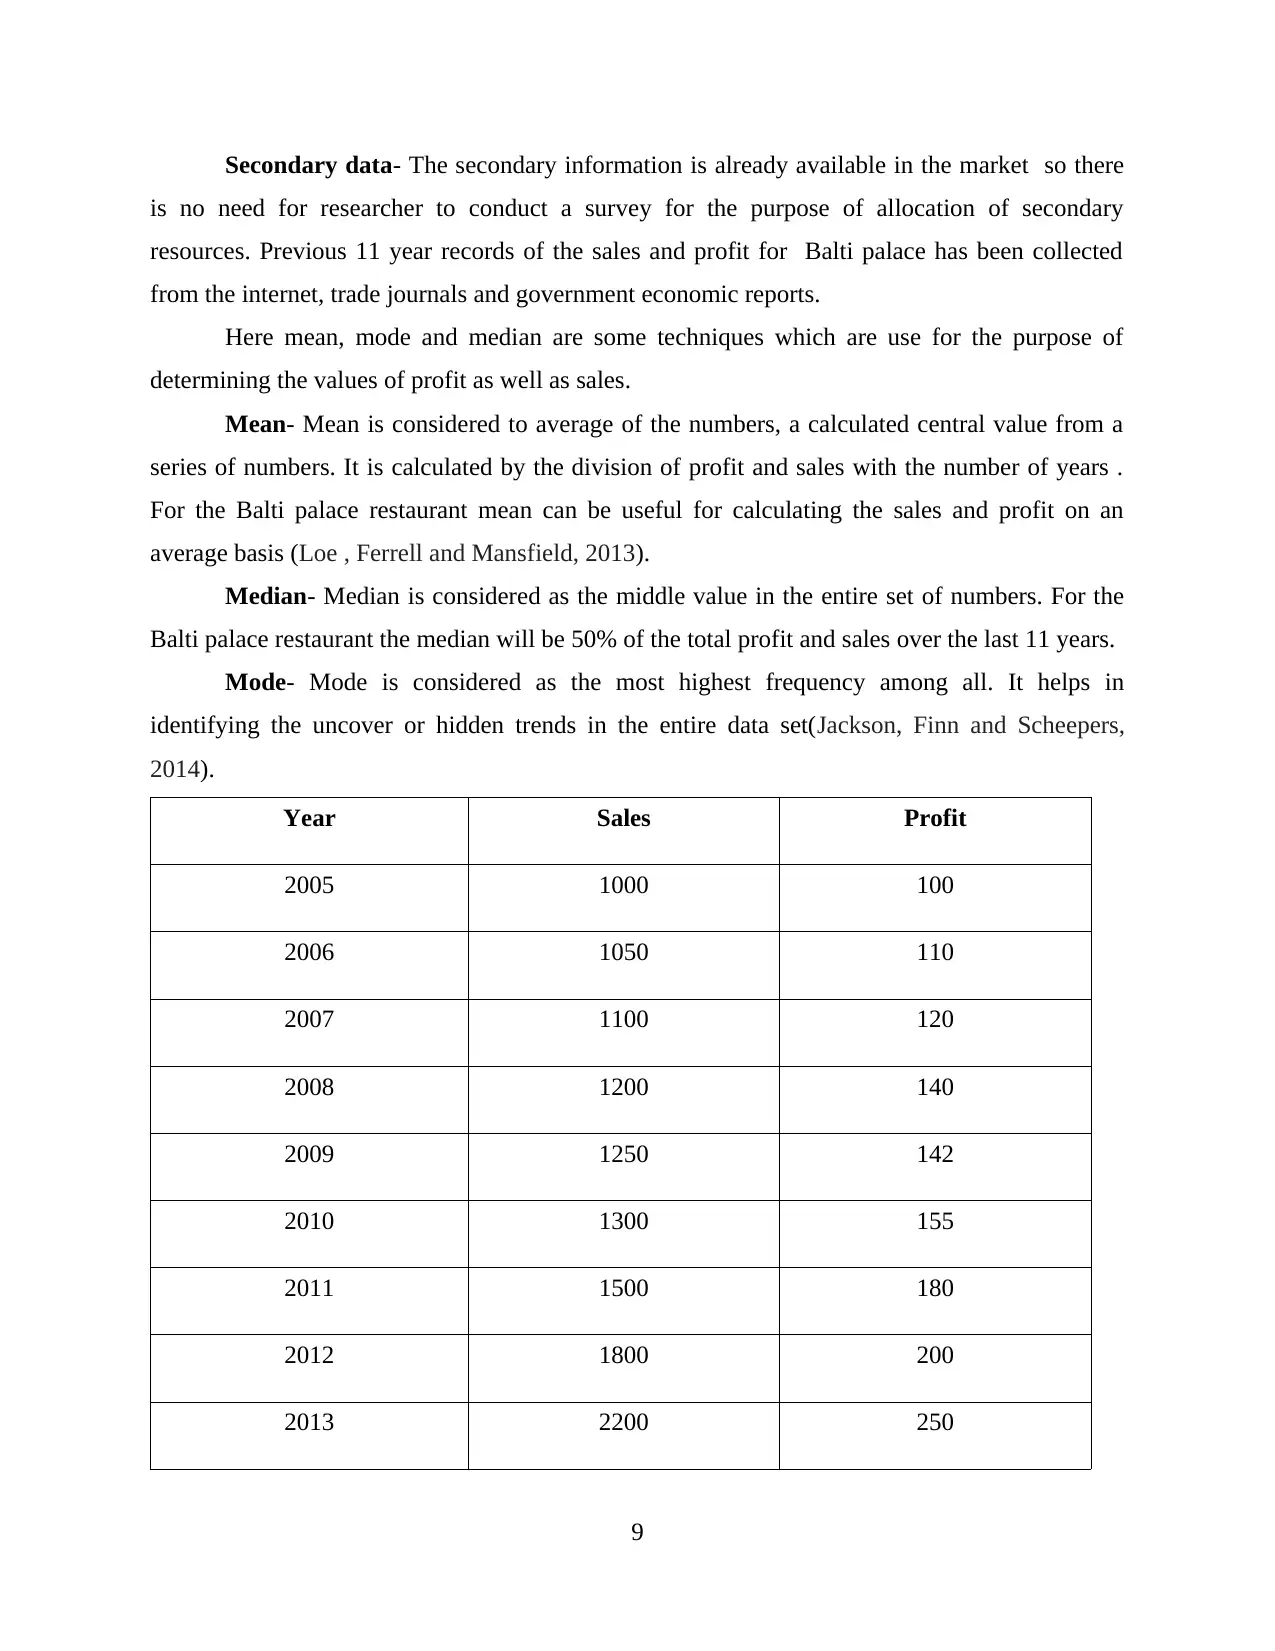
Secondary data- The secondary information is already available in the market so there
is no need for researcher to conduct a survey for the purpose of allocation of secondary
resources. Previous 11 year records of the sales and profit for Balti palace has been collected
from the internet, trade journals and government economic reports.
Here mean, mode and median are some techniques which are use for the purpose of
determining the values of profit as well as sales.
Mean- Mean is considered to average of the numbers, a calculated central value from a
series of numbers. It is calculated by the division of profit and sales with the number of years .
For the Balti palace restaurant mean can be useful for calculating the sales and profit on an
average basis (Loe , Ferrell and Mansfield, 2013).
Median- Median is considered as the middle value in the entire set of numbers. For the
Balti palace restaurant the median will be 50% of the total profit and sales over the last 11 years.
Mode- Mode is considered as the most highest frequency among all. It helps in
identifying the uncover or hidden trends in the entire data set(Jackson, Finn and Scheepers,
2014).
Year Sales Profit
2005 1000 100
2006 1050 110
2007 1100 120
2008 1200 140
2009 1250 142
2010 1300 155
2011 1500 180
2012 1800 200
2013 2200 250
9
⊘ This is a preview!⊘
Do you want full access?
Subscribe today to unlock all pages.
Trusted by 1+ million students worldwide
1 out of 30
Related Documents


Your All-in-One AI-Powered Toolkit for Academic Success.
+13062052269
info@desklib.com
Available 24*7 on WhatsApp / Email
![[object Object]](/_next/static/media/star-bottom.7253800d.svg)
Unlock your academic potential
Copyright © 2020–2026 A2Z Services. All Rights Reserved. Developed and managed by ZUCOL.