Business Decision Making Report
VerifiedAdded on 2020/10/04
|27
|2712
|59
Report
AI Summary
This report focuses on business decision-making strategies, emphasizing the importance of data collection through primary and secondary sources. It includes a detailed survey methodology, questionnaire design, and analysis of survey results to inform decisions regarding the opening of a new restaurant in London. The report also discusses the critical path method for project management and evaluates the financial viability of the proposed investment.
Business Decision Making
1
1
Paraphrase This Document
Need a fresh take? Get an instant paraphrase of this document with our AI Paraphraser
Table of Contents
Task 1..............................................................................................................................................3
Task 2..............................................................................................................................................5
Task 3..............................................................................................................................................9
Task 4............................................................................................................................................15
......................................................................................................................................................17
References.....................................................................................................................................19
2
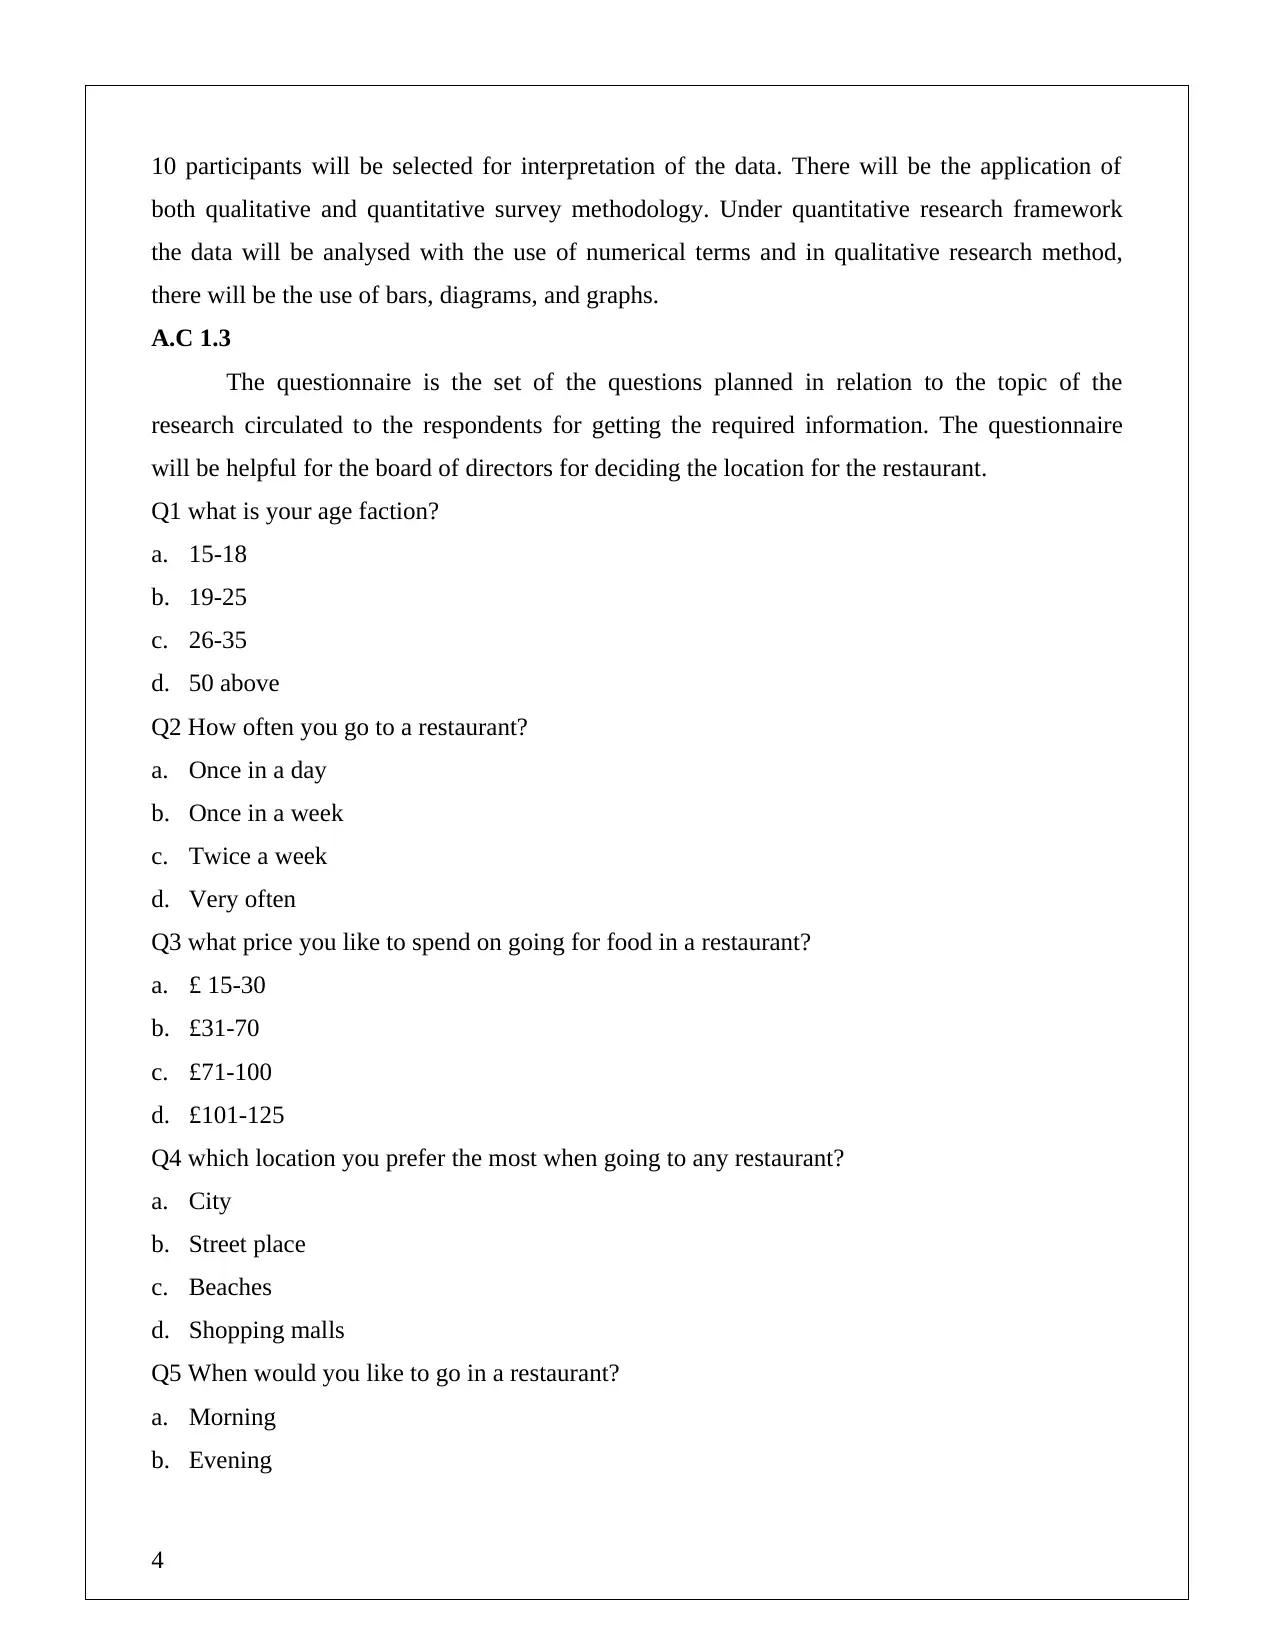
Task 1
A.C 1.1
The research aims to collect the data which can help in understanding the price, taste, and
preferences for a location for opening the second restaurant in London.
The data will be collected from both primary and secondary source. Primary data will
collect the direct information from the customers or can also be said to be first-hand information.
The researcher himself collects the information which can be via email, face to face and
telephone. For the collecting, the primary data the questionnaire will be prepared including open-
ended questions (Osborne, 2012). There will be minimum 10 questions to be asked under the
questionnaire. The questionnaire will be posted via using online platform where customers who
are interested can fill their forms and the data collected will be helpful in opening the second
restaurant “food for friends”.
Another source for collecting the data is the secondary data collection under which the
data has already been collected and scrutinized by another researcher. The secondary data will be
collected through directory, articles, journals which are containing the details of the existing
restaurants and the menu of the restaurants.
A.C 1.2
Survey methodology is the method to be used or involved in conducting a survey on the
population of London. A comprehensive research method will be implemented for accumulating
the significant information for the business decision making (Mackey and Gass, 2015). The
survey can be conducted by telephone, mails or personal interview. The survey will be
conducted on the 100 people determining their preferences, choices and liking for the restaurant.
The survey will be conducted with two essential elements which are questionnaire and sample
framework. But as discussed above the data will be collected via questionnaire sequenced in an
effective manner for obtaining the essential information. The questionnaire will be very
supportive in getting the data in a fair manner preventing biases. After performing the survey the
data will be positioned in the safe and secure place.
Sample framework will assist in studying the population. There are various methods for
sampling and for this research; there will be the use of simple random sampling method under
which every participant will get the equal opportunity to get selected. Among 100 respondents,
3
⊘ This is a preview!⊘
Do you want full access?
Subscribe today to unlock all pages.
Trusted by 1+ million students worldwide
10 participants will be selected for interpretation of the data. There will be the application of
both qualitative and quantitative survey methodology. Under quantitative research framework
the data will be analysed with the use of numerical terms and in qualitative research method,
there will be the use of bars, diagrams, and graphs.
A.C 1.3
The questionnaire is the set of the questions planned in relation to the topic of the
research circulated to the respondents for getting the required information. The questionnaire
will be helpful for the board of directors for deciding the location for the restaurant.
Q1 what is your age faction?
a. 15-18
b. 19-25
c. 26-35
d. 50 above
Q2 How often you go to a restaurant?
a. Once in a day
b. Once in a week
c. Twice a week
d. Very often
Q3 what price you like to spend on going for food in a restaurant?
a. £ 15-30
b. £31-70
c. £71-100
d. £101-125
Q4 which location you prefer the most when going to any restaurant?
a. City
b. Street place
c. Beaches
d. Shopping malls
Q5 When would you like to go in a restaurant?
a. Morning
b. Evening
4
Paraphrase This Document
Need a fresh take? Get an instant paraphrase of this document with our AI Paraphraser

c. Night
d. Any time
Q6 what would you like the most effective in any restaurant?
a. Quality
b. Taste
c. Health
d. Price
Q7 Would you like to try new restaurants?
a. Yes
b. No
Q8 what would you like to have anything other than the food in any restaurant?
a. Music
b. Shows
c. Culture festivals
d. Nothing but peace
Q9 Would you like to recommend your friends and relatives for the new restaurant?
a. Yes
b. No
Q 10 What type of food you prefer the most?
a. Vegetarian food
b. Non-vegetarian food
c. Chinese food
d. Spicy food
Q11 How much you want to spend for a single type of food?
a. £ 13-20
b. £21-35
c. £36-45
d. £46-65
Task 2
5
AC2.1
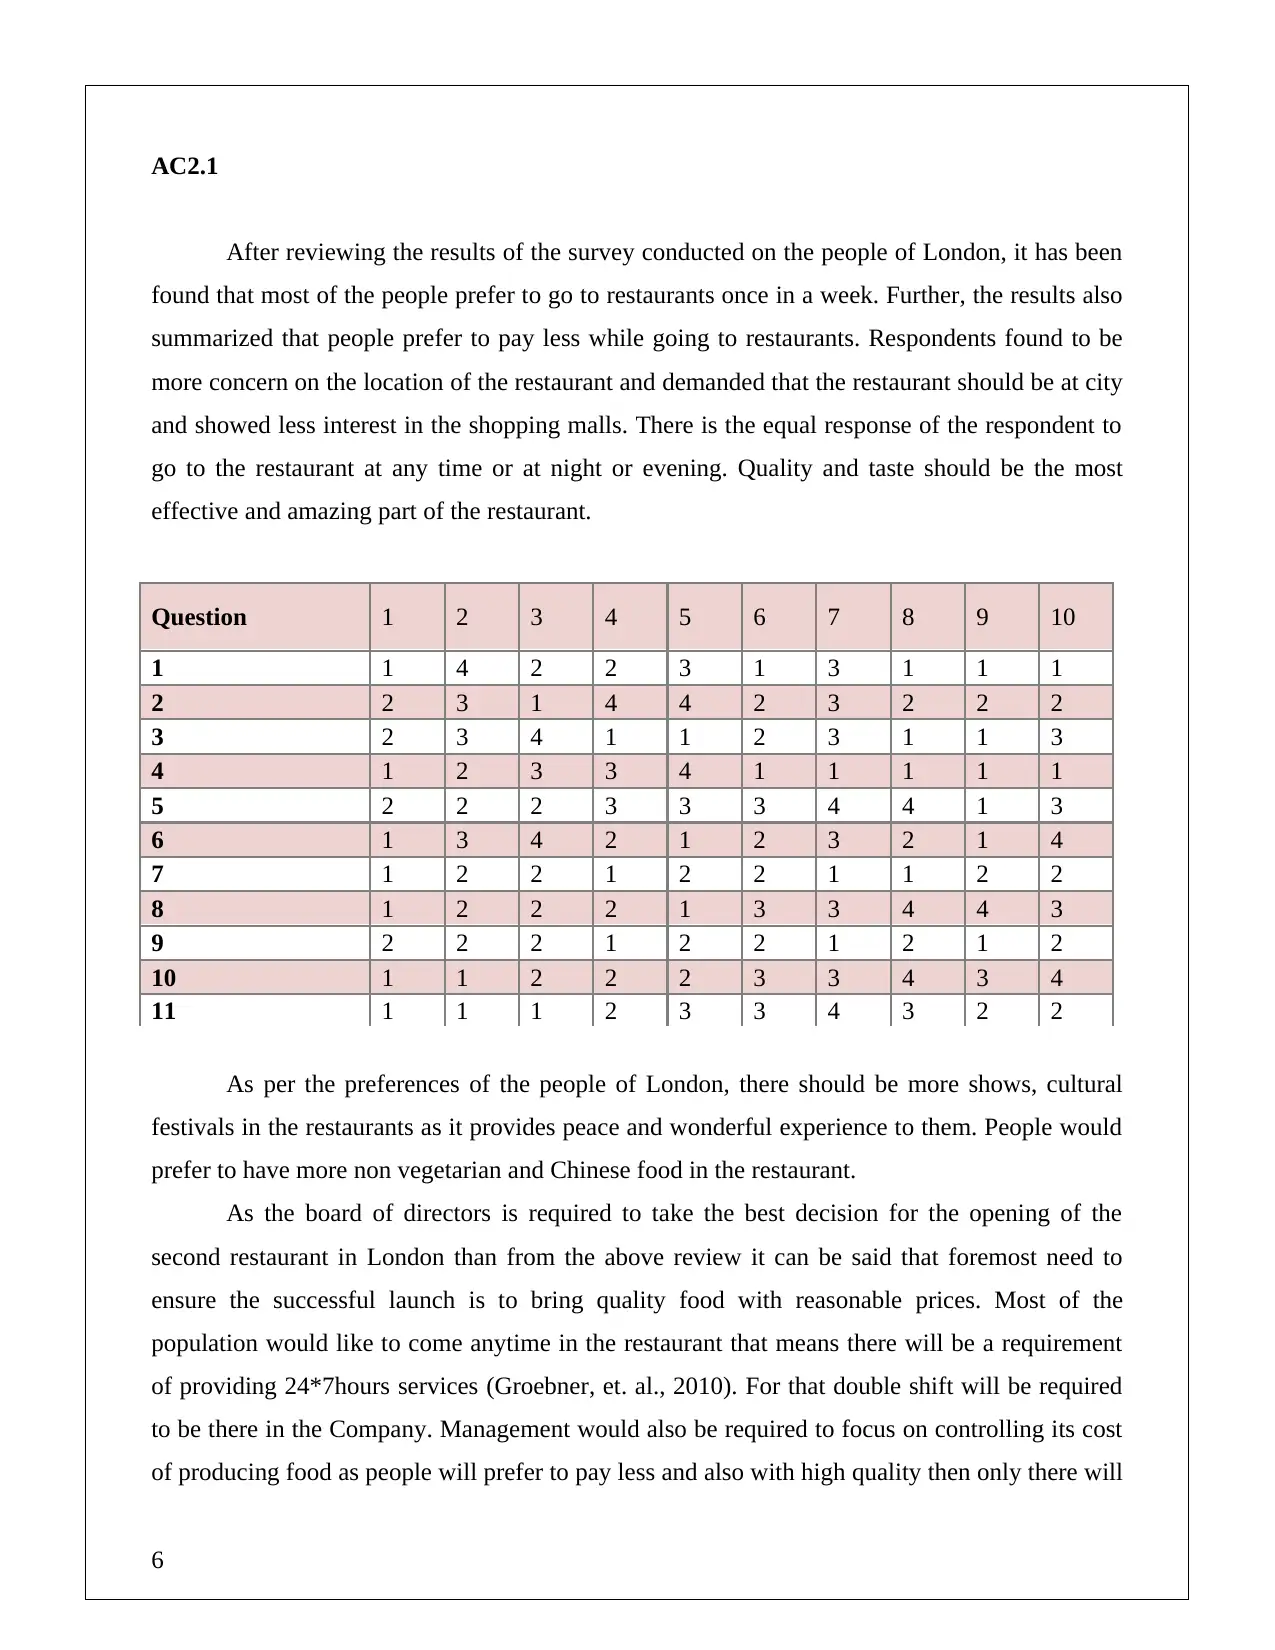
After reviewing the results of the survey conducted on the people of London, it has been
found that most of the people prefer to go to restaurants once in a week. Further, the results also
summarized that people prefer to pay less while going to restaurants. Respondents found to be
more concern on the location of the restaurant and demanded that the restaurant should be at city
and showed less interest in the shopping malls. There is the equal response of the respondent to
go to the restaurant at any time or at night or evening. Quality and taste should be the most
effective and amazing part of the restaurant.
Question 1 2 3 4 5 6 7 8 9 10
1 1 4 2 2 3 1 3 1 1 1
2 2 3 1 4 4 2 3 2 2 2
3 2 3 4 1 1 2 3 1 1 3
4 1 2 3 3 4 1 1 1 1 1
5 2 2 2 3 3 3 4 4 1 3
6 1 3 4 2 1 2 3 2 1 4
7 1 2 2 1 2 2 1 1 2 2
8 1 2 2 2 1 3 3 4 4 3
9 2 2 2 1 2 2 1 2 1 2
10 1 1 2 2 2 3 3 4 3 4
11 1 1 1 2 3 3 4 3 2 2
As per the preferences of the people of London, there should be more shows, cultural
festivals in the restaurants as it provides peace and wonderful experience to them. People would
prefer to have more non vegetarian and Chinese food in the restaurant.
As the board of directors is required to take the best decision for the opening of the
second restaurant in London than from the above review it can be said that foremost need to
ensure the successful launch is to bring quality food with reasonable prices. Most of the
population would like to come anytime in the restaurant that means there will be a requirement
of providing 24*7hours services (Groebner, et. al., 2010). For that double shift will be required
to be there in the Company. Management would also be required to focus on controlling its cost
of producing food as people will prefer to pay less and also with high quality then only there will
6
⊘ This is a preview!⊘
Do you want full access?
Subscribe today to unlock all pages.
Trusted by 1+ million students worldwide
be chances of going ahead of the break-even point. Management would also be required to invest
in organizing some shows and cultural festival as it will attract a large audience to come in the
restaurant.
AC2.2
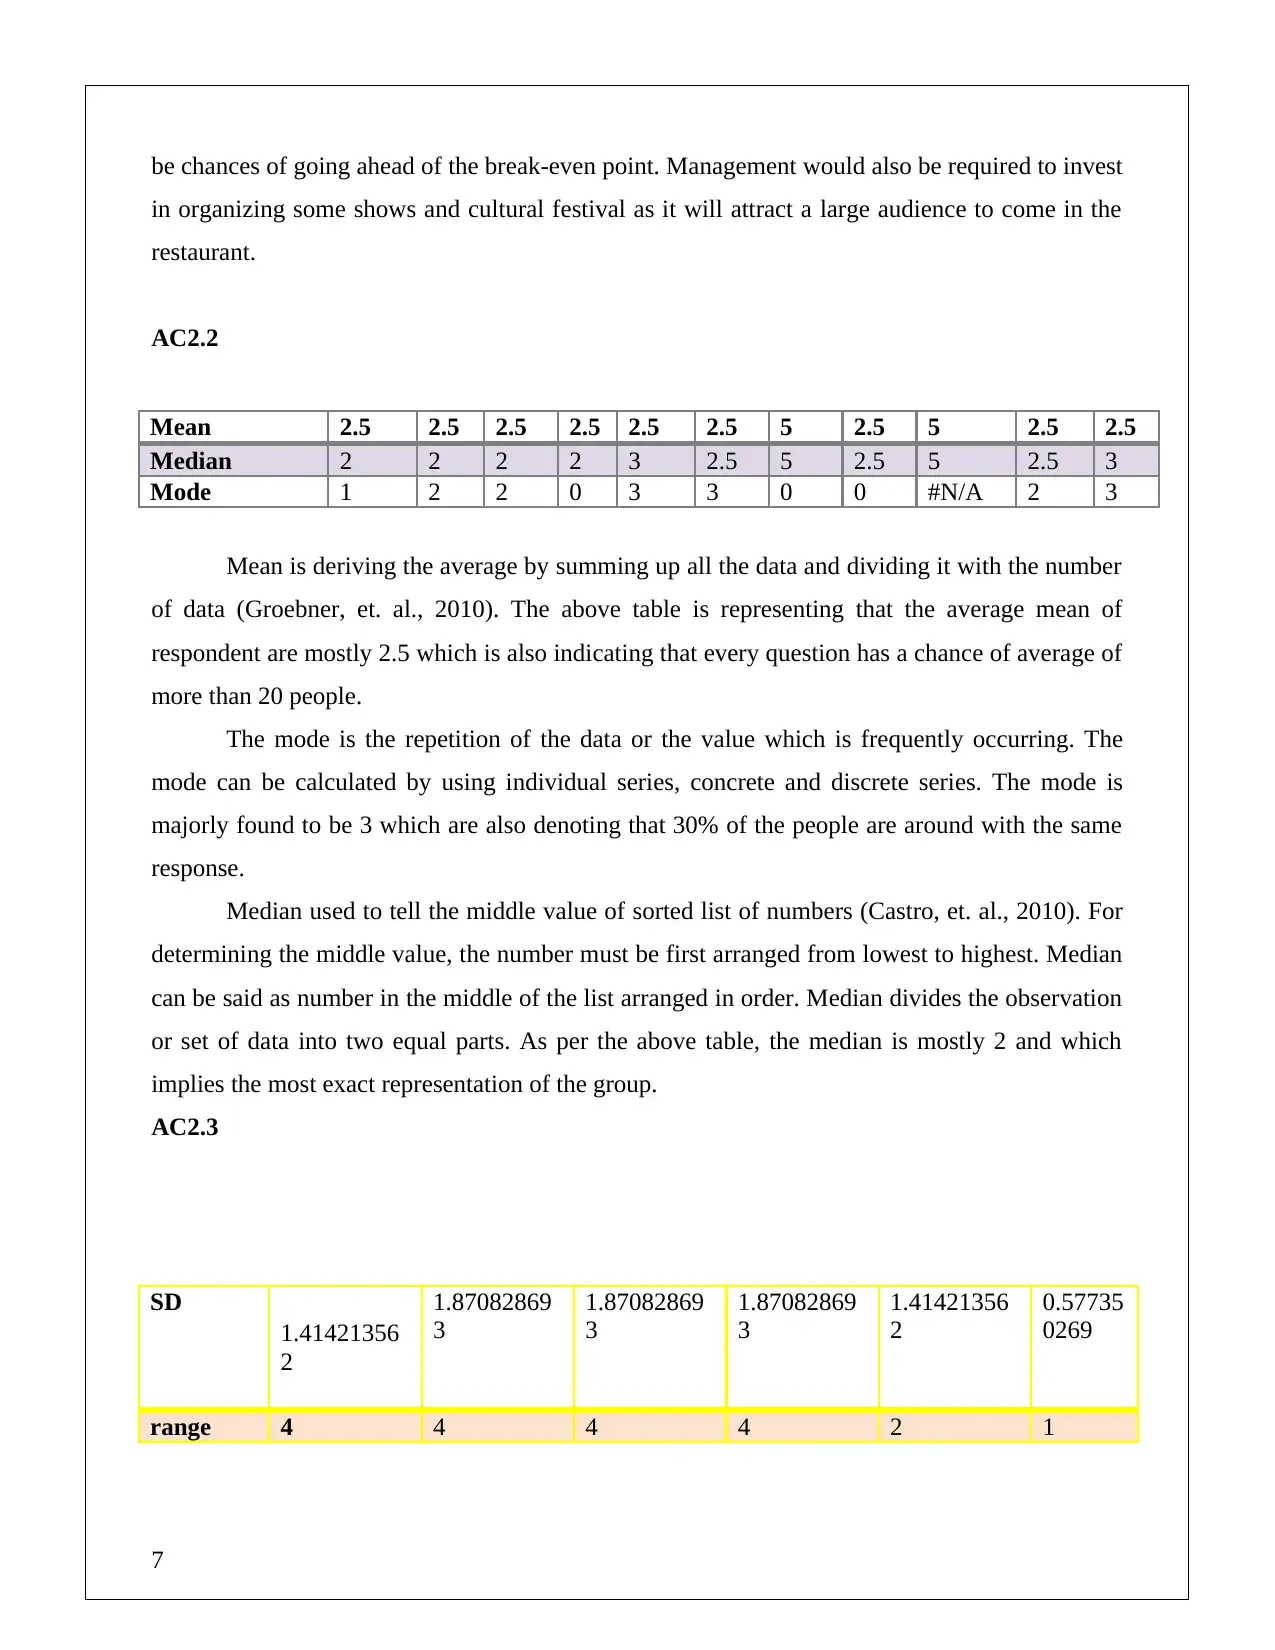
Mean 2.5 2.5 2.5 2.5 2.5 2.5 5 2.5 5 2.5 2.5
Median 2 2 2 2 3 2.5 5 2.5 5 2.5 3
Mode 1 2 2 0 3 3 0 0 #N/A 2 3
Mean is deriving the average by summing up all the data and dividing it with the number
of data (Groebner, et. al., 2010). The above table is representing that the average mean of
respondent are mostly 2.5 which is also indicating that every question has a chance of average of
more than 20 people.
The mode is the repetition of the data or the value which is frequently occurring. The
mode can be calculated by using individual series, concrete and discrete series. The mode is
majorly found to be 3 which are also denoting that 30% of the people are around with the same
response.
Median used to tell the middle value of sorted list of numbers (Castro, et. al., 2010). For
determining the middle value, the number must be first arranged from lowest to highest. Median
can be said as number in the middle of the list arranged in order. Median divides the observation
or set of data into two equal parts. As per the above table, the median is mostly 2 and which
implies the most exact representation of the group.
AC2.3
SD
1.41421356
2
1.87082869
3
1.87082869
3
1.87082869
3
1.41421356
2
0.57735
0269
range 4 4 4 4 2 1
7
in organizing some shows and cultural festival as it will attract a large audience to come in the
restaurant.
AC2.2
Mean 2.5 2.5 2.5 2.5 2.5 2.5 5 2.5 5 2.5 2.5
Median 2 2 2 2 3 2.5 5 2.5 5 2.5 3
Mode 1 2 2 0 3 3 0 0 #N/A 2 3
Mean is deriving the average by summing up all the data and dividing it with the number
of data (Groebner, et. al., 2010). The above table is representing that the average mean of
respondent are mostly 2.5 which is also indicating that every question has a chance of average of
more than 20 people.
The mode is the repetition of the data or the value which is frequently occurring. The
mode can be calculated by using individual series, concrete and discrete series. The mode is
majorly found to be 3 which are also denoting that 30% of the people are around with the same
response.
Median used to tell the middle value of sorted list of numbers (Castro, et. al., 2010). For
determining the middle value, the number must be first arranged from lowest to highest. Median
can be said as number in the middle of the list arranged in order. Median divides the observation
or set of data into two equal parts. As per the above table, the median is mostly 2 and which
implies the most exact representation of the group.
AC2.3
SD
1.41421356
2
1.87082869
3
1.87082869
3
1.87082869
3
1.41421356
2
0.57735
0269
range 4 4 4 4 2 1
7
Paraphrase This Document
Need a fresh take? Get an instant paraphrase of this document with our AI Paraphraser
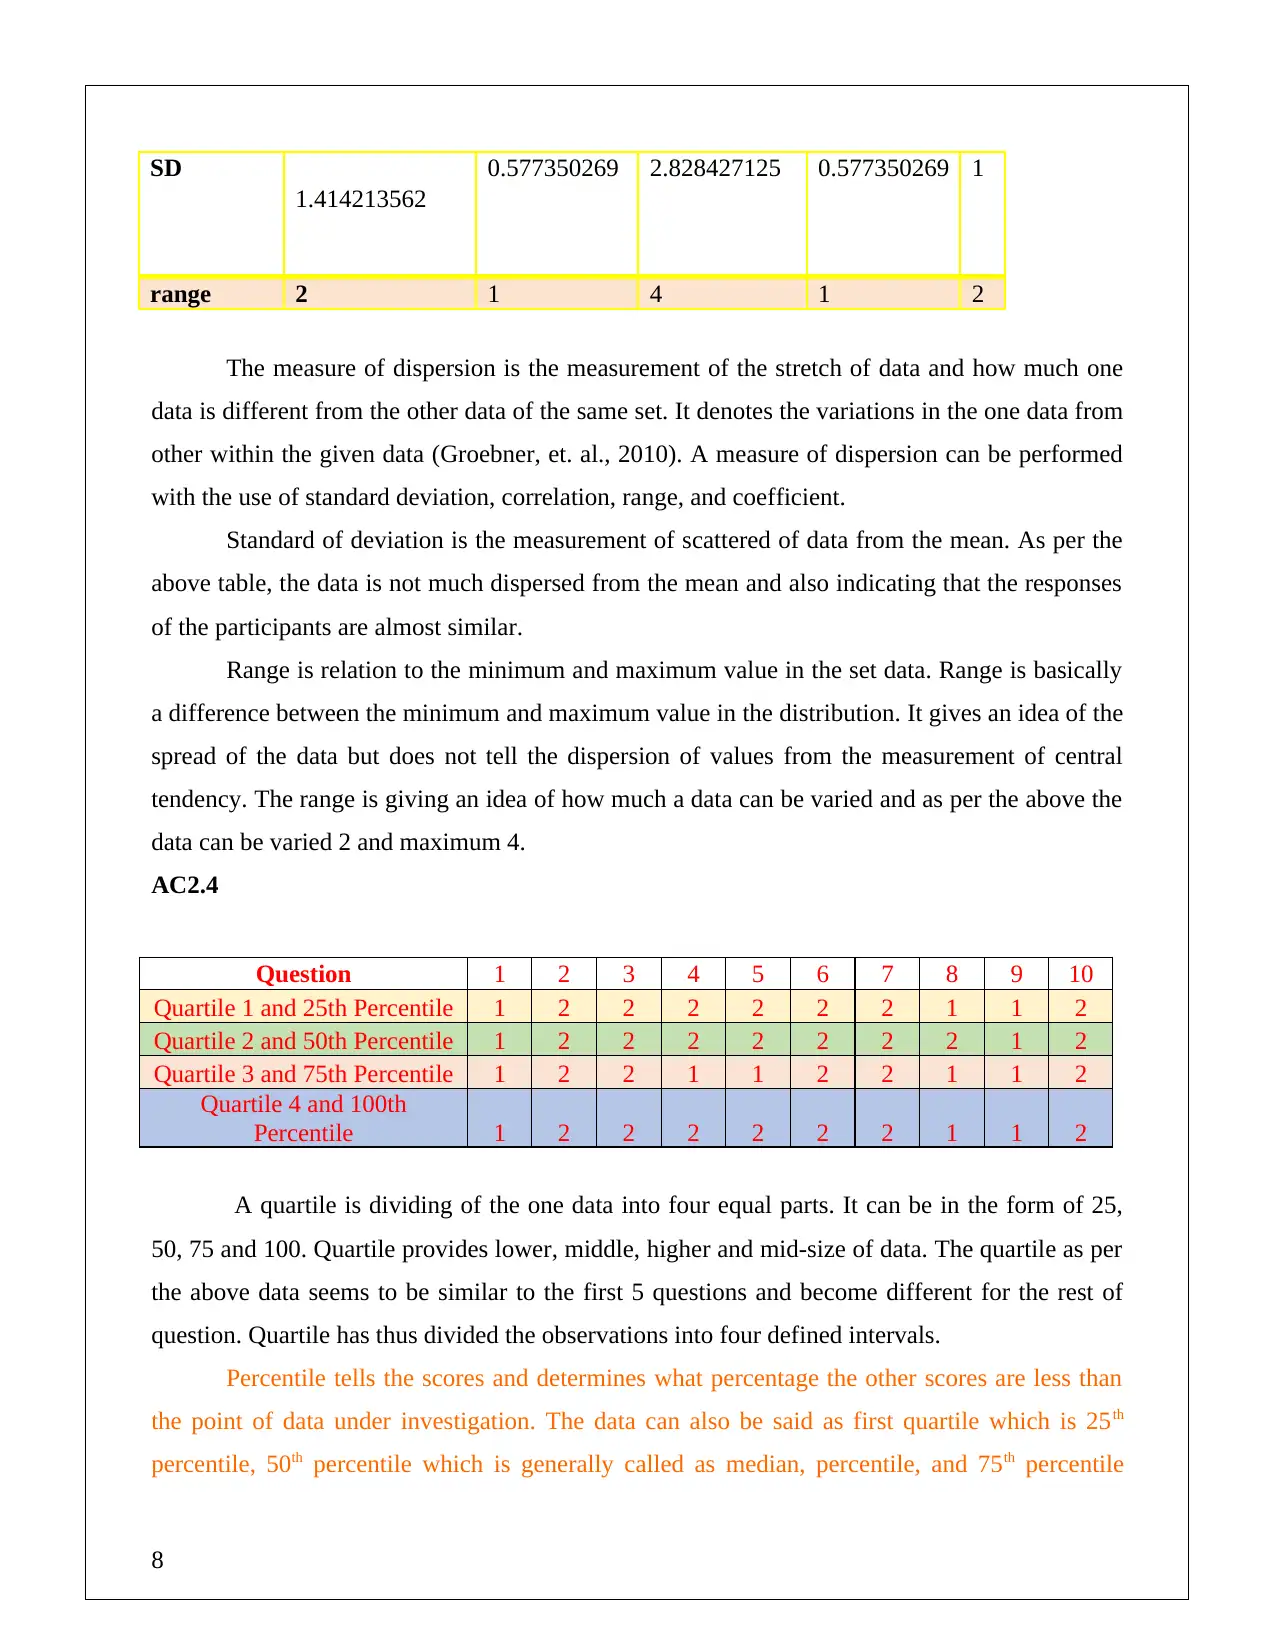
SD
1.414213562
0.577350269 2.828427125 0.577350269 1
range 2 1 4 1 2
The measure of dispersion is the measurement of the stretch of data and how much one
data is different from the other data of the same set. It denotes the variations in the one data from
other within the given data (Groebner, et. al., 2010). A measure of dispersion can be performed
with the use of standard deviation, correlation, range, and coefficient.
Standard of deviation is the measurement of scattered of data from the mean. As per the
above table, the data is not much dispersed from the mean and also indicating that the responses
of the participants are almost similar.
Range is relation to the minimum and maximum value in the set data. Range is basically
a difference between the minimum and maximum value in the distribution. It gives an idea of the
spread of the data but does not tell the dispersion of values from the measurement of central
tendency. The range is giving an idea of how much a data can be varied and as per the above the
data can be varied 2 and maximum 4.
AC2.4
Question 1 2 3 4 5 6 7 8 9 10
Quartile 1 and 25th Percentile 1 2 2 2 2 2 2 1 1 2
Quartile 2 and 50th Percentile 1 2 2 2 2 2 2 2 1 2
Quartile 3 and 75th Percentile 1 2 2 1 1 2 2 1 1 2
Quartile 4 and 100th
Percentile 1 2 2 2 2 2 2 1 1 2
A quartile is dividing of the one data into four equal parts. It can be in the form of 25,
50, 75 and 100. Quartile provides lower, middle, higher and mid-size of data. The quartile as per
the above data seems to be similar to the first 5 questions and become different for the rest of
question. Quartile has thus divided the observations into four defined intervals.
Percentile tells the scores and determines what percentage the other scores are less than
the point of data under investigation. The data can also be said as first quartile which is 25th
percentile, 50th percentile which is generally called as median, percentile, and 75th percentile
8
which is also called third quartile. The difference between the third and first quartile is called as
interquartile range. In the above table at the 25th percentile there is end of one quartile and it can
also be said that the data below this level is scoring 25th and is 25th percentile of the
representative. The 2nd quartile which can also be said as 50th percentile is scoring 50th and
presenting 50th percentile of representative. Furthermore at quartile 3rd there is 75th percentile
which implying the 75th percentage of representative.
Coefficient and correlation are determining the relation of the one data with variable. A
negative correlation means there is the big difference between variables and positive correlation
implies that the variables do not have much big difference. If the correlation stood as 1 then it
means that there is very strong positive relationship and -1 will present strong negative
relationship. Negative correlation will imply that when one variable increases or decreases the
other also decreases and increases. Positive correlation will lead to positive relation between
variables i.e. if one variable increases the other will also increase.
Task 3
AC3.1
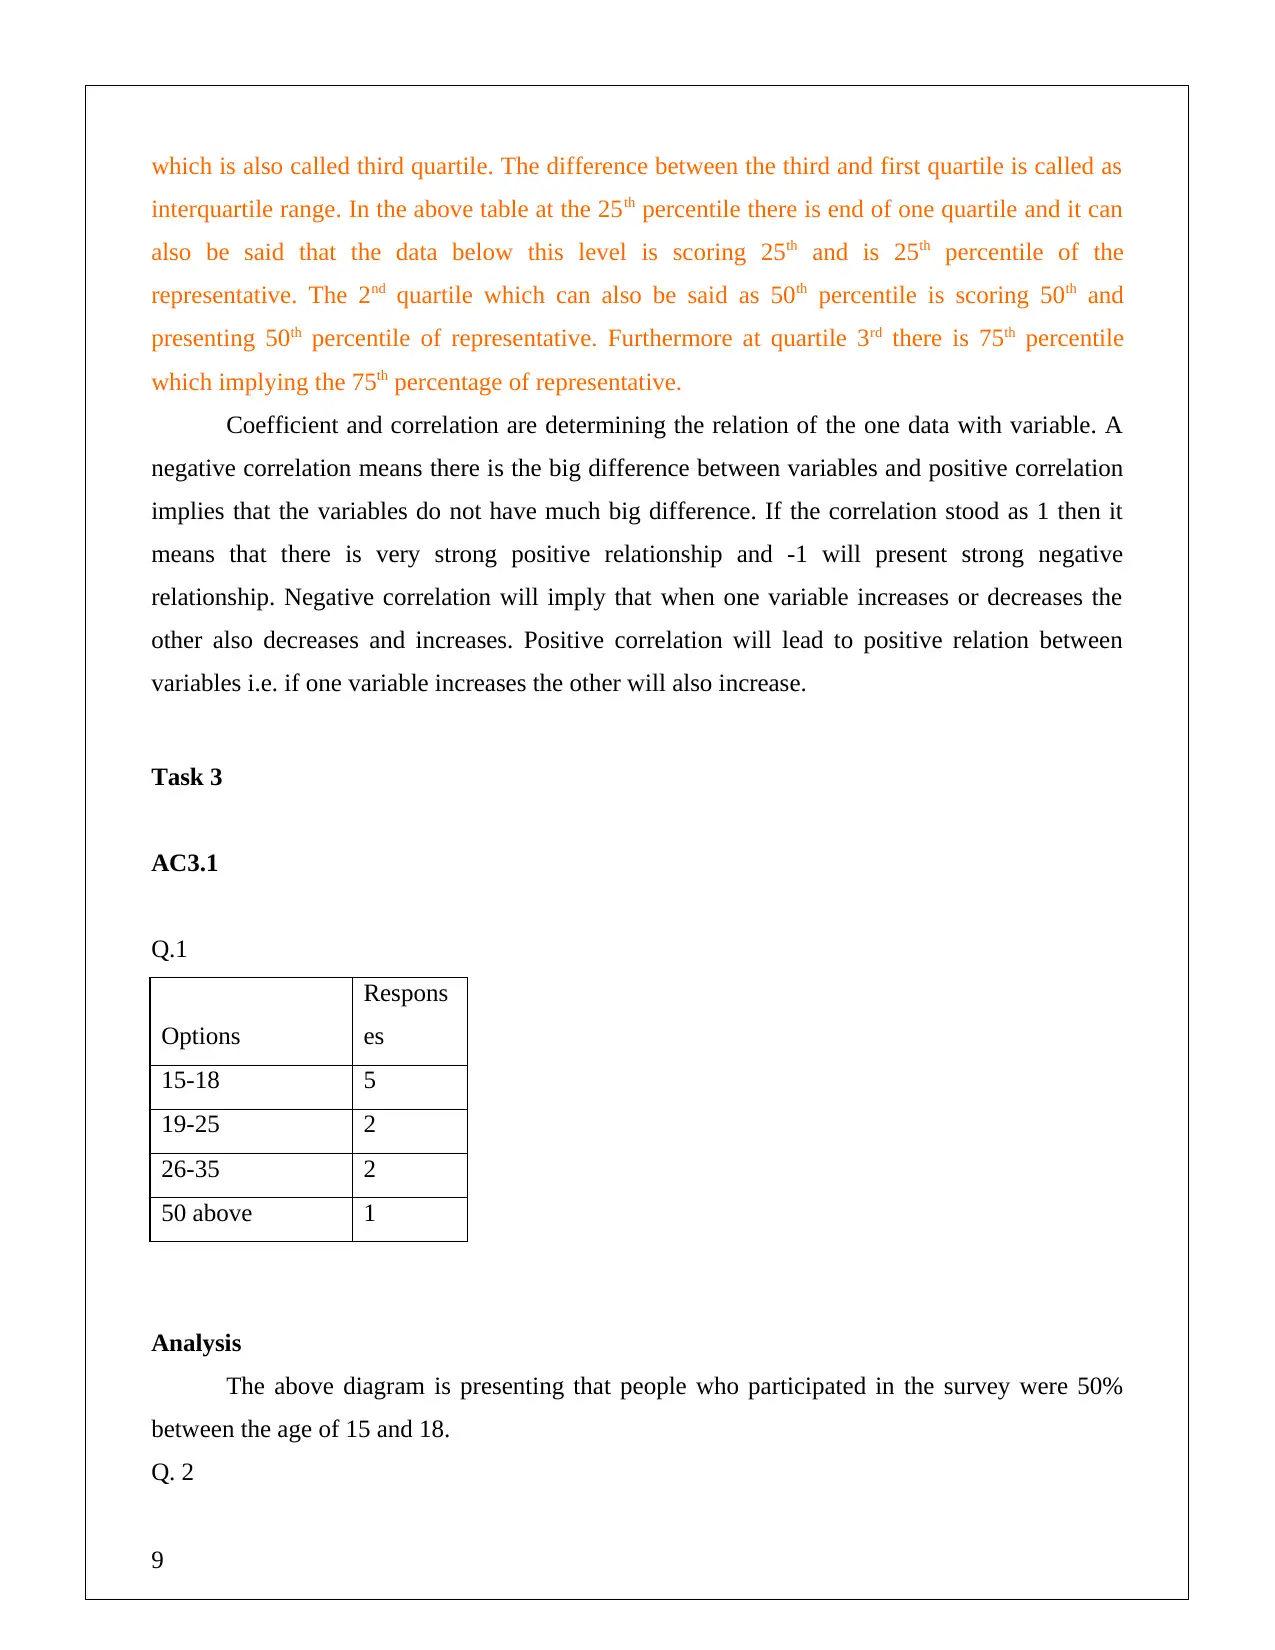
Q.1
Options
Respons
es
15-18 5
19-25 2
26-35 2
50 above 1
Analysis
The above diagram is presenting that people who participated in the survey were 50%
between the age of 15 and 18.
Q. 2
9
interquartile range. In the above table at the 25th percentile there is end of one quartile and it can
also be said that the data below this level is scoring 25th and is 25th percentile of the
representative. The 2nd quartile which can also be said as 50th percentile is scoring 50th and
presenting 50th percentile of representative. Furthermore at quartile 3rd there is 75th percentile
which implying the 75th percentage of representative.
Coefficient and correlation are determining the relation of the one data with variable. A
negative correlation means there is the big difference between variables and positive correlation
implies that the variables do not have much big difference. If the correlation stood as 1 then it
means that there is very strong positive relationship and -1 will present strong negative
relationship. Negative correlation will imply that when one variable increases or decreases the
other also decreases and increases. Positive correlation will lead to positive relation between
variables i.e. if one variable increases the other will also increase.
Task 3
AC3.1
Q.1
Options
Respons
es
15-18 5
19-25 2
26-35 2
50 above 1
Analysis
The above diagram is presenting that people who participated in the survey were 50%
between the age of 15 and 18.
Q. 2
9
⊘ This is a preview!⊘
Do you want full access?
Subscribe today to unlock all pages.
Trusted by 1+ million students worldwide
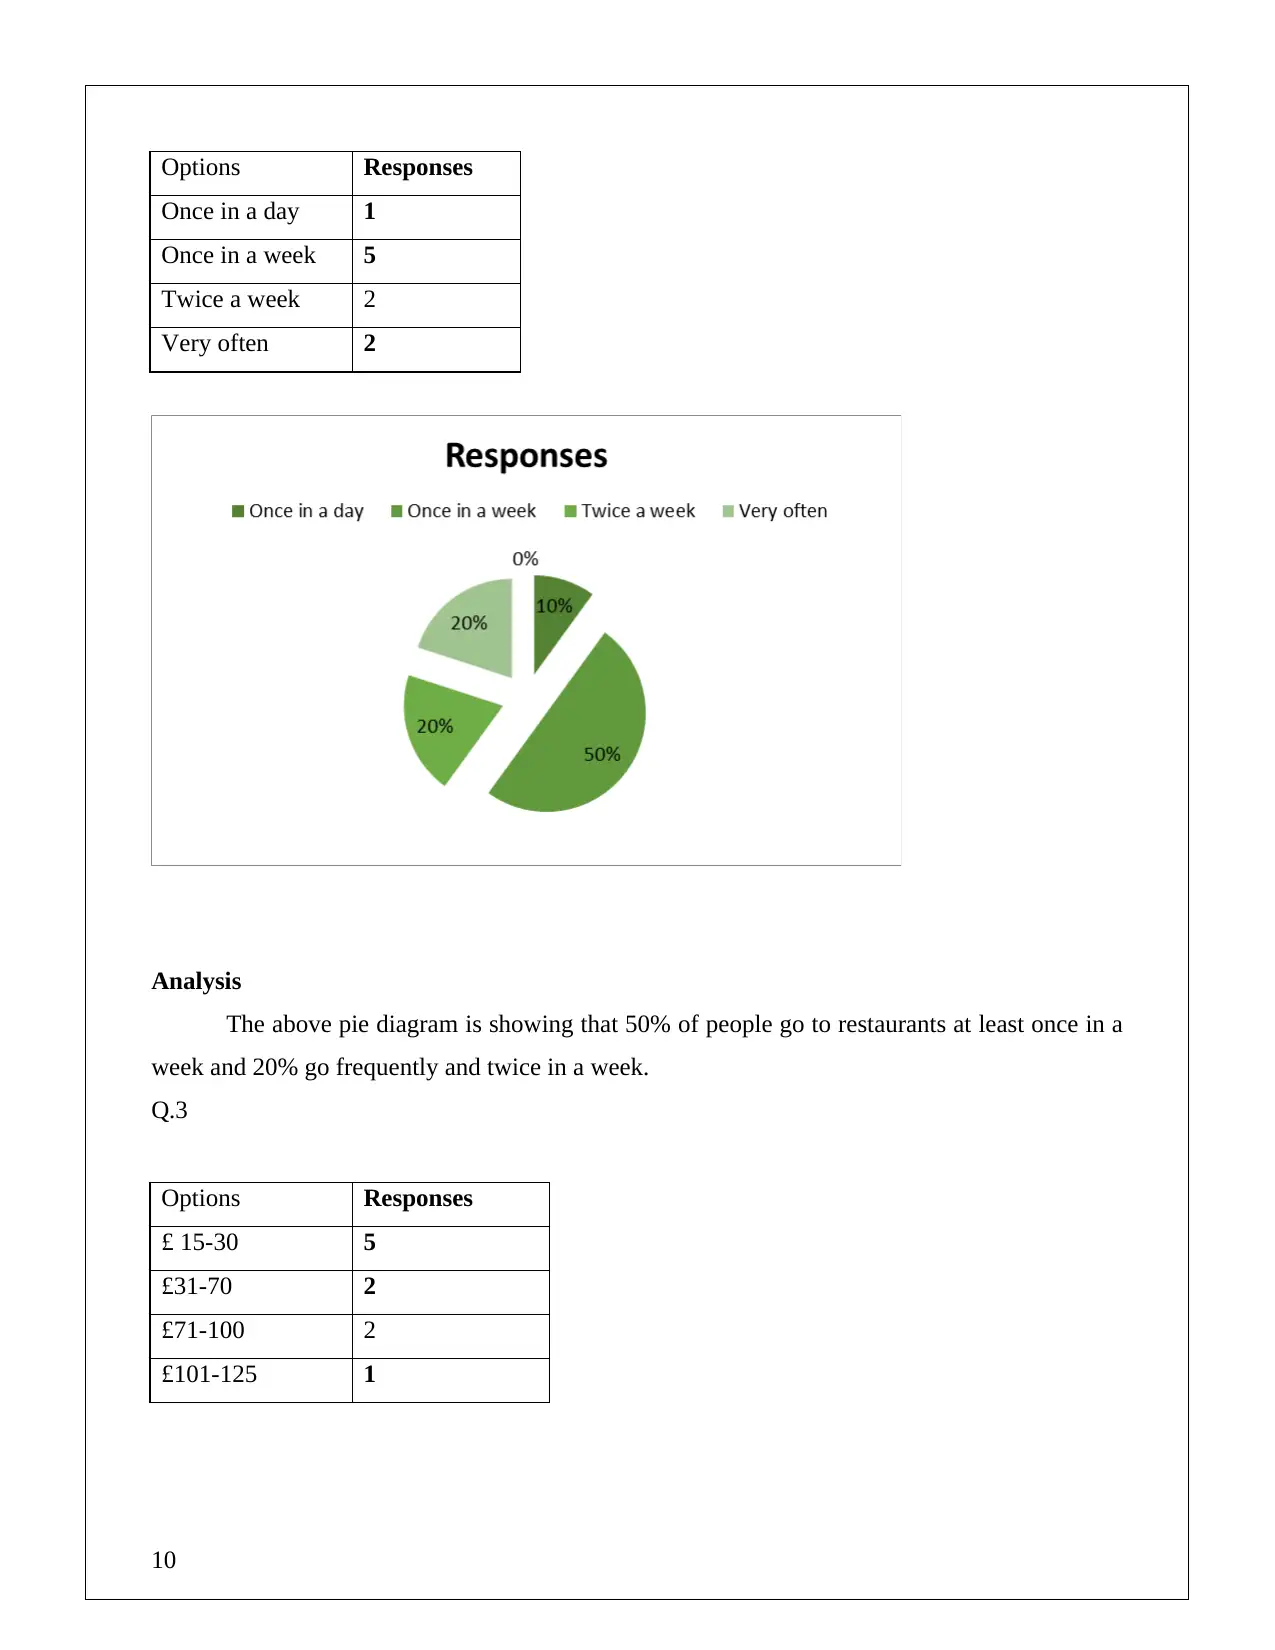
Options Responses
Once in a day 1
Once in a week 5
Twice a week 2
Very often 2
Analysis
The above pie diagram is showing that 50% of people go to restaurants at least once in a
week and 20% go frequently and twice in a week.
Q.3
Options Responses
£ 15-30 5
£31-70 2
£71-100 2
£101-125 1
10
Once in a day 1
Once in a week 5
Twice a week 2
Very often 2
Analysis
The above pie diagram is showing that 50% of people go to restaurants at least once in a
week and 20% go frequently and twice in a week.
Q.3
Options Responses
£ 15-30 5
£31-70 2
£71-100 2
£101-125 1
10
Paraphrase This Document
Need a fresh take? Get an instant paraphrase of this document with our AI Paraphraser
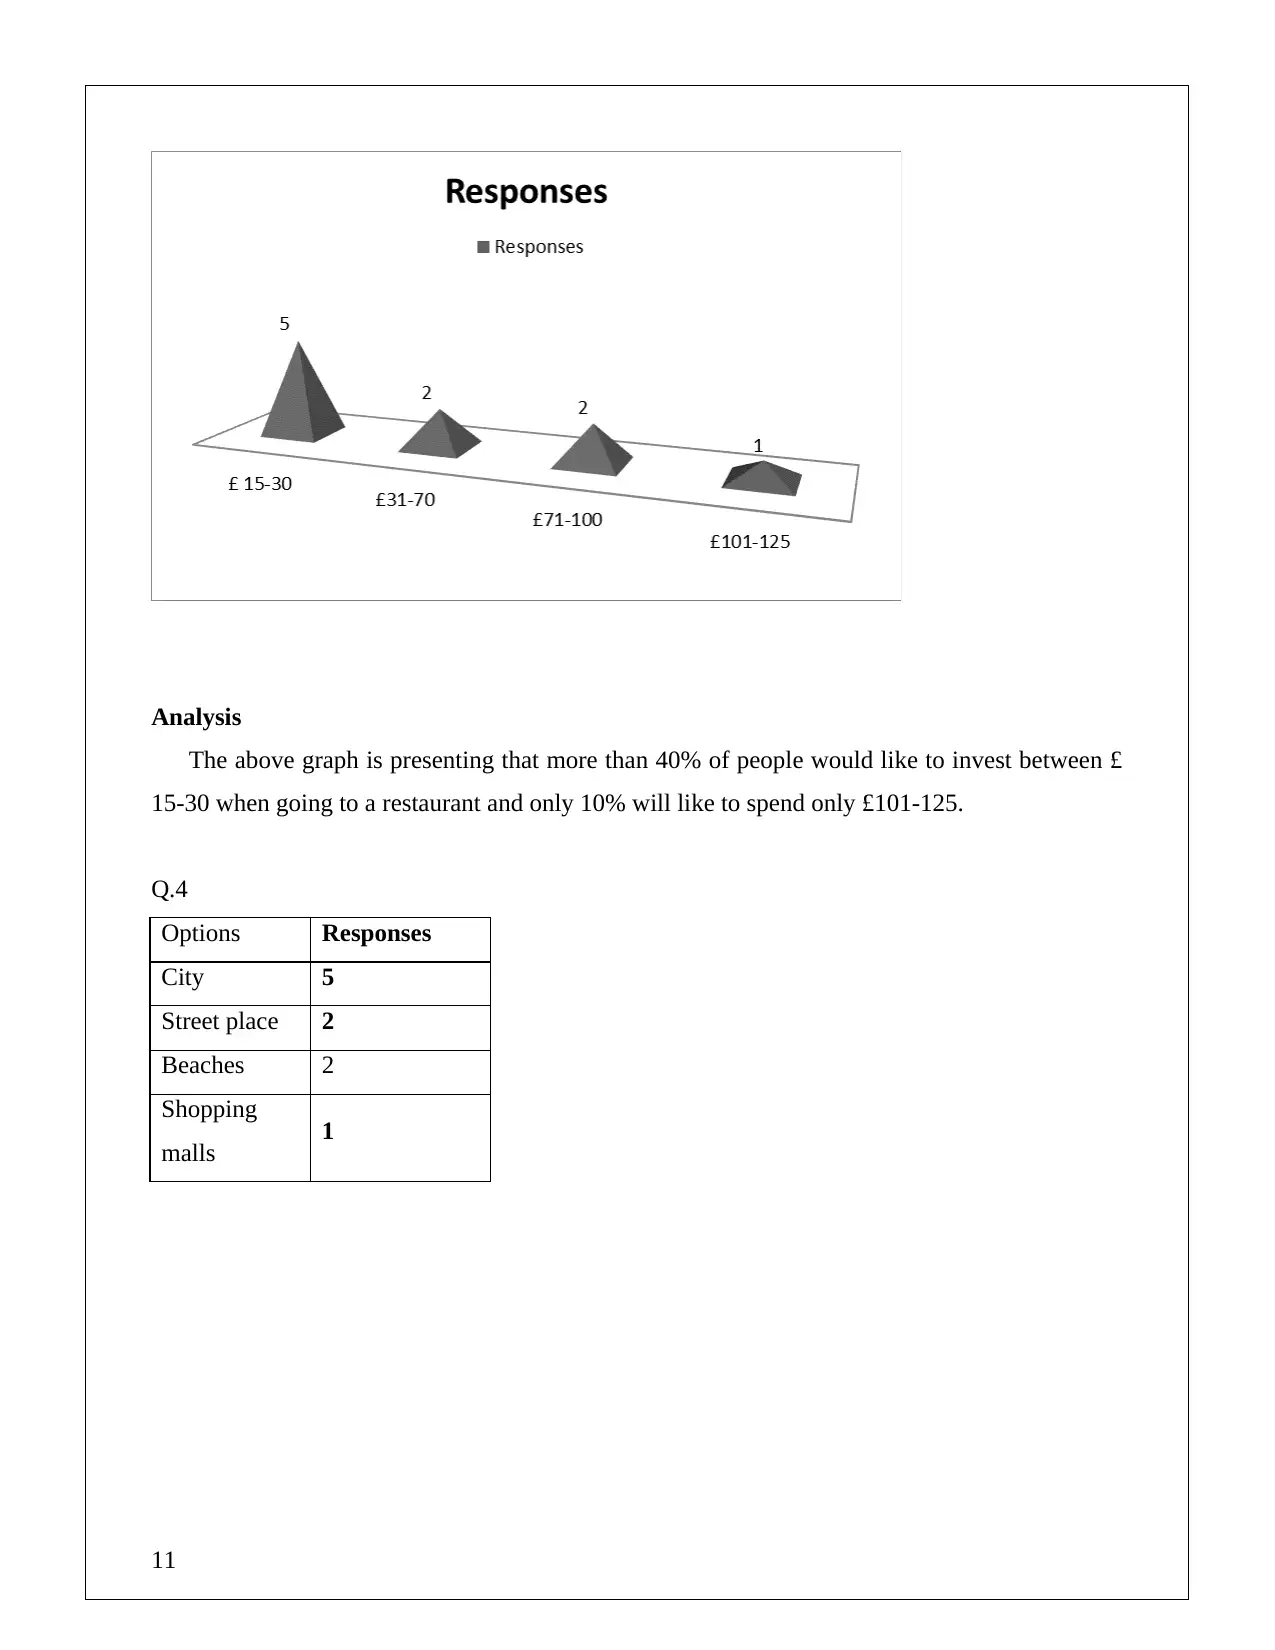
Analysis
The above graph is presenting that more than 40% of people would like to invest between £
15-30 when going to a restaurant and only 10% will like to spend only £101-125.
Q.4
Options Responses
City 5
Street place 2
Beaches 2
Shopping
malls 1
11
The above graph is presenting that more than 40% of people would like to invest between £
15-30 when going to a restaurant and only 10% will like to spend only £101-125.
Q.4
Options Responses
City 5
Street place 2
Beaches 2
Shopping
malls 1
11
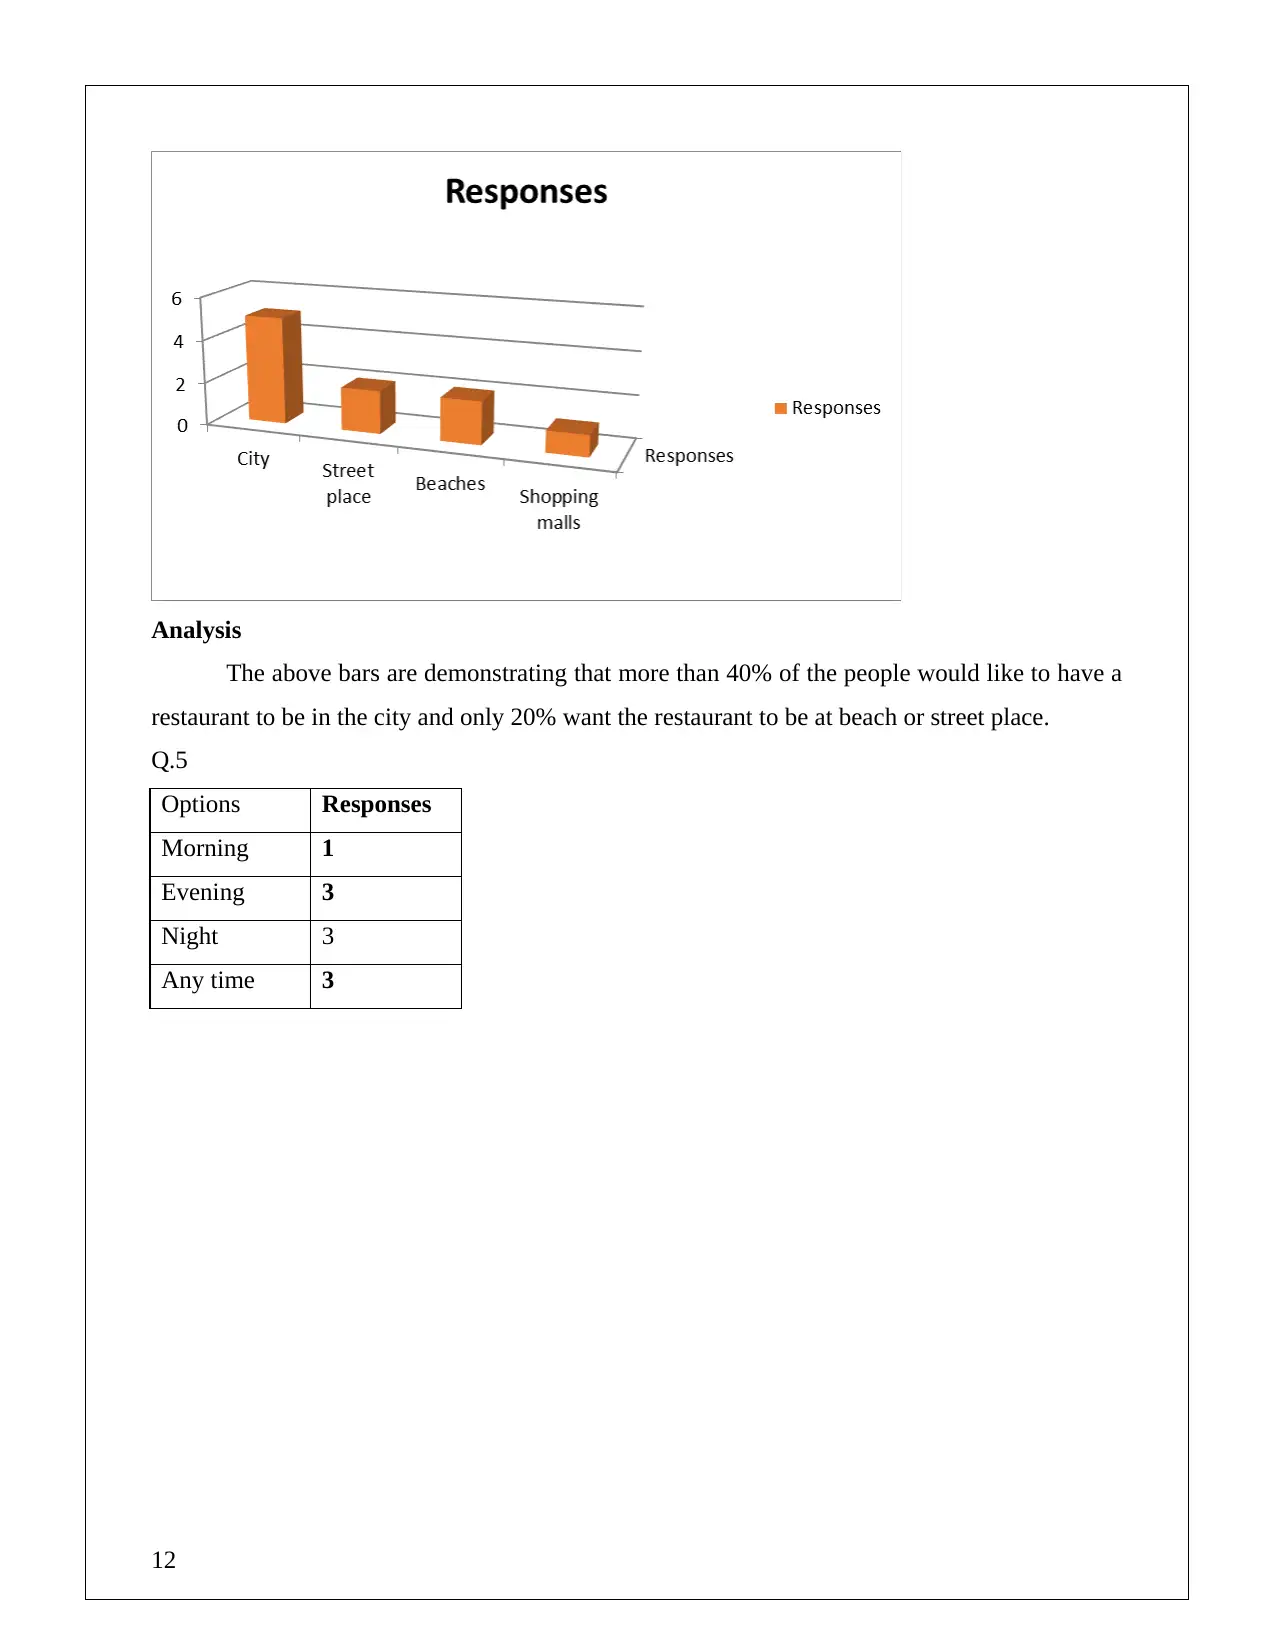
Analysis
The above bars are demonstrating that more than 40% of the people would like to have a
restaurant to be in the city and only 20% want the restaurant to be at beach or street place.
Q.5
Options Responses
Morning 1
Evening 3
Night 3
Any time 3
12
The above bars are demonstrating that more than 40% of the people would like to have a
restaurant to be in the city and only 20% want the restaurant to be at beach or street place.
Q.5
Options Responses
Morning 1
Evening 3
Night 3
Any time 3
12
⊘ This is a preview!⊘
Do you want full access?
Subscribe today to unlock all pages.
Trusted by 1+ million students worldwide
1 out of 27
Related Documents


Your All-in-One AI-Powered Toolkit for Academic Success.
+13062052269
info@desklib.com
Available 24*7 on WhatsApp / Email
![[object Object]](/_next/static/media/star-bottom.7253800d.svg)
Unlock your academic potential
Copyright © 2020–2026 A2Z Services. All Rights Reserved. Developed and managed by ZUCOL.