Business Decision Making: Data Collection and Analysis Report
VerifiedAdded on 2019/12/28
|18
|4324
|203
Report
AI Summary
This report delves into the critical aspects of business decision-making, providing a comprehensive overview of data collection, survey methodologies, and data analysis techniques. It begins by exploring primary and secondary data collection methods, including questionnaires and the use of travel magazines. The report then examines various survey methodologies, such as personal interviews and telephonic surveys, alongside different sampling methods like random, convenience, judgment, and snowball sampling. A sample questionnaire is presented to illustrate data gathering. The subsequent sections focus on data analysis, including measures of central tendency (mean, median, and mode) and dispersion (standard deviation, range, quartiles). The report also explains quartiles, percentiles, and the correlation coefficient, highlighting their significance in understanding revenue patterns and relationships between variables. The analysis includes a sample dataset and the application of these statistical tools to real-world business scenarios, aimed at aiding decision-making and business expansion strategies for a tour operator.
BUSINESS DECISION MAKING
Paraphrase This Document
Need a fresh take? Get an instant paraphrase of this document with our AI Paraphraser
INTRODUCTION
Business decision making help to the organization to take identical decision for achieving the
success in long run. This report provide facts and figures by applying various methods and
techniques and also various charts, graphs etc. so that they achieve the profits in long run. This
report help them to expand their business and develop their product.
TASK 1
1.1 Creating data collection planning
Data collection is an essential tool for the business development of every organizations.
In present scenario, entities applied two methods for collecting the data such as, primary data
collection and secondary data collection. Primary data collection refers those data which are to
be collected first time through various surveys, questionnaires, focus groups etc. these data
collection are not more appropriate but major helpful for taking decisions in the organization. In
UK, tour operators uses this form for collecting the data by majorly using the questionnaires.
They collect these data from public or from the area where they want to operate their business.
Questionnaire is all bout the taste, preferences, attitude and buying behavior of the customers.
Moreover, through this organization place their decision whether about expanding the business
or selecting the projects.
The second source for collecting the data is secondary data collection. This data is to be
collected from the articles, newspapers, travel magazines, other organization data etc. The
secondary data collection is more appropriate as per the primary data collection. It is most
helpful for running the organization or taking decisions for their expansion. Here, UK's tour
operator uses this method for data collection mostly through the other organizational data and
travel magazines. By these sources they collect the data of the peoples preferences and wants or
needs of the services of the customers by tour operator. By applying these data travel agent
satisfy the needs of the customers and increases their profits in long run.
1.2 Surveys methodologies along with the sampling frame and strategies
Various surveys methodologies and sampling methods are to be used for making the
strategies in the organizations. Surveys methodologies refers that the methods which are to be
used at the time of surveys for getting more appropriate and efficient data to enhance the
business. These are as mail survey, telephone surveys, personal interviews survey and the
surveys through which identify the taste and preferences of the peoples. Tour operator of UK
mainly uses the personal interview surveys and the telephonic surveys through which it can
identify the requirement of the people in the traveling. By this it can satisfy the needs of the
customers and enhance their business. This helps to the tour operator to enhance their profits and
also the goodwill so that their business can run in long run with profitably.
There are various sampling methods which help to the tour operator for getting the data
so that it can enhance their business and make it more profitable such as, random sampling,
convenience sampling, judgment sampling and snowball sampling. Random sampling helps to
get data by probability, which means to collect the data as each people has an equal chances for
being selected. This is more helpful sampling for the tour operator because of this it can identify
the requirement of the people about the prices, hotels and foods etc. Next sampling techniques is
convenience sampling, it denotes that the sampling in fewer expenditures. Tour operator does not
want to spend more amount of money in research work. This type of sampling provides them
appropriate sampling in less amount of money. Moreover, judgment sampling is a simple non
probabilistic sampling and as per these sampling the researcher would select their data more
conveniently. These sampling is the higher version of convenience sampling. Last sampling
technique which is use by the tour operator of UK is snowball sampling. This method of
sampling for collecting the data is difficult but these techniques provides more effective and
efficient data to the tour operators to run their entities more comfortable profitable.
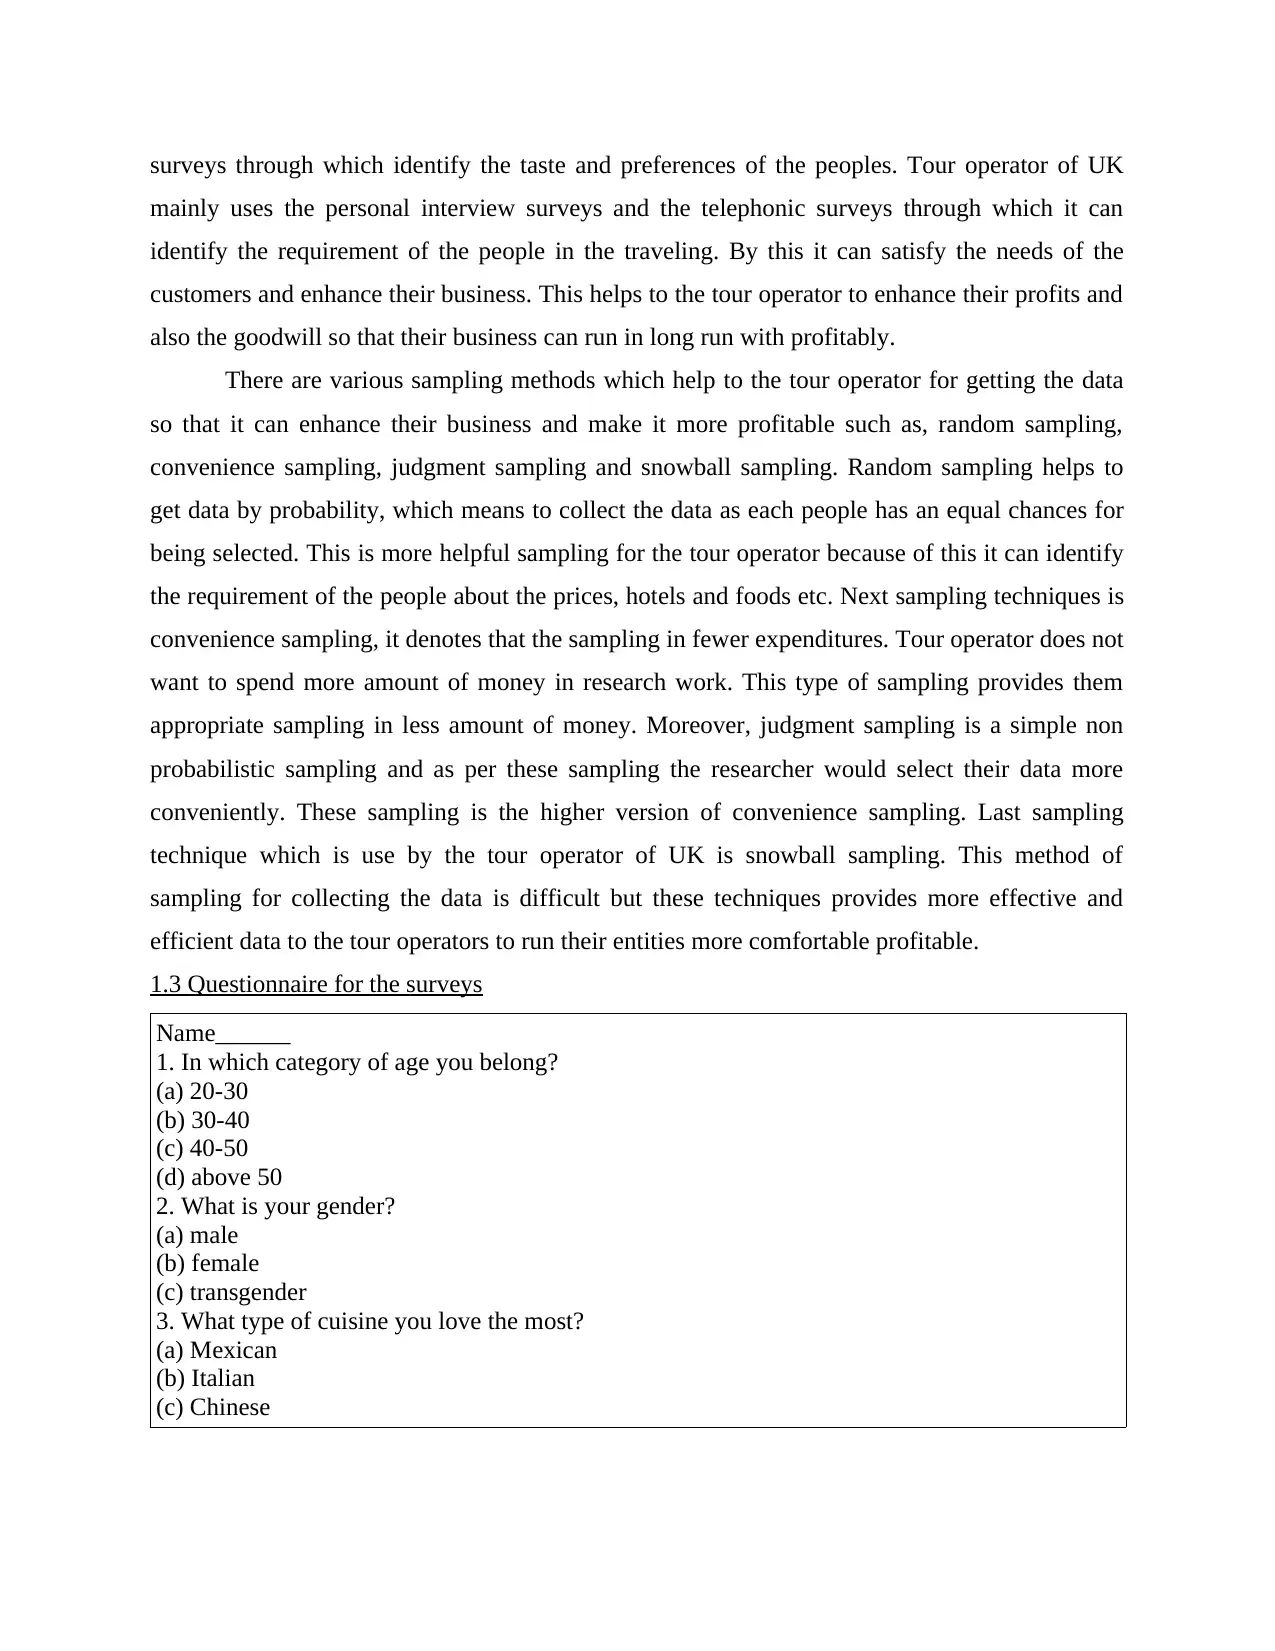
1.3 Questionnaire for the surveys
Name______
1. In which category of age you belong?
(a) 20-30
(b) 30-40
(c) 40-50
(d) above 50
2. What is your gender?
(a) male
(b) female
(c) transgender
3. What type of cuisine you love the most?
(a) Mexican
(b) Italian
(c) Chinese
mainly uses the personal interview surveys and the telephonic surveys through which it can
identify the requirement of the people in the traveling. By this it can satisfy the needs of the
customers and enhance their business. This helps to the tour operator to enhance their profits and
also the goodwill so that their business can run in long run with profitably.
There are various sampling methods which help to the tour operator for getting the data
so that it can enhance their business and make it more profitable such as, random sampling,
convenience sampling, judgment sampling and snowball sampling. Random sampling helps to
get data by probability, which means to collect the data as each people has an equal chances for
being selected. This is more helpful sampling for the tour operator because of this it can identify
the requirement of the people about the prices, hotels and foods etc. Next sampling techniques is
convenience sampling, it denotes that the sampling in fewer expenditures. Tour operator does not
want to spend more amount of money in research work. This type of sampling provides them
appropriate sampling in less amount of money. Moreover, judgment sampling is a simple non
probabilistic sampling and as per these sampling the researcher would select their data more
conveniently. These sampling is the higher version of convenience sampling. Last sampling
technique which is use by the tour operator of UK is snowball sampling. This method of
sampling for collecting the data is difficult but these techniques provides more effective and
efficient data to the tour operators to run their entities more comfortable profitable.
1.3 Questionnaire for the surveys
Name______
1. In which category of age you belong?
(a) 20-30
(b) 30-40
(c) 40-50
(d) above 50
2. What is your gender?
(a) male
(b) female
(c) transgender
3. What type of cuisine you love the most?
(a) Mexican
(b) Italian
(c) Chinese
⊘ This is a preview!⊘
Do you want full access?
Subscribe today to unlock all pages.
Trusted by 1+ million students worldwide
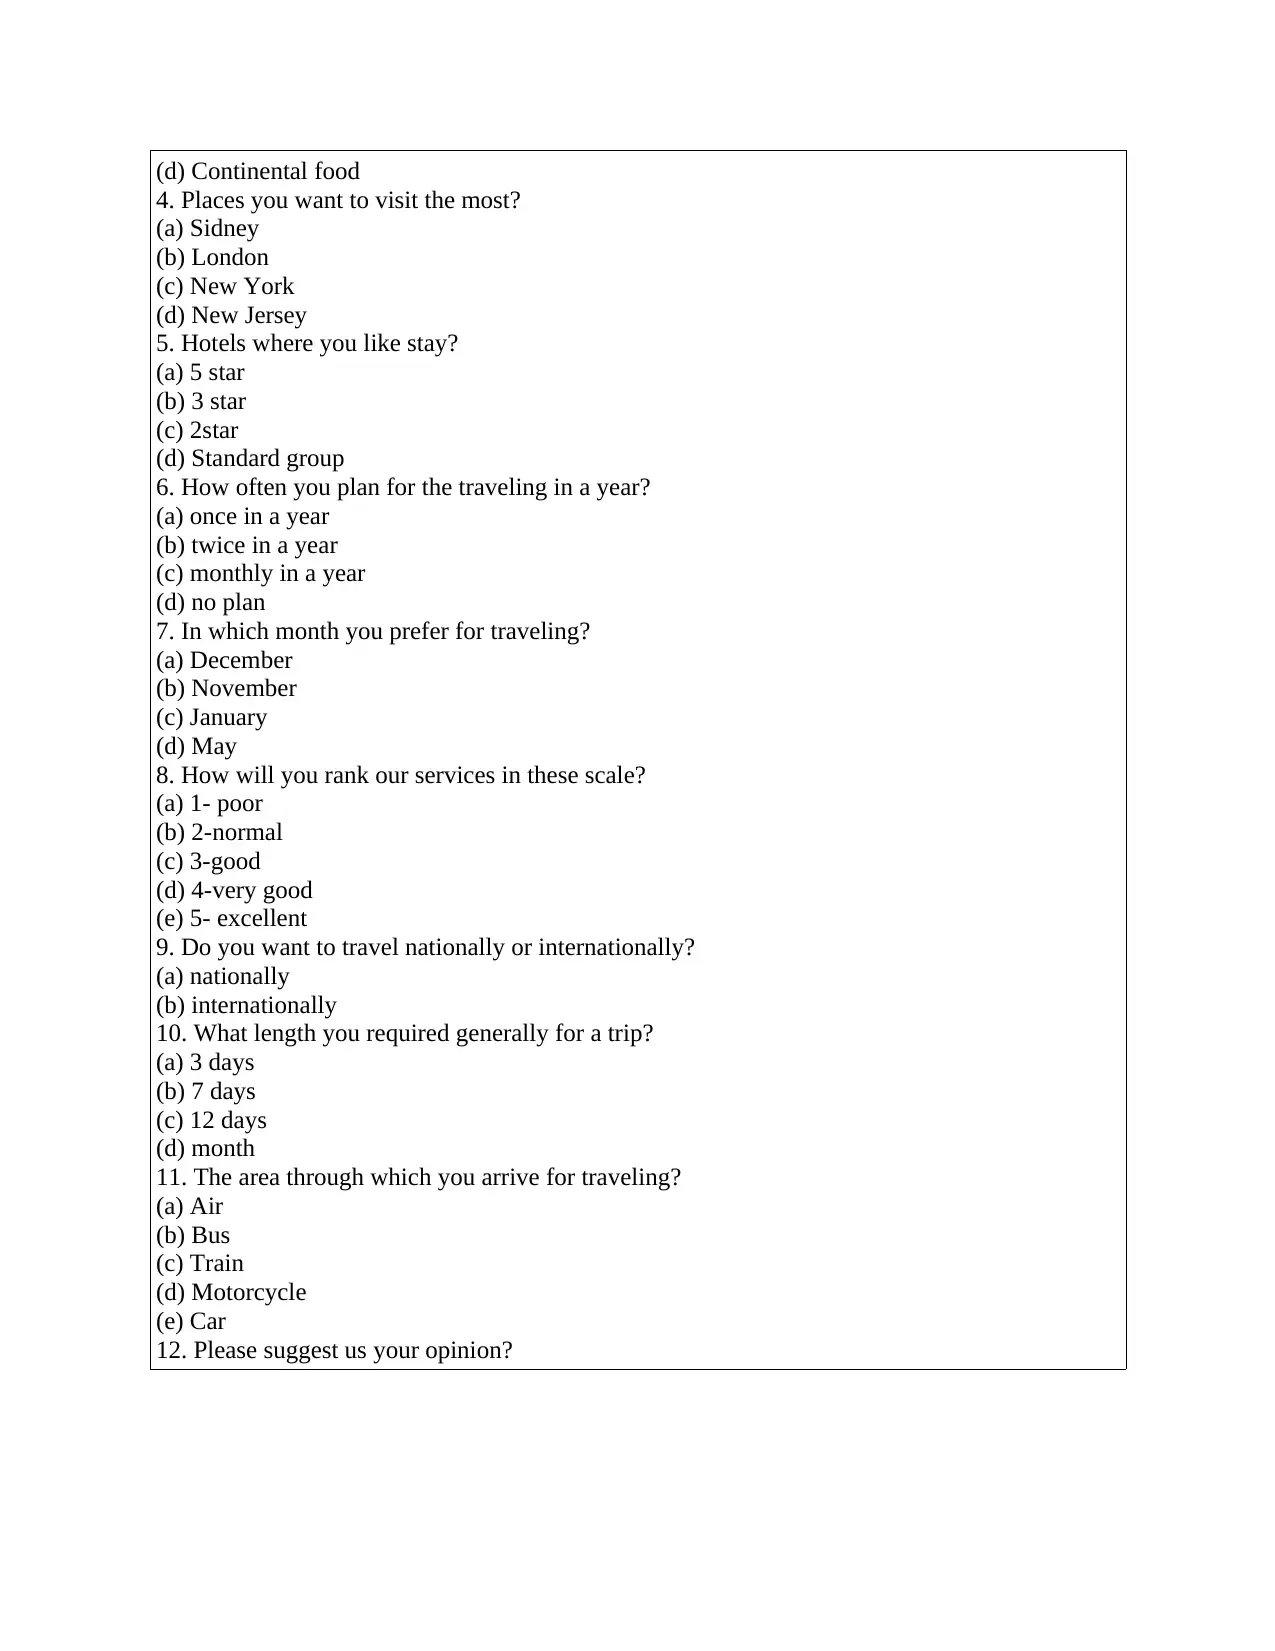
(d) Continental food
4. Places you want to visit the most?
(a) Sidney
(b) London
(c) New York
(d) New Jersey
5. Hotels where you like stay?
(a) 5 star
(b) 3 star
(c) 2star
(d) Standard group
6. How often you plan for the traveling in a year?
(a) once in a year
(b) twice in a year
(c) monthly in a year
(d) no plan
7. In which month you prefer for traveling?
(a) December
(b) November
(c) January
(d) May
8. How will you rank our services in these scale?
(a) 1- poor
(b) 2-normal
(c) 3-good
(d) 4-very good
(e) 5- excellent
9. Do you want to travel nationally or internationally?
(a) nationally
(b) internationally
10. What length you required generally for a trip?
(a) 3 days
(b) 7 days
(c) 12 days
(d) month
11. The area through which you arrive for traveling?
(a) Air
(b) Bus
(c) Train
(d) Motorcycle
(e) Car
12. Please suggest us your opinion?
Paraphrase This Document
Need a fresh take? Get an instant paraphrase of this document with our AI Paraphraser
TASK 2
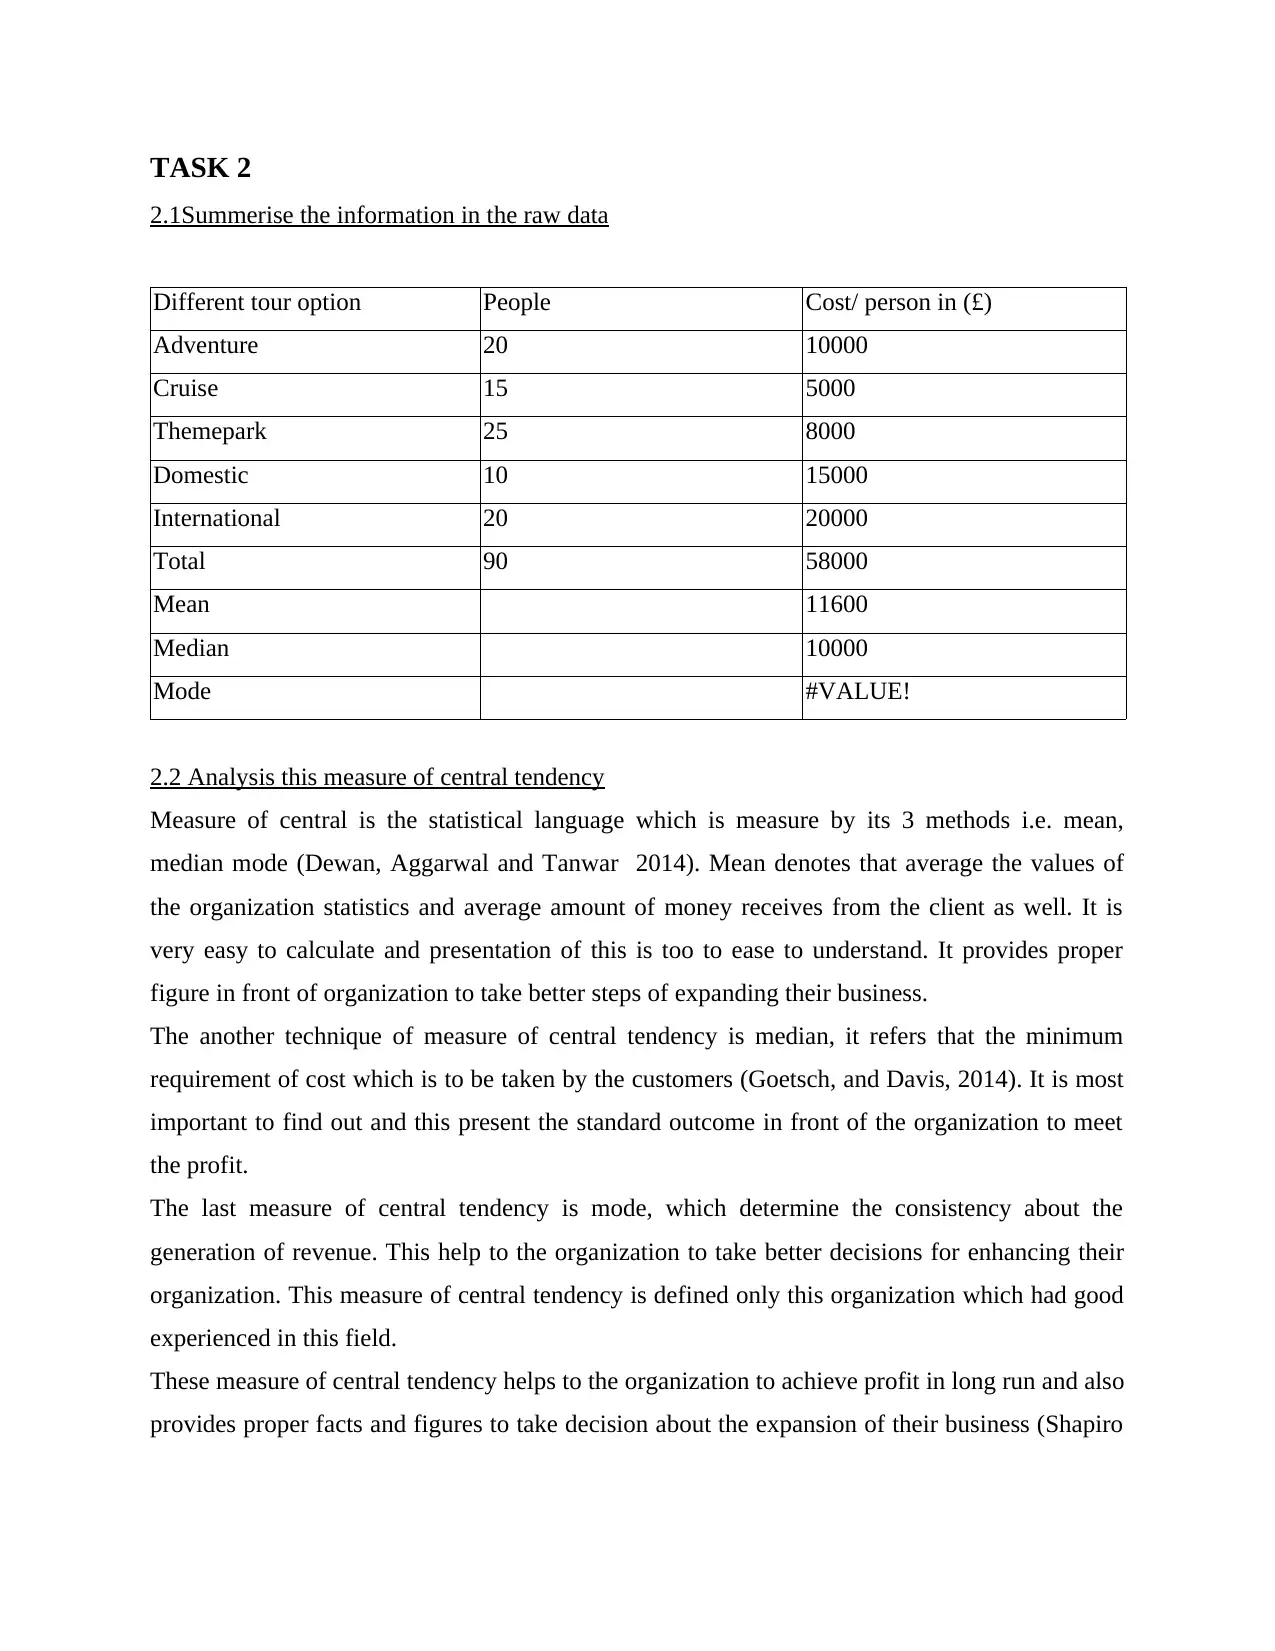
2.1Summerise the information in the raw data
Different tour option People Cost/ person in (£)
Adventure 20 10000
Cruise 15 5000
Themepark 25 8000
Domestic 10 15000
International 20 20000
Total 90 58000
Mean 11600
Median 10000
Mode #VALUE!
2.2 Analysis this measure of central tendency
Measure of central is the statistical language which is measure by its 3 methods i.e. mean,
median mode (Dewan, Aggarwal and Tanwar 2014). Mean denotes that average the values of
the organization statistics and average amount of money receives from the client as well. It is
very easy to calculate and presentation of this is too to ease to understand. It provides proper
figure in front of organization to take better steps of expanding their business.
The another technique of measure of central tendency is median, it refers that the minimum
requirement of cost which is to be taken by the customers (Goetsch, and Davis, 2014). It is most
important to find out and this present the standard outcome in front of the organization to meet
the profit.
The last measure of central tendency is mode, which determine the consistency about the
generation of revenue. This help to the organization to take better decisions for enhancing their
organization. This measure of central tendency is defined only this organization which had good
experienced in this field.
These measure of central tendency helps to the organization to achieve profit in long run and also
provides proper facts and figures to take decision about the expansion of their business (Shapiro
and Stefkovich 2016). As per the above table mean of the organization is 11600 which denotes
the average amount receive from customers and median is 10000 which is minimum amount of
money required from customer to the organization. There is no mode which defines the
fluctuations of the revenue so that the profit of the organization does not remain constant. These
methods provide information about the average cost requires form the customers or minimum
amount of money require form each customers and also about the revenue generation which
mostly repeated in the organization. In fact, tour and travel organization major uses this method
for expanding their business.
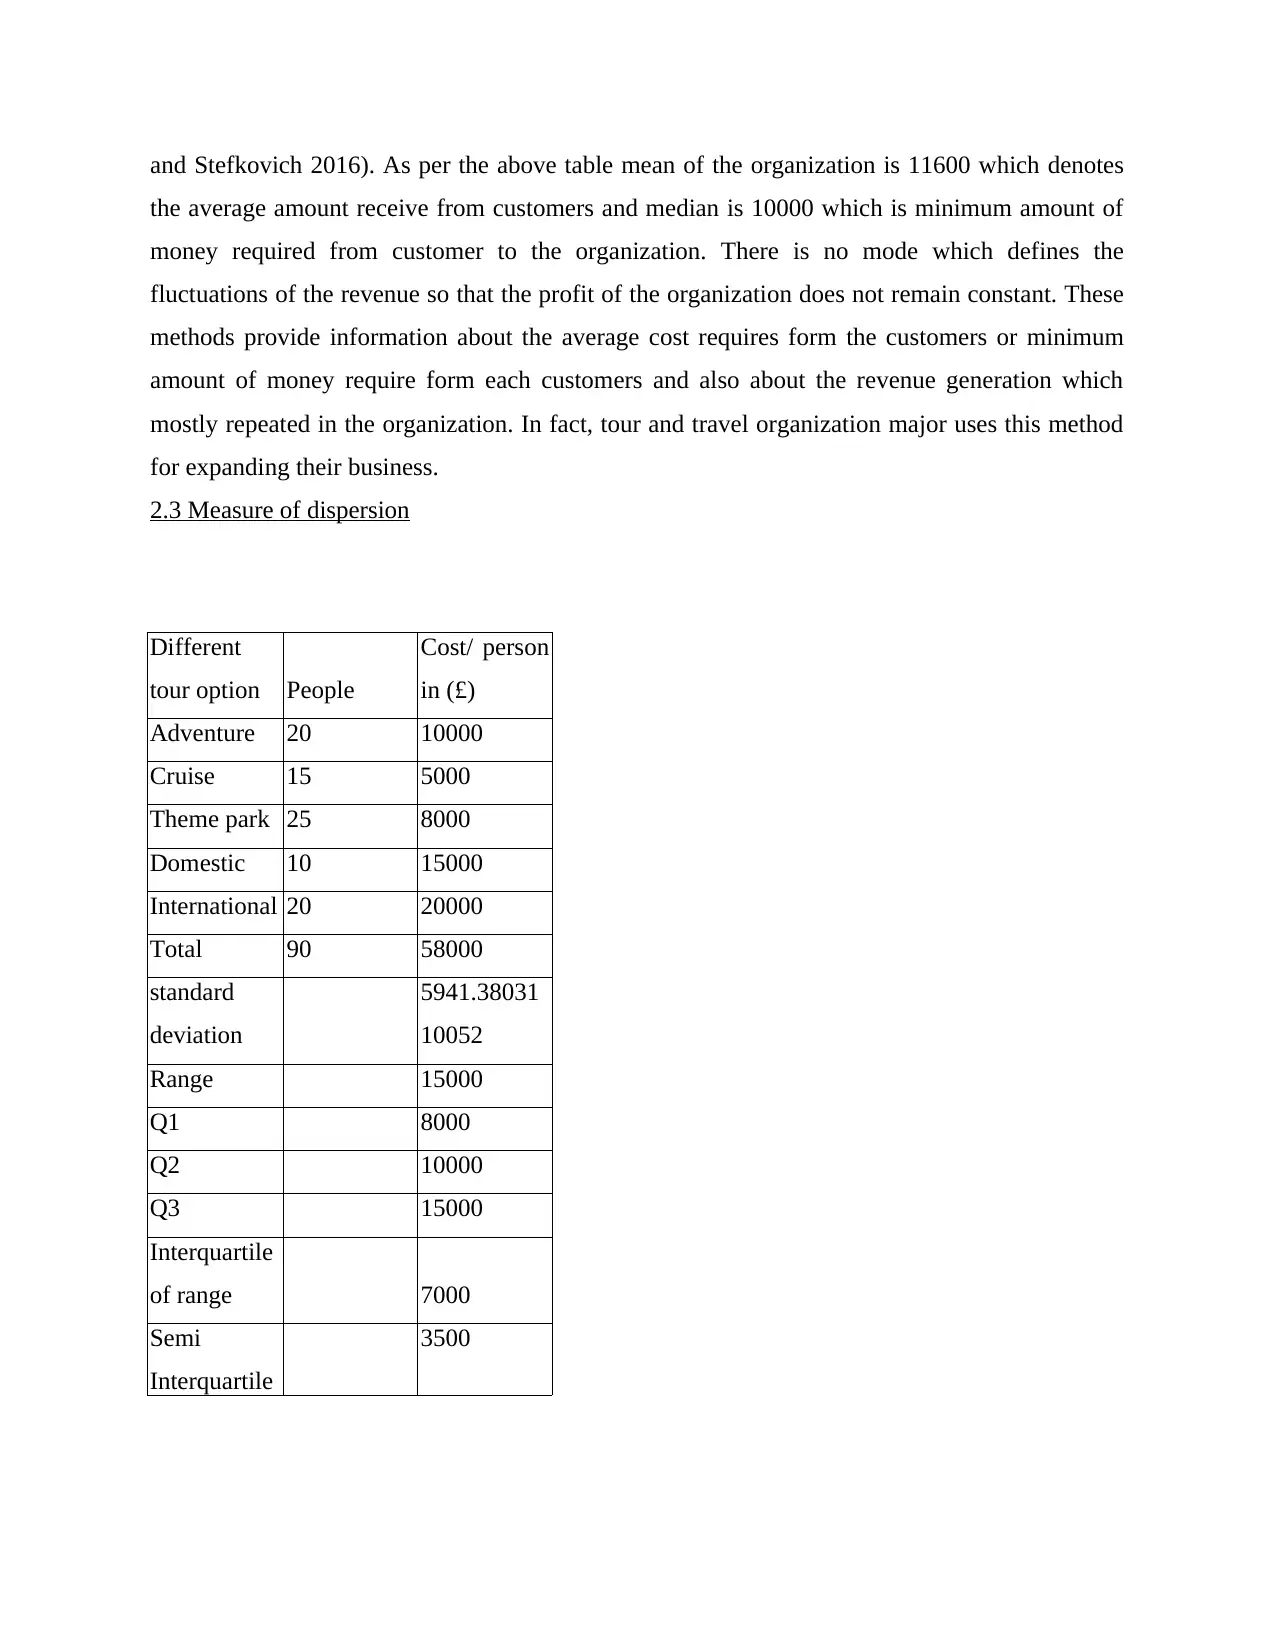
2.3 Measure of dispersion
Different
tour option People
Cost/ person
in (£)
Adventure 20 10000
Cruise 15 5000
Theme park 25 8000
Domestic 10 15000
International 20 20000
Total 90 58000
standard
deviation
5941.38031
10052
Range 15000
Q1 8000
Q2 10000
Q3 15000
Interquartile
of range 7000
Semi
Interquartile
3500
the average amount receive from customers and median is 10000 which is minimum amount of
money required from customer to the organization. There is no mode which defines the
fluctuations of the revenue so that the profit of the organization does not remain constant. These
methods provide information about the average cost requires form the customers or minimum
amount of money require form each customers and also about the revenue generation which
mostly repeated in the organization. In fact, tour and travel organization major uses this method
for expanding their business.
2.3 Measure of dispersion
Different
tour option People
Cost/ person
in (£)
Adventure 20 10000
Cruise 15 5000
Theme park 25 8000
Domestic 10 15000
International 20 20000
Total 90 58000
standard
deviation
5941.38031
10052
Range 15000
Q1 8000
Q2 10000
Q3 15000
Interquartile
of range 7000
Semi
Interquartile
3500
⊘ This is a preview!⊘
Do you want full access?
Subscribe today to unlock all pages.
Trusted by 1+ million students worldwide
of range
Measure of dispersion denotes the variability of the business organization to the extent through
which it elastically distributes them. There are various methods through which measure of
dispersion is determined such as, standard deviation, range like interquartile or semi quartile so
that the organization can take the best decision for their expansion and also it helps them to
rectify some problem and increases their outcome (Atkinson, Bayazit and Karpak 2015).
The first method of measure of dispersion standard deviation, it denotes the changes in revenue
of the organization. Standard of deviation is higher than the organization achieves high amount
of profit or revenue and if it is lower than it shows the lower revenue. This presents the
indication of revenue level of the organization that whether it is need to be maximize or not
(Kaner, 2014).
The another method of measuring of dispersion is Range, it shows the difference between the
maximum and minimum option for getting the information about the benefit which may be occur
by the organization. It is too important to calculate because it provides the knowledge that
whether organization has to switch on the another option for getting higher profit or not. It also
indicates the range as interquartile or semi interquartile. It defines the figure that equal the upper
and lower percentile of the quarter so that organization by using these data take decision about
the changes in the organization.
The above table determine the standard deviation is 5941.3803110052 and range of the
organization is 15000 this reflect that the organization achieve higher amount of profit in long
run. The tour and travel organization have majorly effected these data for expanding or
innovating their business (Barlett, ed., 2016). This data provides them to achieve good amount of
money and also provides the information about the need of changes in the organization. These
measures of central tendency provides them equivalent data for increases the efficiency and
effectiveness of the business.
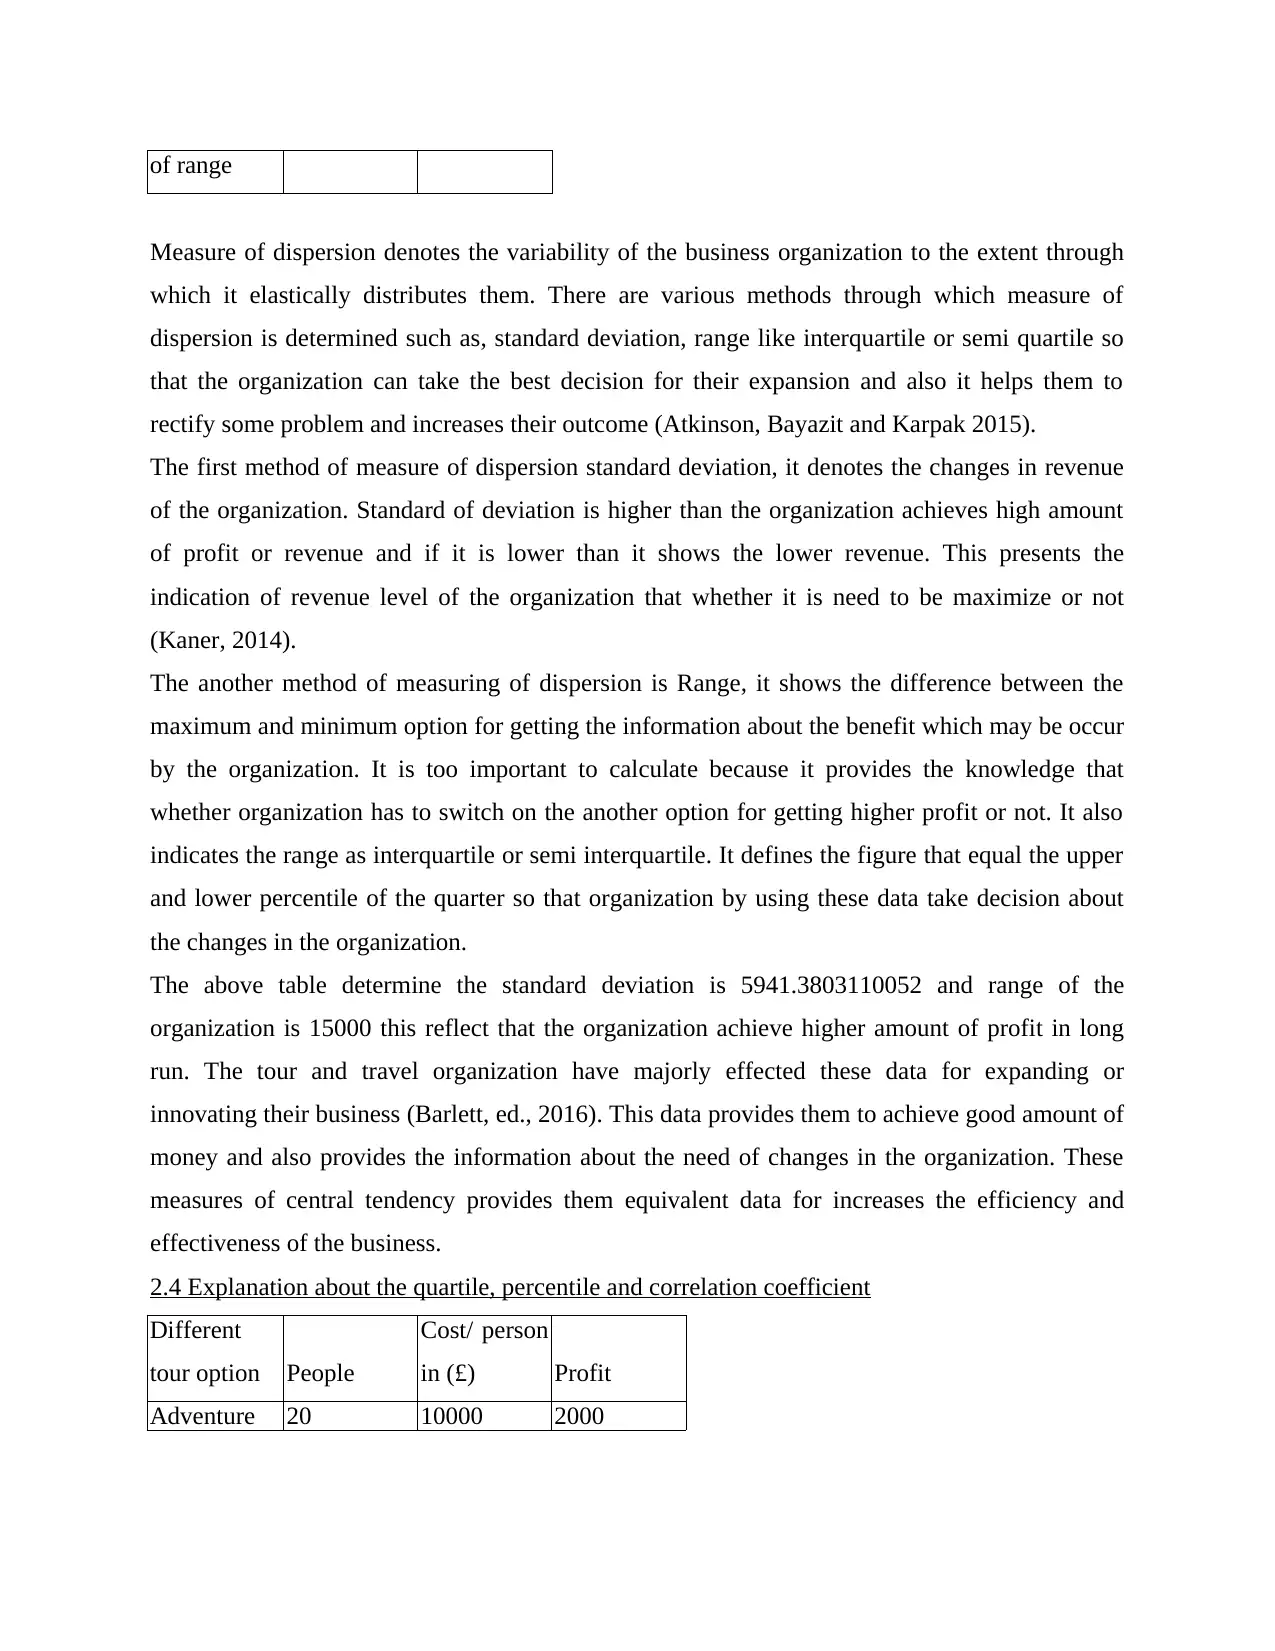
2.4 Explanation about the quartile, percentile and correlation coefficient
Different
tour option People
Cost/ person
in (£) Profit
Adventure 20 10000 2000
Measure of dispersion denotes the variability of the business organization to the extent through
which it elastically distributes them. There are various methods through which measure of
dispersion is determined such as, standard deviation, range like interquartile or semi quartile so
that the organization can take the best decision for their expansion and also it helps them to
rectify some problem and increases their outcome (Atkinson, Bayazit and Karpak 2015).
The first method of measure of dispersion standard deviation, it denotes the changes in revenue
of the organization. Standard of deviation is higher than the organization achieves high amount
of profit or revenue and if it is lower than it shows the lower revenue. This presents the
indication of revenue level of the organization that whether it is need to be maximize or not
(Kaner, 2014).
The another method of measuring of dispersion is Range, it shows the difference between the
maximum and minimum option for getting the information about the benefit which may be occur
by the organization. It is too important to calculate because it provides the knowledge that
whether organization has to switch on the another option for getting higher profit or not. It also
indicates the range as interquartile or semi interquartile. It defines the figure that equal the upper
and lower percentile of the quarter so that organization by using these data take decision about
the changes in the organization.
The above table determine the standard deviation is 5941.3803110052 and range of the
organization is 15000 this reflect that the organization achieve higher amount of profit in long
run. The tour and travel organization have majorly effected these data for expanding or
innovating their business (Barlett, ed., 2016). This data provides them to achieve good amount of
money and also provides the information about the need of changes in the organization. These
measures of central tendency provides them equivalent data for increases the efficiency and
effectiveness of the business.
2.4 Explanation about the quartile, percentile and correlation coefficient
Different
tour option People
Cost/ person
in (£) Profit
Adventure 20 10000 2000
Paraphrase This Document
Need a fresh take? Get an instant paraphrase of this document with our AI Paraphraser
Cruise 15 5000 1000
Themepark 25 8000 1500
Domestic 10 15000 3000
International 20 20000 5000
Total 90 58000
Range 15000
Q1 8000
Q2 10000
Q3 15000
correlation
coefficient 0.98
Quartile or percentile are one end the same thing because quartile shows the the values as per the
random variable and percentile shows it in the percentage. It provides the information about the
organizer of the revenues of every quarter in a year so that the organization can take decision as
per this basis that which month of the year more productive and which technique is more
preferable to get the best revenue (Ghattas, Soffer, and Peleg, 2014). This will lead the profit
potentiality of the organization and help them to become more productive.
The another term is correlation coefficient which determines the relation whether they are
dependent or independent such as, if revenue of the organization increases than profit of it is
automatically increases this states the dependent relationship and if the values are not increase
or decreases as according to other than this relationship is called independent relationship. It lies
in the range of zero to one.
The organization achieve their target and goal effectively through applying all this information.
By using this information they can take decision for expanding their business with high
potentiality and profits in long run. These methods are not easy for calculate so the organization
have to need specialist to do them. This requires extra payment so that majorly big enterprises
uses this technique for expansion of their business. From the above figure the correlation
coefficient of the organization is .98, this is the positive figure and slight below from the one
(Kaner, 2014). This denotes that whether cost person increases than the profit of person also
increases and vice versa. It indicates the high profit volume of the organization and they can
easily expand their business with long term profitability.
TASK 3
3.1 Charts and graphs
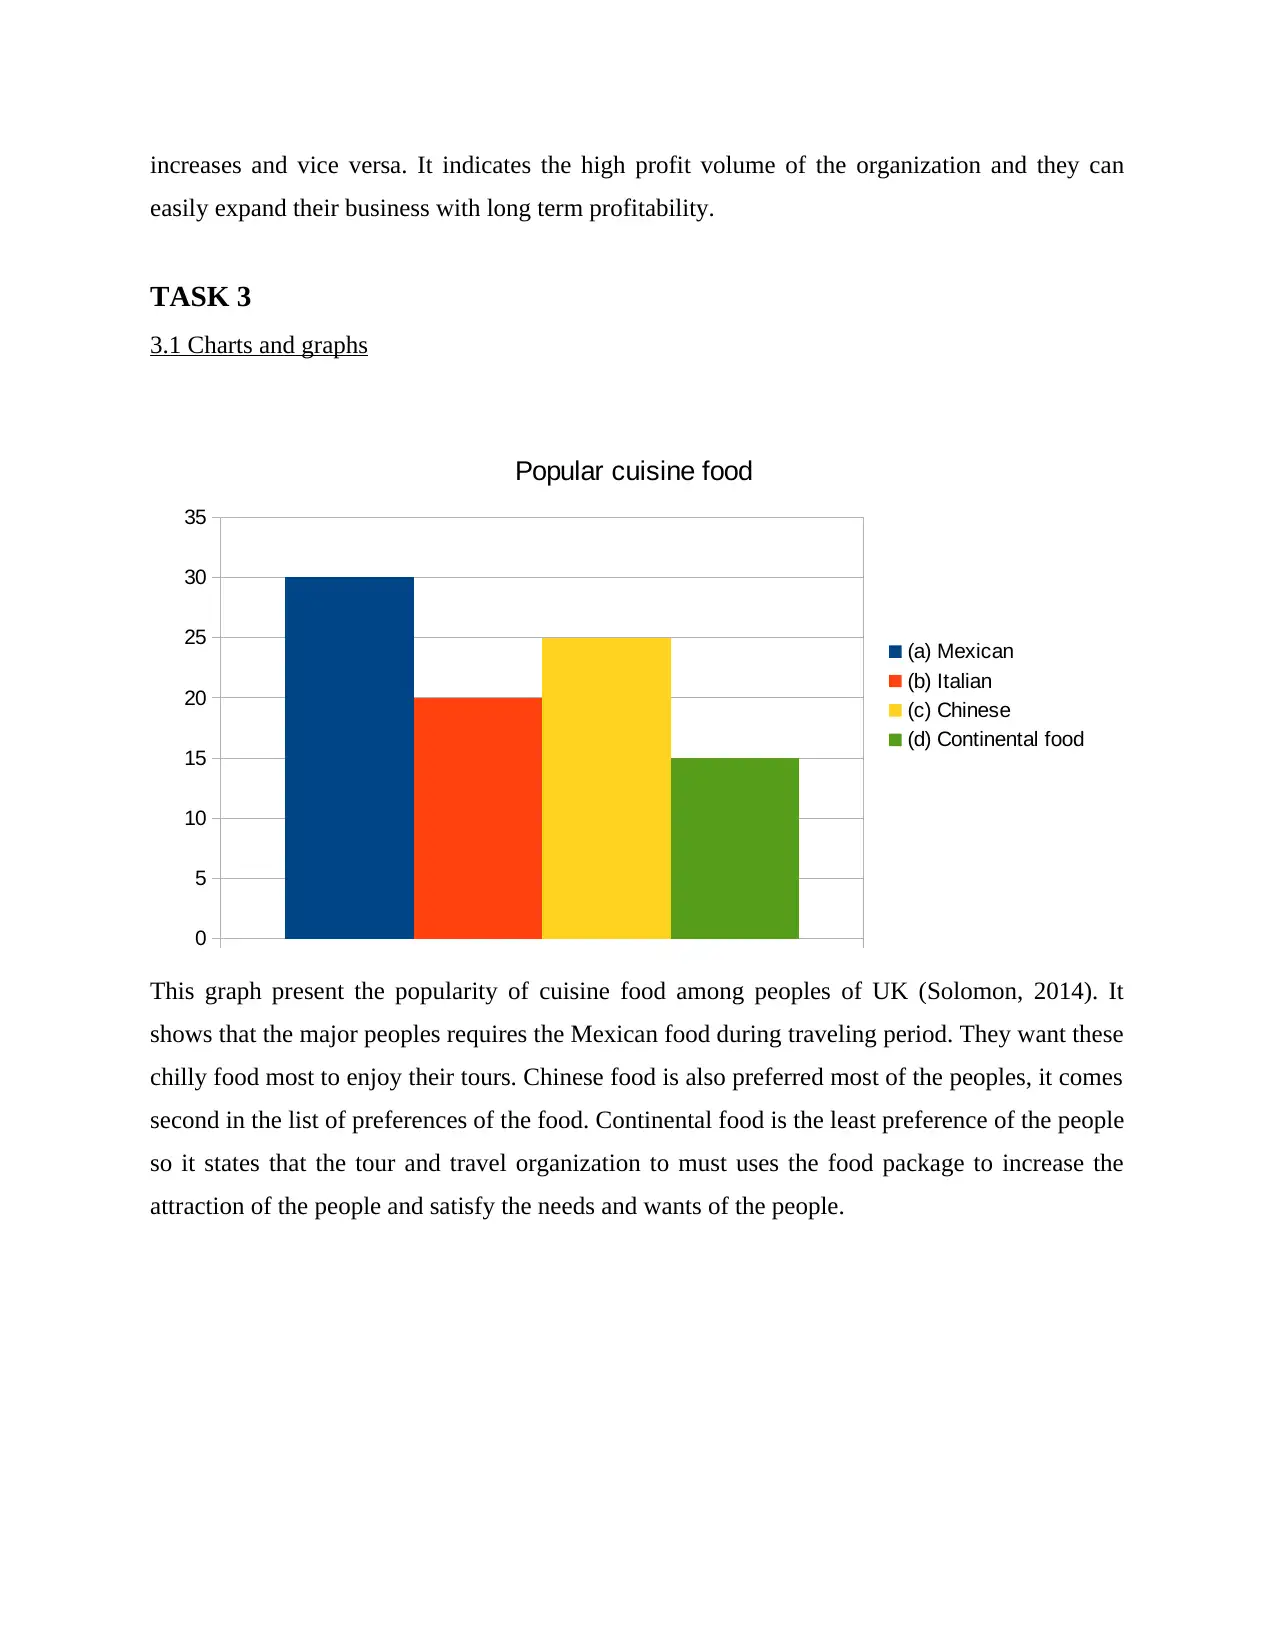
This graph present the popularity of cuisine food among peoples of UK (Solomon, 2014). It
shows that the major peoples requires the Mexican food during traveling period. They want these
chilly food most to enjoy their tours. Chinese food is also preferred most of the peoples, it comes
second in the list of preferences of the food. Continental food is the least preference of the people
so it states that the tour and travel organization to must uses the food package to increase the
attraction of the people and satisfy the needs and wants of the people.
0
5
10
15
20
25
30
35
Popular cuisine food
(a) Mexican
(b) Italian
(c) Chinese
(d) Continental food
easily expand their business with long term profitability.
TASK 3
3.1 Charts and graphs
This graph present the popularity of cuisine food among peoples of UK (Solomon, 2014). It
shows that the major peoples requires the Mexican food during traveling period. They want these
chilly food most to enjoy their tours. Chinese food is also preferred most of the peoples, it comes
second in the list of preferences of the food. Continental food is the least preference of the people
so it states that the tour and travel organization to must uses the food package to increase the
attraction of the people and satisfy the needs and wants of the people.
0
5
10
15
20
25
30
35
Popular cuisine food
(a) Mexican
(b) Italian
(c) Chinese
(d) Continental food
⊘ This is a preview!⊘
Do you want full access?
Subscribe today to unlock all pages.
Trusted by 1+ million students worldwide
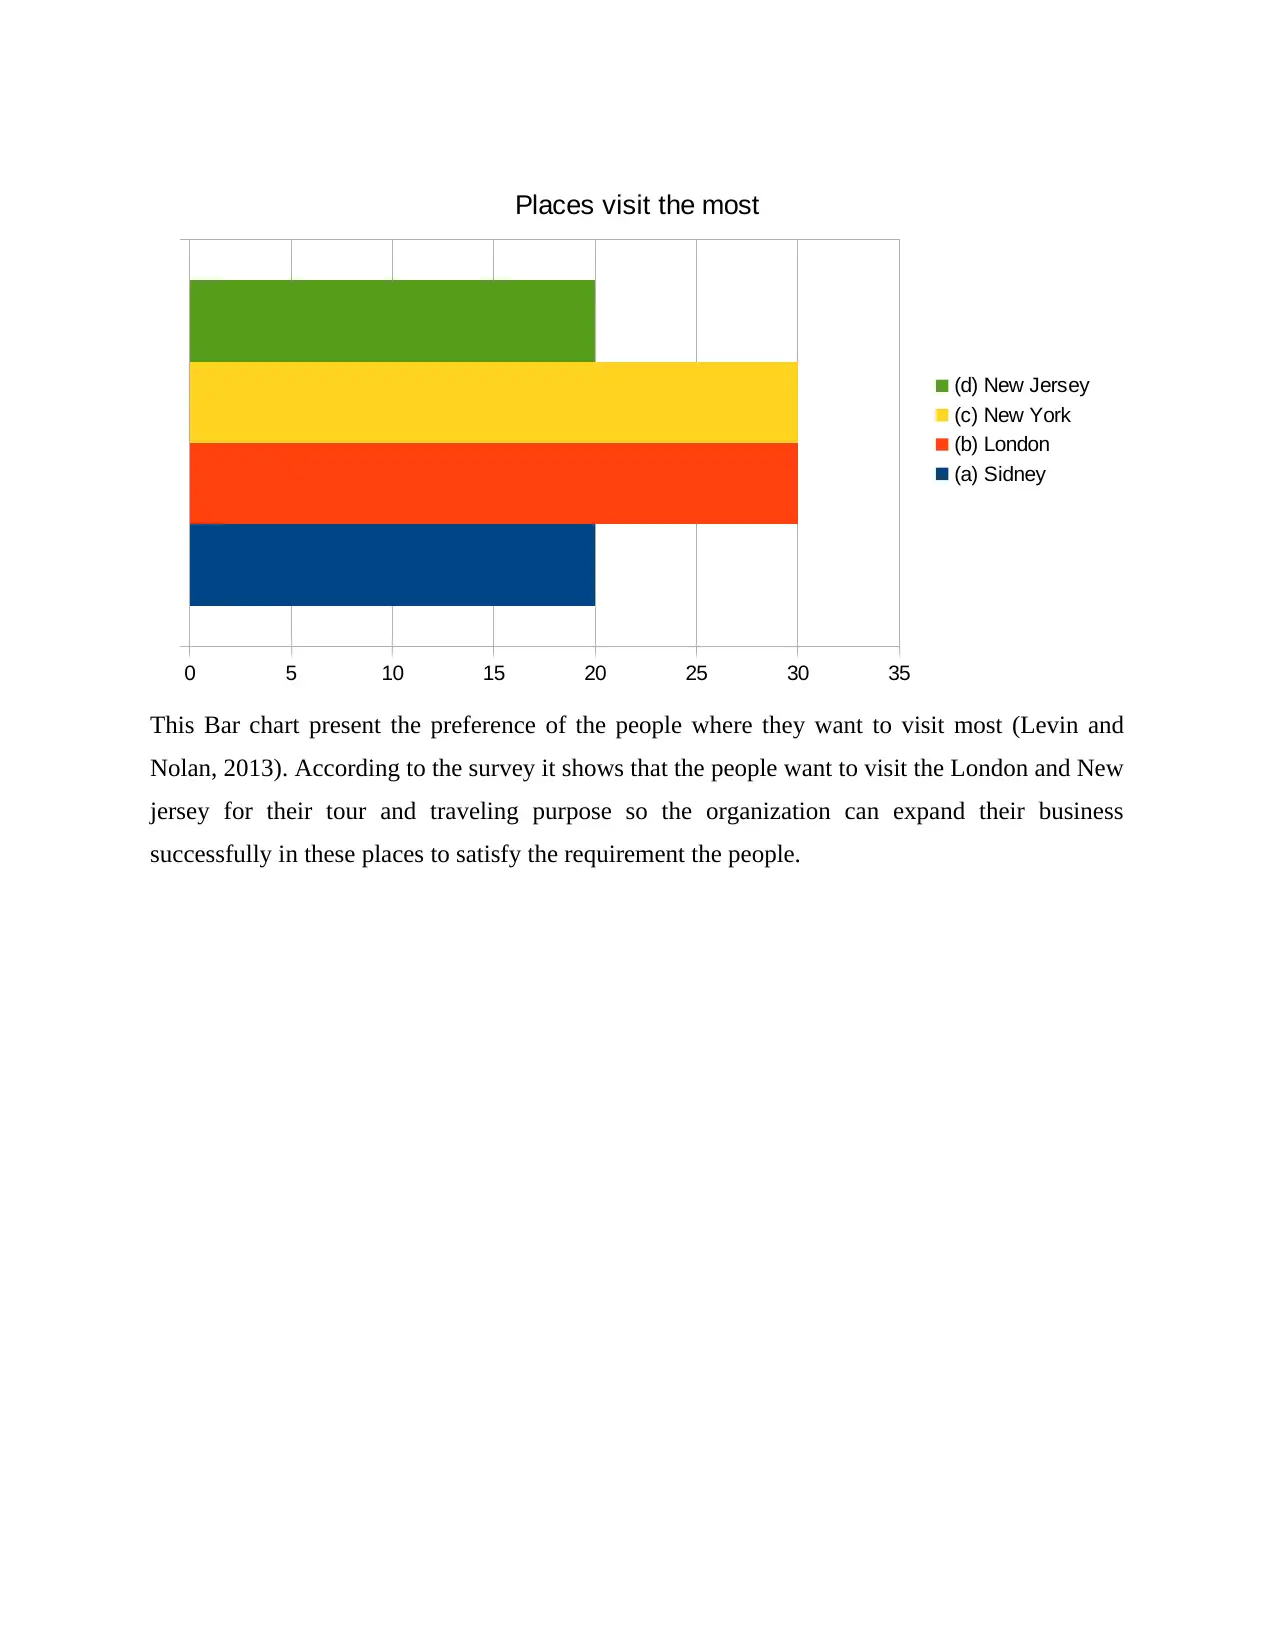
This Bar chart present the preference of the people where they want to visit most (Levin and
Nolan, 2013). According to the survey it shows that the people want to visit the London and New
jersey for their tour and traveling purpose so the organization can expand their business
successfully in these places to satisfy the requirement the people.
0 5 10 15 20 25 30 35
Places visit the most
(d) New Jersey
(c) New York
(b) London
(a) Sidney
Paraphrase This Document
Need a fresh take? Get an instant paraphrase of this document with our AI Paraphraser
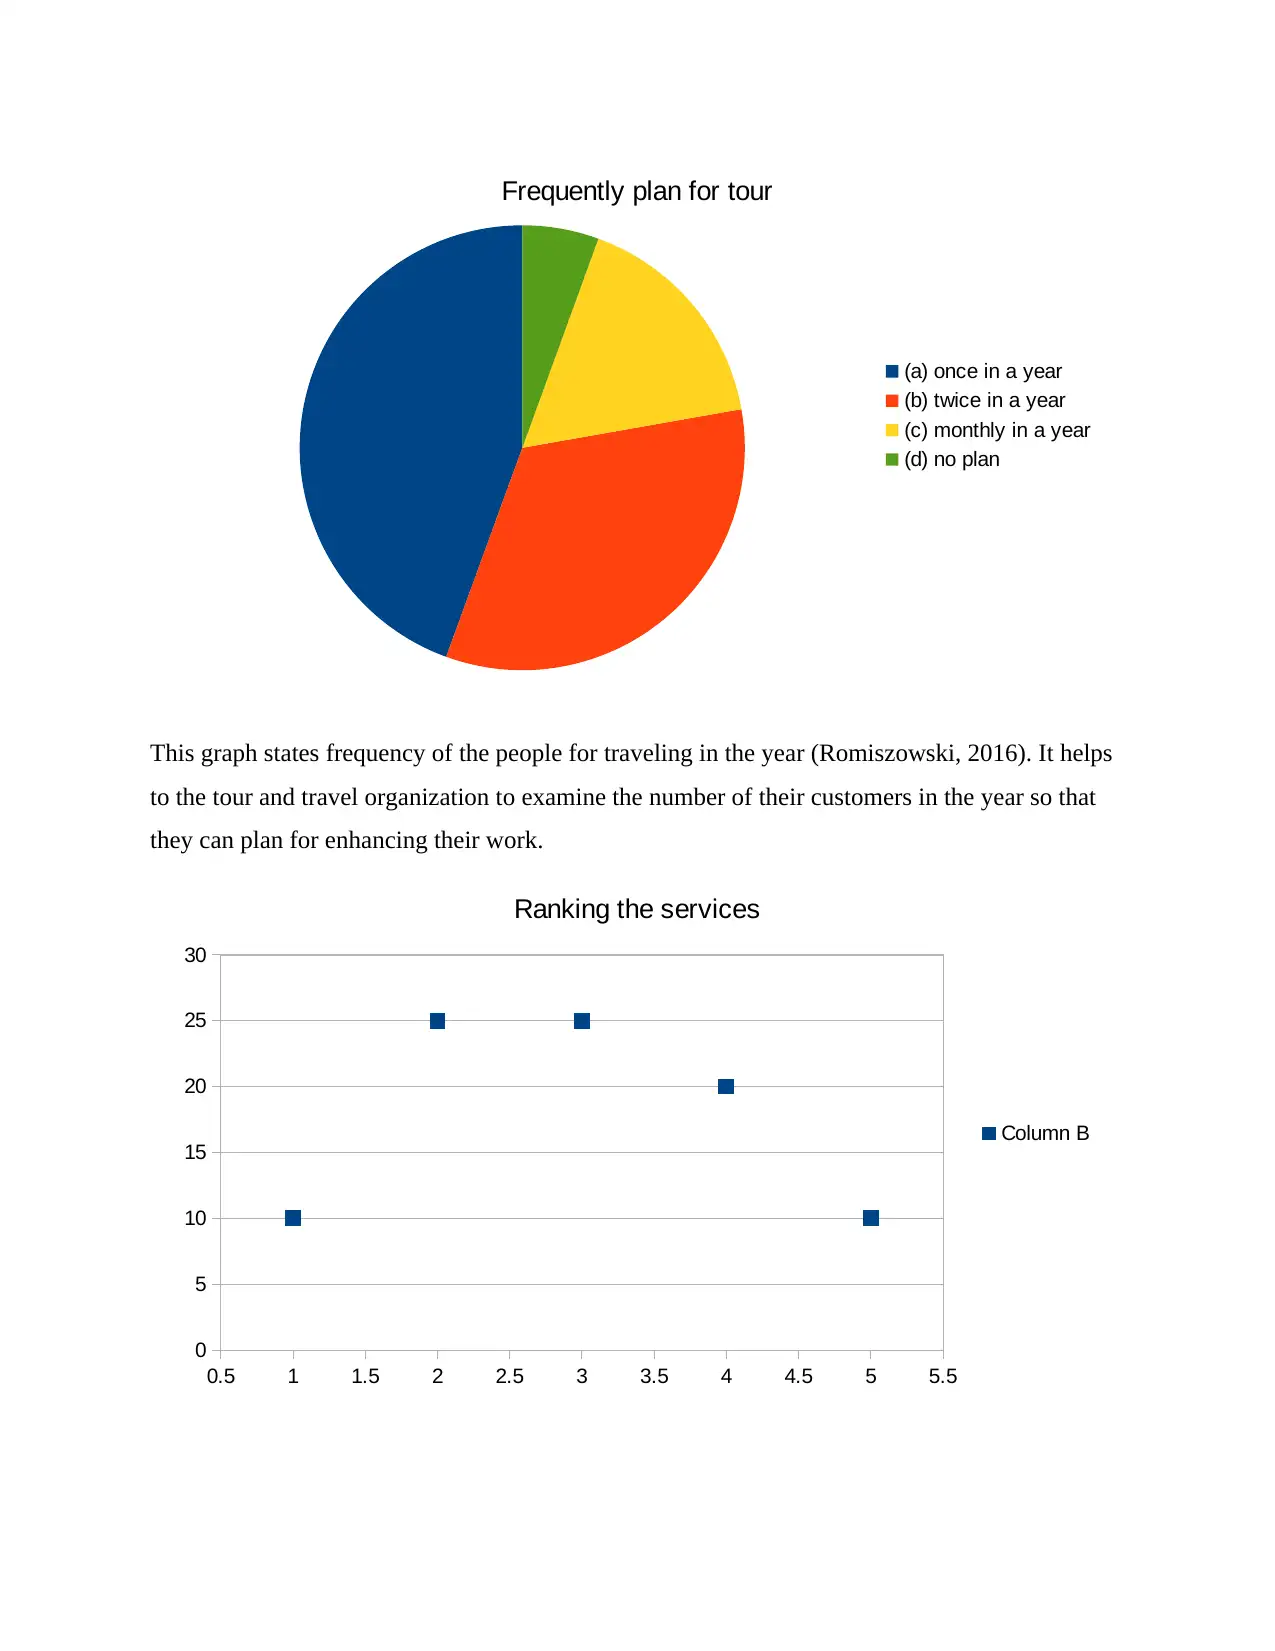
This graph states frequency of the people for traveling in the year (Romiszowski, 2016). It helps
to the tour and travel organization to examine the number of their customers in the year so that
they can plan for enhancing their work.
Frequently plan for tour
(a) once in a year
(b) twice in a year
(c) monthly in a year
(d) no plan
0.5 1 1.5 2 2.5 3 3.5 4 4.5 5 5.5
0
5
10
15
20
25
30
Ranking the services
Column B
This graph about the services which is ranked by the people of UK (Zsambok and Klein 2014.).
It shows that the people point of view from the services which organization provides them. It
will help to the organization achieve the satisfaction level of customers by providing the better
services. Through this they satisfy the need of the customers and increases their productivity by
expanding their business.
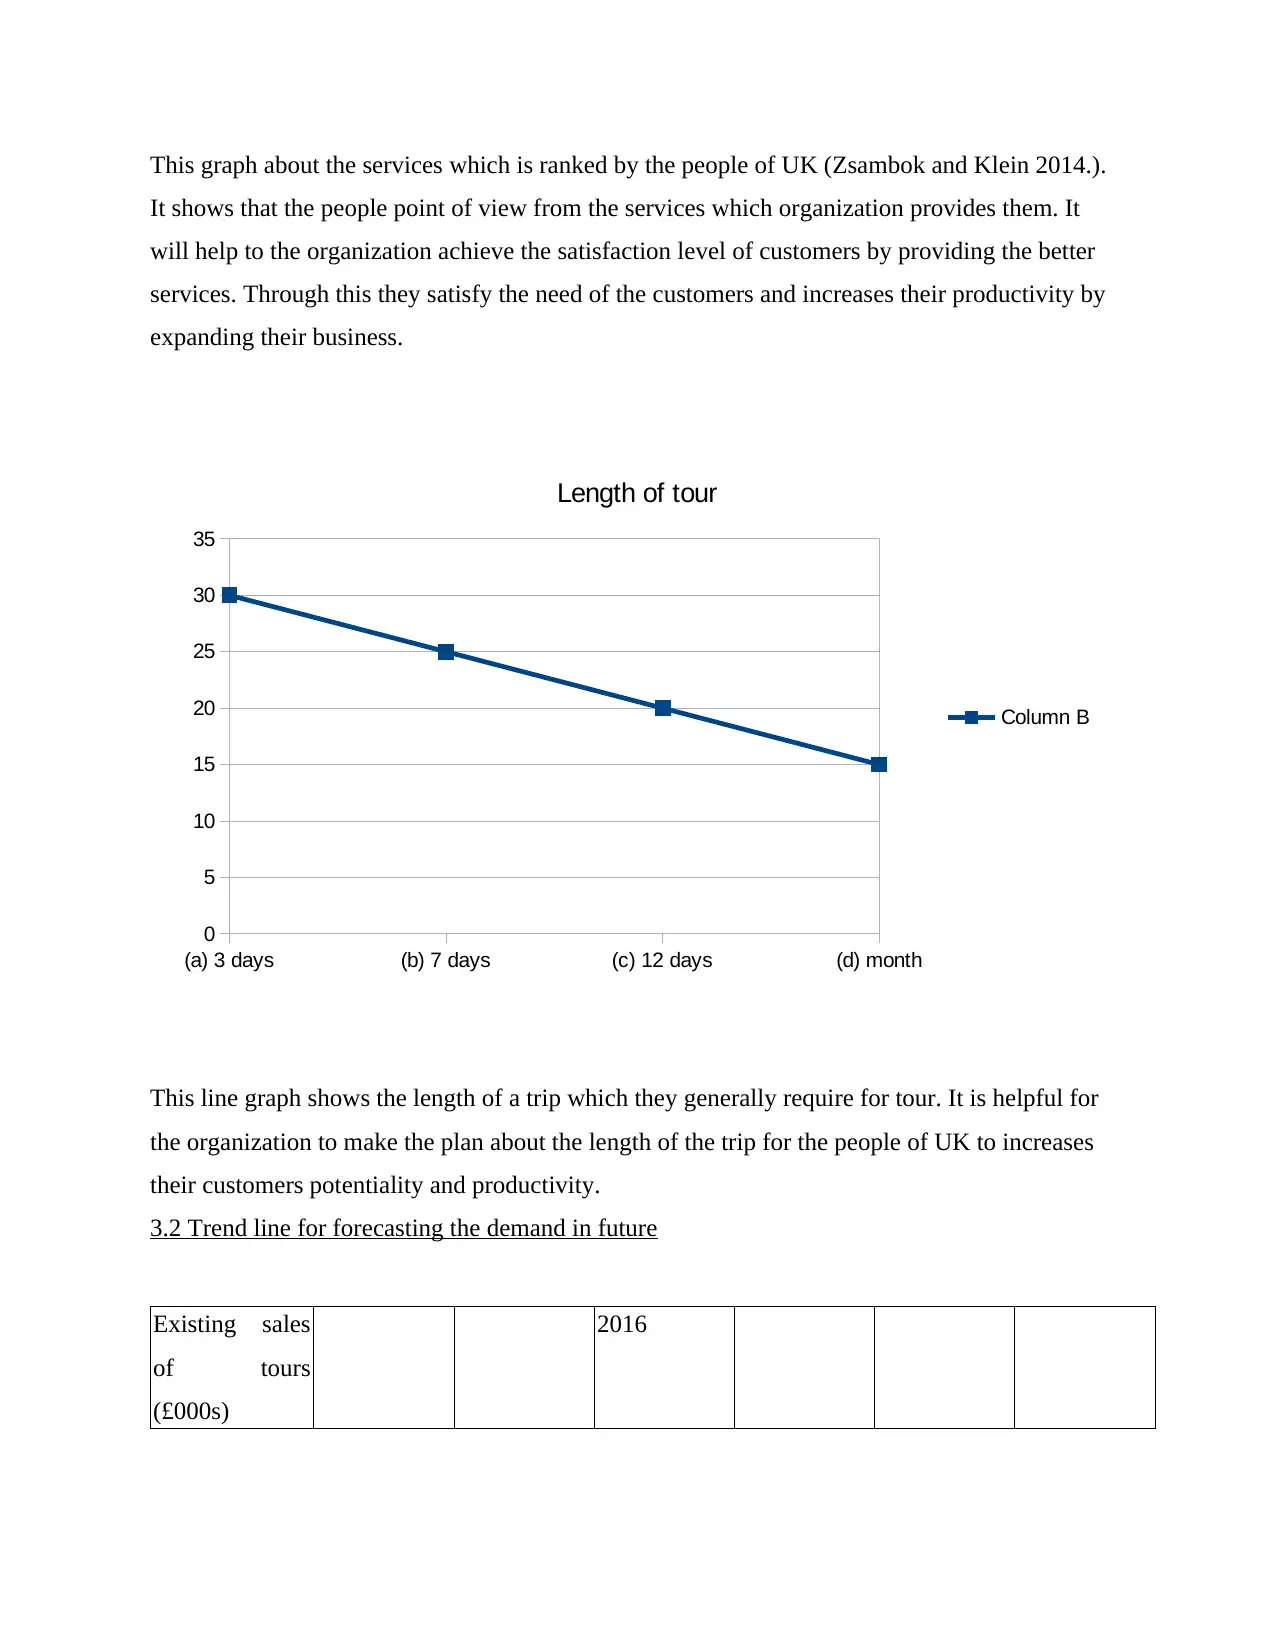
This line graph shows the length of a trip which they generally require for tour. It is helpful for
the organization to make the plan about the length of the trip for the people of UK to increases
their customers potentiality and productivity.
3.2 Trend line for forecasting the demand in future
Existing sales
of tours
(£000s)
2016
(a) 3 days (b) 7 days (c) 12 days (d) month
0
5
10
15
20
25
30
35
Length of tour
Column B
It shows that the people point of view from the services which organization provides them. It
will help to the organization achieve the satisfaction level of customers by providing the better
services. Through this they satisfy the need of the customers and increases their productivity by
expanding their business.
This line graph shows the length of a trip which they generally require for tour. It is helpful for
the organization to make the plan about the length of the trip for the people of UK to increases
their customers potentiality and productivity.
3.2 Trend line for forecasting the demand in future
Existing sales
of tours
(£000s)
2016
(a) 3 days (b) 7 days (c) 12 days (d) month
0
5
10
15
20
25
30
35
Length of tour
Column B
⊘ This is a preview!⊘
Do you want full access?
Subscribe today to unlock all pages.
Trusted by 1+ million students worldwide
1 out of 18
Related Documents


Your All-in-One AI-Powered Toolkit for Academic Success.
+13062052269
info@desklib.com
Available 24*7 on WhatsApp / Email
![[object Object]](/_next/static/media/star-bottom.7253800d.svg)
Unlock your academic potential
Copyright © 2020–2026 A2Z Services. All Rights Reserved. Developed and managed by ZUCOL.