Business Decision Making Report: Data Analysis and Presentation
VerifiedAdded on 2020/07/23
|18
|4614
|220
Report
AI Summary
This report provides a comprehensive analysis of business decision-making, focusing on a case study of Murano restaurant in the UK. The report begins with an introduction outlining the importance of data in managerial decision-making and then proceeds to detail the methods of data collection, including primary and secondary data sources. It explains the use of sampling methods, survey methodologies, and questionnaire design to gather relevant information. The report then delves into the analysis of the collected data using statistical tools such as mean, median, mode, and measures of dispersion, including standard deviation, to derive meaningful insights. Furthermore, the report demonstrates the creation of charts and graphs for data presentation, trend line forecasting, and the preparation of a formal business report. It also explores the advantages of information processing tools and financial tools in decision-making. The report concludes with a summary of the findings and offers recommendations based on the analysis.
Business Decision Making
Paraphrase This Document
Need a fresh take? Get an instant paraphrase of this document with our AI Paraphraser
Table of Contents
INTRODUCTION...........................................................................................................................1
TASK 1............................................................................................................................................1
1.1 Use of plan in collecting data through primary and secondary format............................1
1.2 Use of sampling method and survey methodology..........................................................2
1.3 Use of questionnaire in relation to data............................................................................2
2.1 Creation of information on the basis of questionnaire.....................................................4
2.2 Use of mean, median and mode and its analysis..............................................................4
2.3 Analysis of data using measure of dispersion with including standard deviation............5
2.4 Benefits of quartile, percentile and correlation coefficient in business context...............6
TASK 2............................................................................................................................................7
3.1 Preparation of charts, graphs in making a valid conclusion.............................................7
3.2 Creation of trend lines in future forecasting.....................................................................9
3.3 Business presentation.....................................................................................................10
3.4 Formation of formal business report to senior authority................................................10
TASK 3..........................................................................................................................................11
4.1 Information processing tools advantages to beneficial decision making.......................11
4.2 Formation of critical path management..........................................................................12
4.3 Benefits of financial tools in relation to make beneficial decision................................13
CONCLUSION..............................................................................................................................15
REFERENCES..............................................................................................................................16
INTRODUCTION
Manager has to take an effective decision for company and it is not much easy for them
because this will provide affect to entire working process either in a direct or indirect way. For
above stated aim, they will take assistance of information as well as data because it will support
them into decision making procedure (Bhattacharya and et. al., 2015). Present assignment is
based on Murano which is a restaurant and set up in UK. They are providing best and effective
items and services to customers which assist to fulfil their needs and wants proficiently. They
conduct research to get viewpoint of people. Along with, this project is going to describe many
tools which help manager in judgement process, such as mean, mode, median and many others.
Additionally, graphs are also presented to show the results effectually.
TASK 1
1.1 Use of plan in collecting data through primary and secondary format
Employer has to formulate proper plan because this helps them to fulfil overall work
systematically. It will include each and every exercise that is linked with project. To know needs
and requirements of clients, manager will conduct research in an appropriate way. In context of
Murano, they want to begin an another outlet in London so that, they will acquire more success
as well as development (Franks and et. al., 2013). Along with, they want to provide items and
beverages to customers which will satisfy their demand. They will get review from people
regarding selection of location. For this, they will use two techniques and these are stated as
below:
Primary data: It has been examined that this sort of data is related to current period and
very specific. By utilizing this tool, manager will easily collect viewpoints of many individuals
by maintaining proper communication with them. Foremost limitation of this method is, it
consumes high cost as well as time. To gather information by using this technique, superior of
Murano will formulate an adequate plan which assist them to do entire work systematically.
Along with, it aids them into maximum period of time. Some of main methodologies which will
comprise into this, such as questionnaire, survey and many others.
Secondary data: If employer is going to use this kind of tool to collect data as well as
information then, this will associated with past (Gaillard, 2014). Several methods which will
involve into this, like newspaper, books, internet, magazine, research paper, journals and so on.
1
⊘ This is a preview!⊘
Do you want full access?
Subscribe today to unlock all pages.
Trusted by 1+ million students worldwide
It is essential for manager to evaluate these info properly as it assists them to take an effective
decision for company.
Therefore, in this report superior will utilize primary source of method so that they will
collect data proficiently because it helps them to accomplish requirements and demands of
individual. Additionally, they will easily take benefits from rivals at marketplace (Hartman and
et. al., 2014).
1.2 Use of sampling method and survey methodology
If manager of an association is going to conduct research then, it is essential for them to
chose some persons and they called as sample. With assistance of them, they will organise
research effectively. Investigator will use sampling method as this is considered as much easy
tool and under this, they will choose some individuals. Henceforth, there are some sorts of
sample techniques which are portrays as beneath:
Stratified sampling
Random sampling
Cluster sampling
It has been evaluated that by using method of survey manager will collect data more effectively
(Kahraman and et. al., 2015). In this assignment, investigator is using random sampling
technique. For this aim, they selected 80 people on random basis. There are various kinds of
methodologies which will be utilized by superior of Murano so that he will gather requisite data
or information effectually, these are stated as below:
Questionnaire
Survey monkey
Social media
Henceforth, manager will use questionnaire tool as this is considered as most suitable method.
With aid of this, they will take judgement in a proper manner. This technique will help manager
to get viewpoint of distinctive persons.
1.3 Use of questionnaire in relation to data
By using questionnaire manager will gather information as well as data in more adequate
manner with support of various persons (Mardani and et. al., 2014). This will be divided into
many parts, like close ended, open ended, grouped, un grouped and many others. As a result,
2
Paraphrase This Document
Need a fresh take? Get an instant paraphrase of this document with our AI Paraphraser
employer of an association will easily take judgement for business. This will be much beneficial
for company as it helps them into their long term survival.
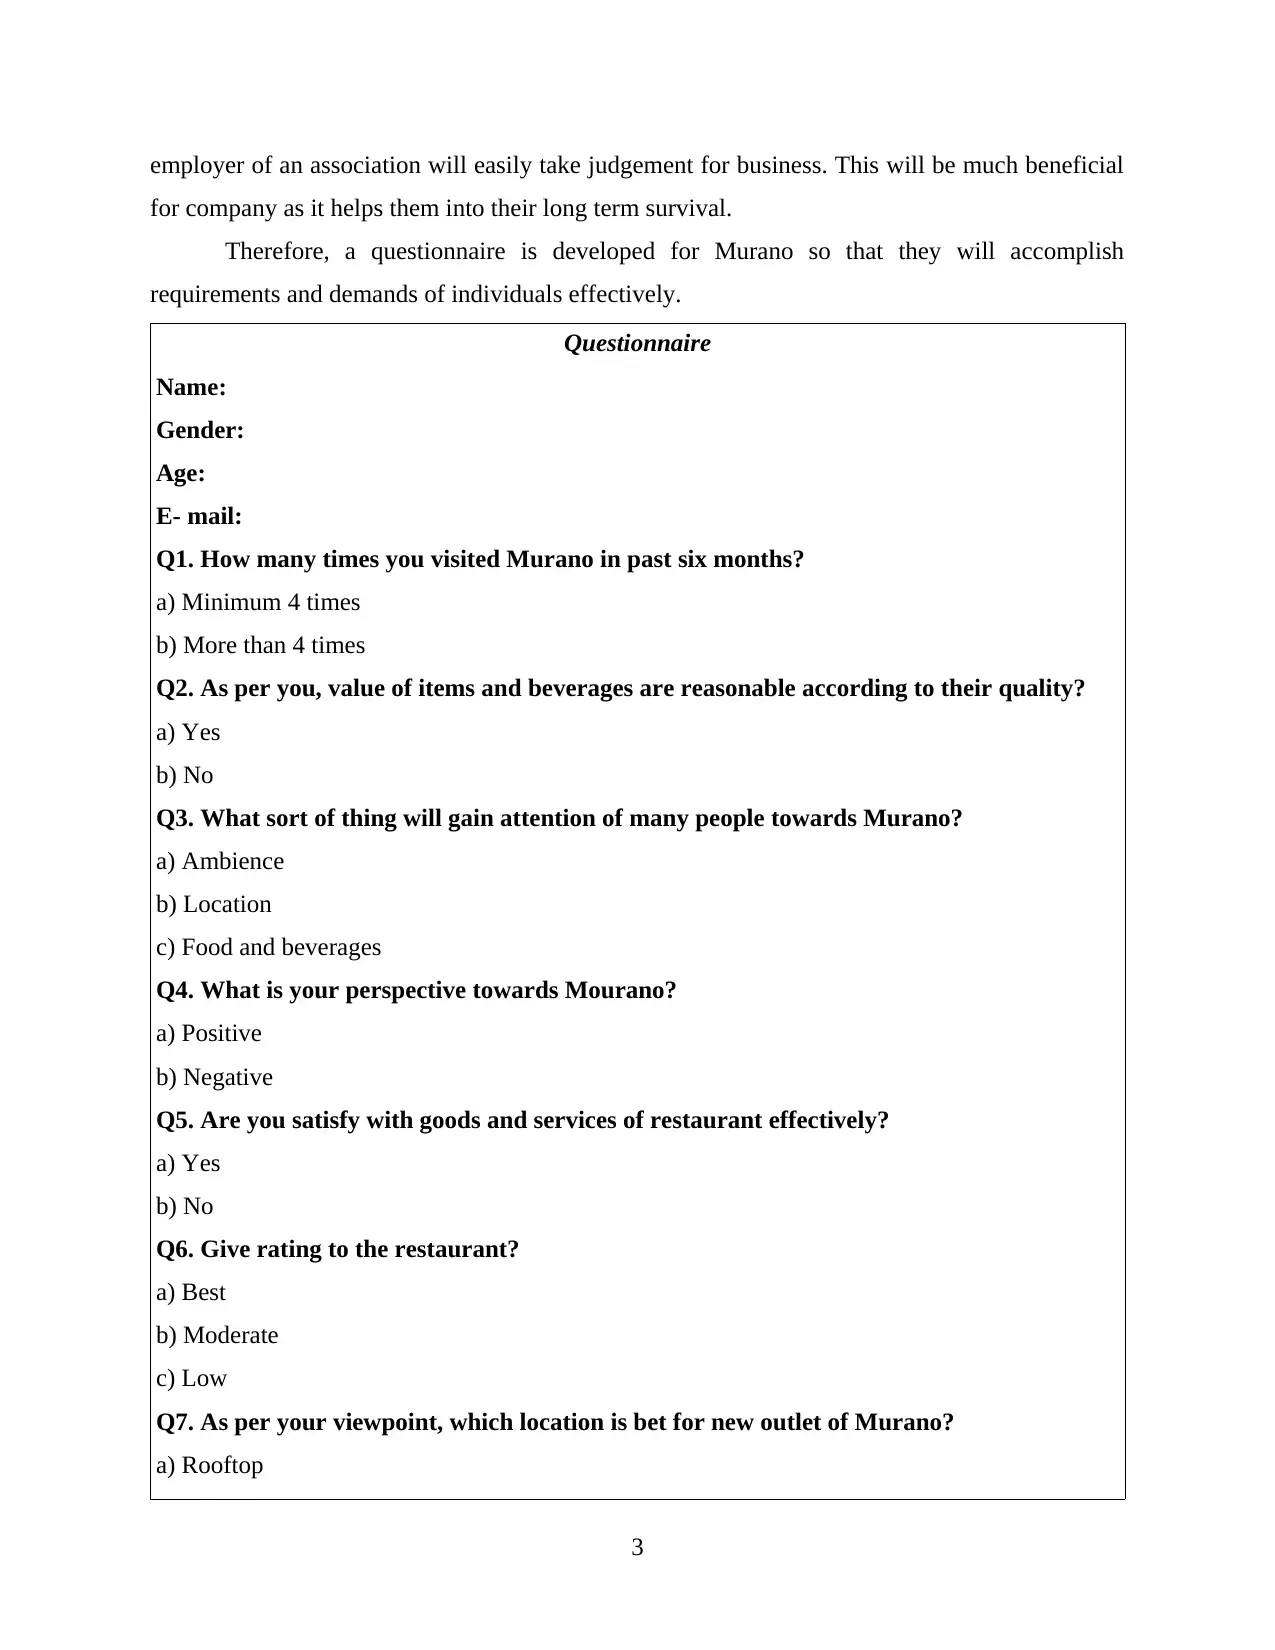
Therefore, a questionnaire is developed for Murano so that they will accomplish
requirements and demands of individuals effectively.
Questionnaire
Name:
Gender:
Age:
E- mail:
Q1. How many times you visited Murano in past six months?
a) Minimum 4 times
b) More than 4 times
Q2. As per you, value of items and beverages are reasonable according to their quality?
a) Yes
b) No
Q3. What sort of thing will gain attention of many people towards Murano?
a) Ambience
b) Location
c) Food and beverages
Q4. What is your perspective towards Mourano?
a) Positive
b) Negative
Q5. Are you satisfy with goods and services of restaurant effectively?
a) Yes
b) No
Q6. Give rating to the restaurant?
a) Best
b) Moderate
c) Low
Q7. As per your viewpoint, which location is bet for new outlet of Murano?
a) Rooftop
3
for company as it helps them into their long term survival.
Therefore, a questionnaire is developed for Murano so that they will accomplish
requirements and demands of individuals effectively.
Questionnaire
Name:
Gender:
Age:
E- mail:
Q1. How many times you visited Murano in past six months?
a) Minimum 4 times
b) More than 4 times
Q2. As per you, value of items and beverages are reasonable according to their quality?
a) Yes
b) No
Q3. What sort of thing will gain attention of many people towards Murano?
a) Ambience
b) Location
c) Food and beverages
Q4. What is your perspective towards Mourano?
a) Positive
b) Negative
Q5. Are you satisfy with goods and services of restaurant effectively?
a) Yes
b) No
Q6. Give rating to the restaurant?
a) Best
b) Moderate
c) Low
Q7. As per your viewpoint, which location is bet for new outlet of Murano?
a) Rooftop
3
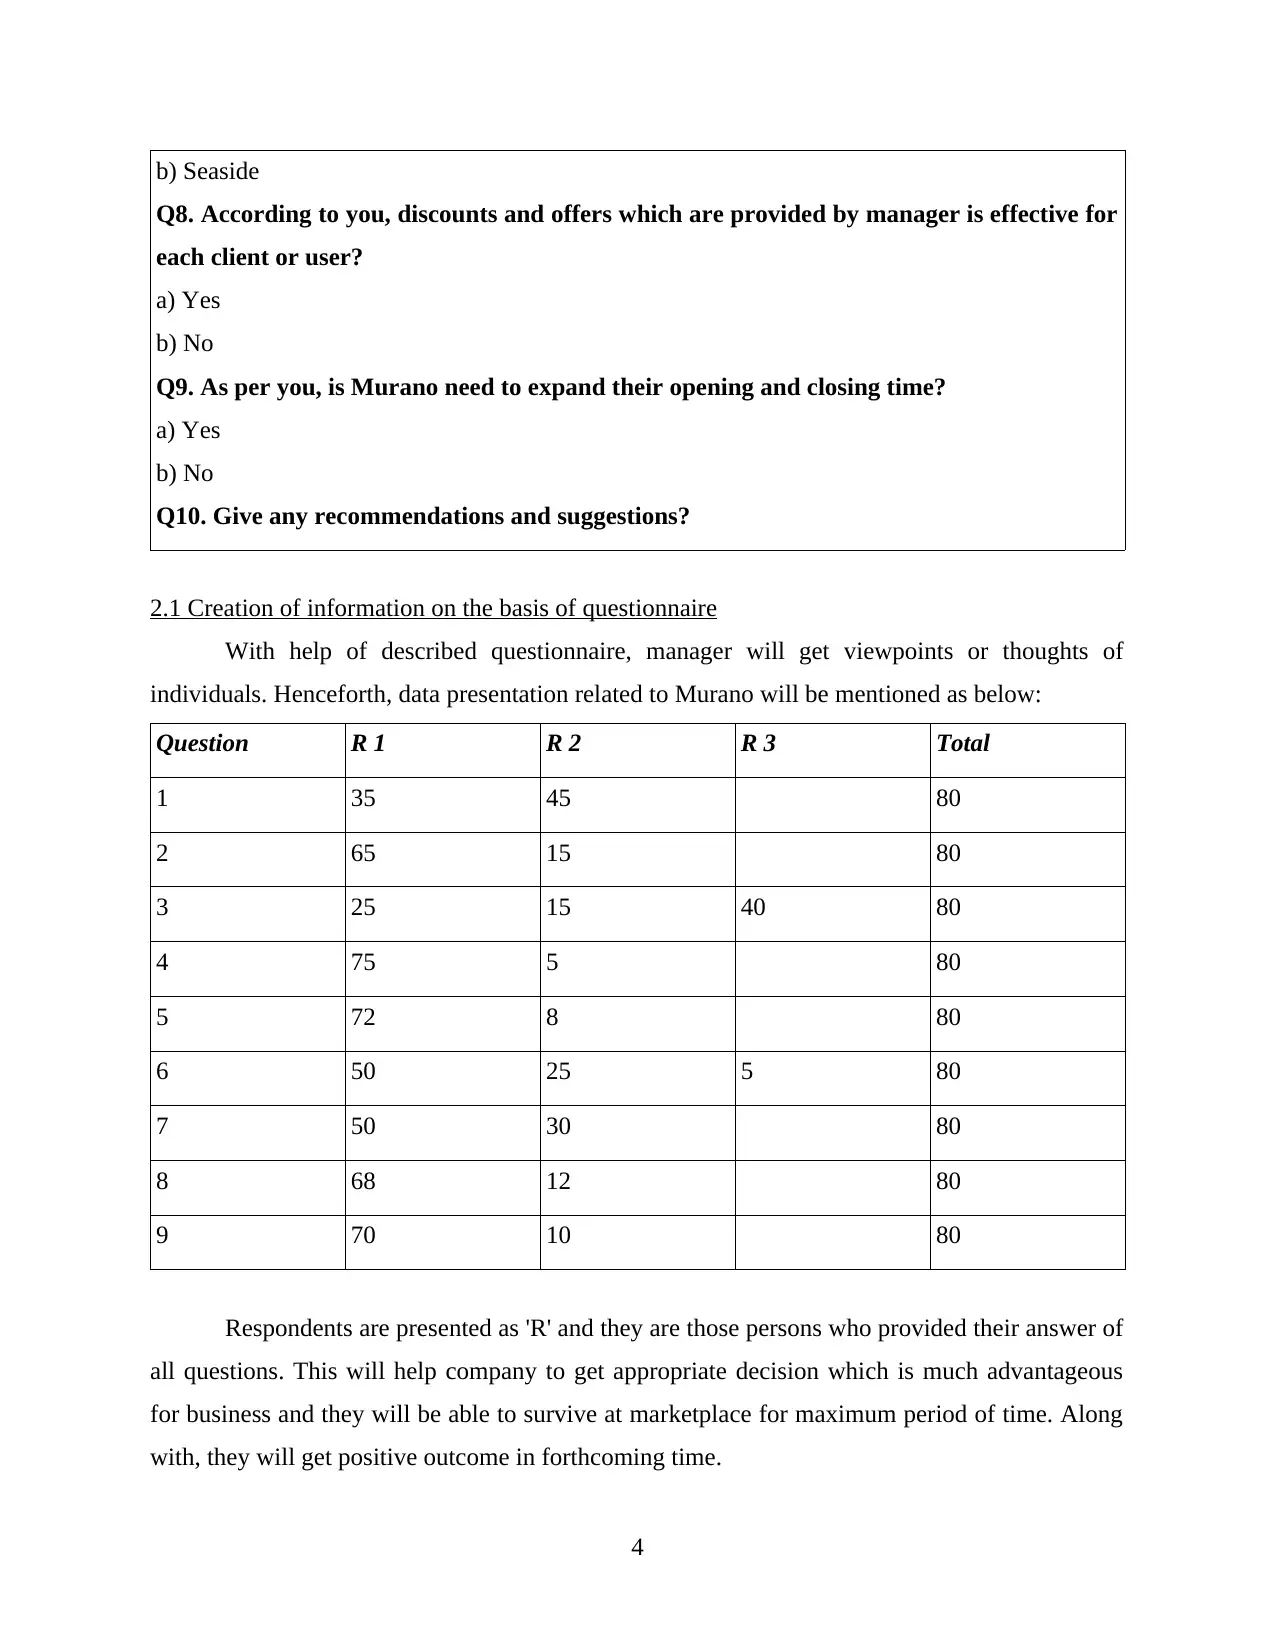
b) Seaside
Q8. According to you, discounts and offers which are provided by manager is effective for
each client or user?
a) Yes
b) No
Q9. As per you, is Murano need to expand their opening and closing time?
a) Yes
b) No
Q10. Give any recommendations and suggestions?
2.1 Creation of information on the basis of questionnaire
With help of described questionnaire, manager will get viewpoints or thoughts of
individuals. Henceforth, data presentation related to Murano will be mentioned as below:
Question R 1 R 2 R 3 Total
1 35 45 80
2 65 15 80
3 25 15 40 80
4 75 5 80
5 72 8 80
6 50 25 5 80
7 50 30 80
8 68 12 80
9 70 10 80
Respondents are presented as 'R' and they are those persons who provided their answer of
all questions. This will help company to get appropriate decision which is much advantageous
for business and they will be able to survive at marketplace for maximum period of time. Along
with, they will get positive outcome in forthcoming time.
4
⊘ This is a preview!⊘
Do you want full access?
Subscribe today to unlock all pages.
Trusted by 1+ million students worldwide
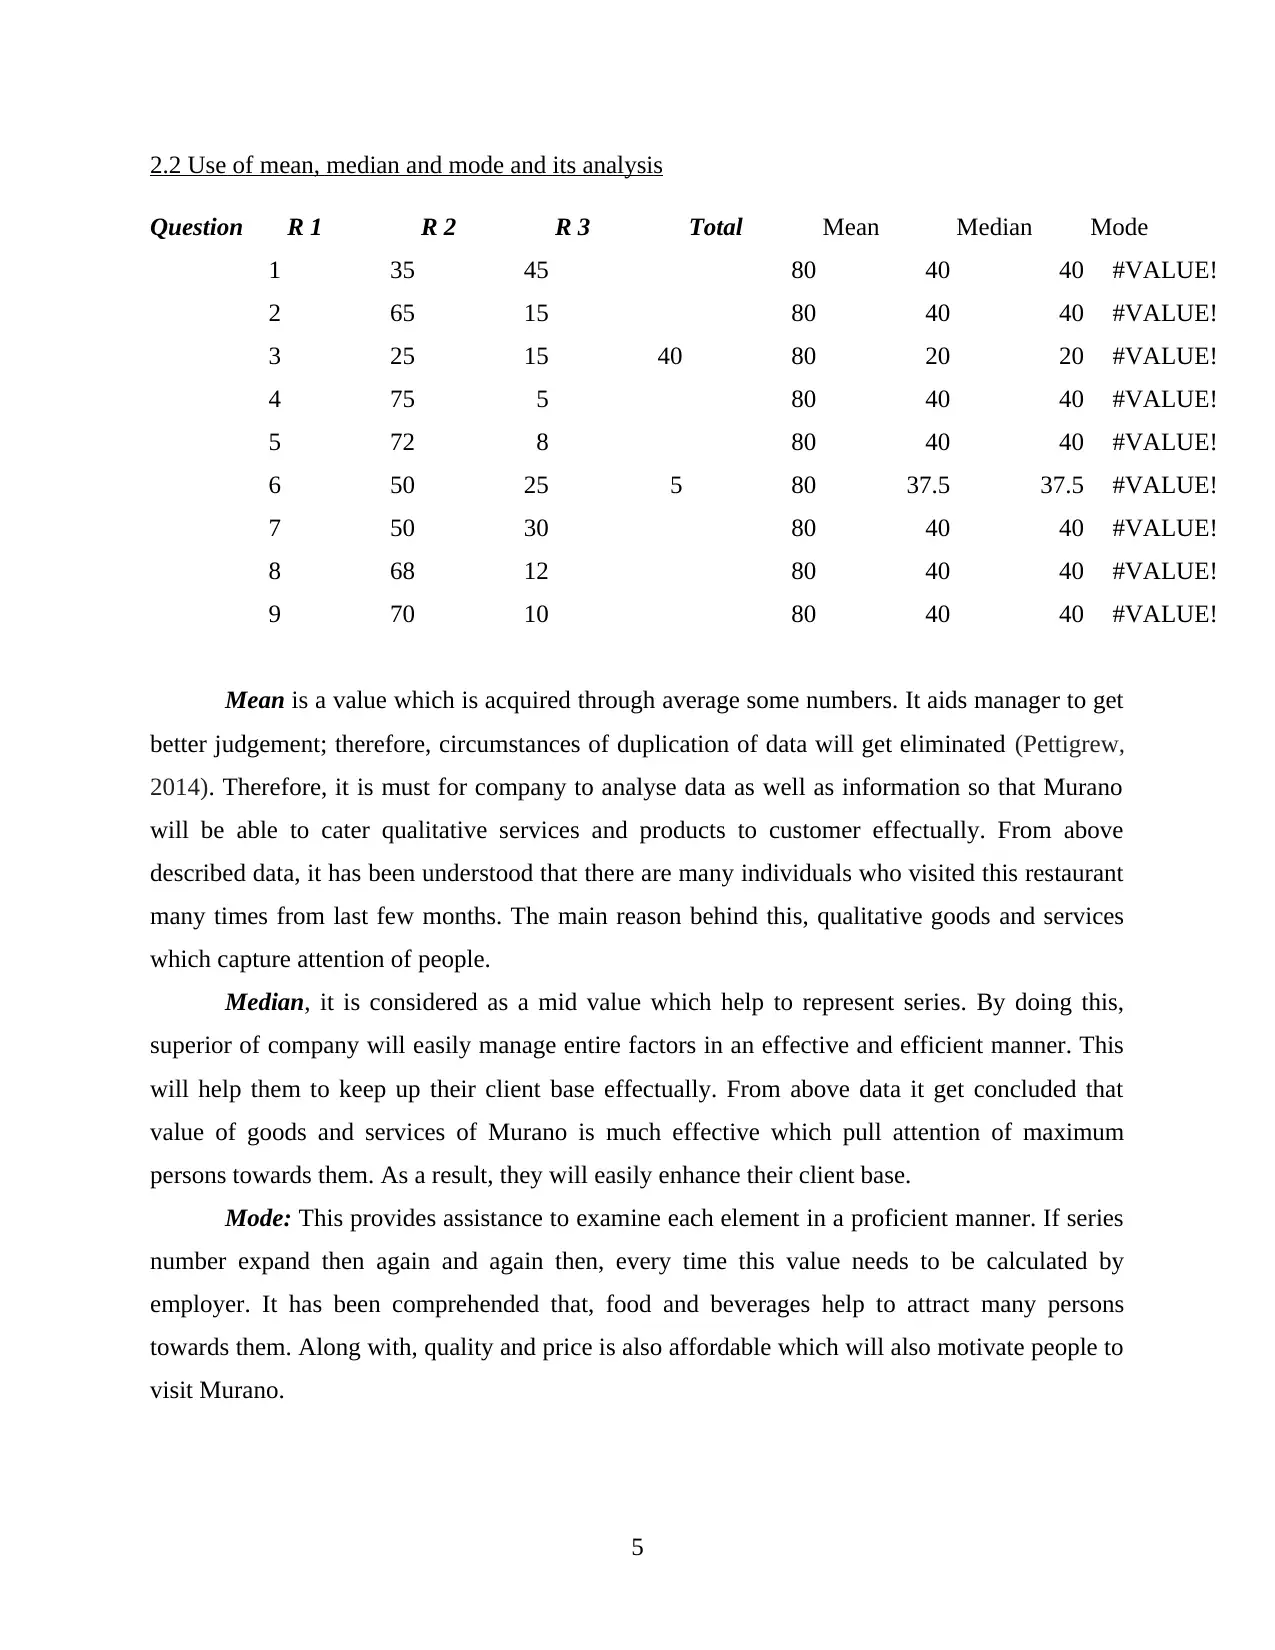
2.2 Use of mean, median and mode and its analysis
Question R 1 R 2 R 3 Total Mean Median Mode
1 35 45 80 40 40 #VALUE!
2 65 15 80 40 40 #VALUE!
3 25 15 40 80 20 20 #VALUE!
4 75 5 80 40 40 #VALUE!
5 72 8 80 40 40 #VALUE!
6 50 25 5 80 37.5 37.5 #VALUE!
7 50 30 80 40 40 #VALUE!
8 68 12 80 40 40 #VALUE!
9 70 10 80 40 40 #VALUE!
Mean is a value which is acquired through average some numbers. It aids manager to get
better judgement; therefore, circumstances of duplication of data will get eliminated (Pettigrew,
2014). Therefore, it is must for company to analyse data as well as information so that Murano
will be able to cater qualitative services and products to customer effectually. From above
described data, it has been understood that there are many individuals who visited this restaurant
many times from last few months. The main reason behind this, qualitative goods and services
which capture attention of people.
Median, it is considered as a mid value which help to represent series. By doing this,
superior of company will easily manage entire factors in an effective and efficient manner. This
will help them to keep up their client base effectually. From above data it get concluded that
value of goods and services of Murano is much effective which pull attention of maximum
persons towards them. As a result, they will easily enhance their client base.
Mode: This provides assistance to examine each element in a proficient manner. If series
number expand then again and again then, every time this value needs to be calculated by
employer. It has been comprehended that, food and beverages help to attract many persons
towards them. Along with, quality and price is also affordable which will also motivate people to
visit Murano.
5
Paraphrase This Document
Need a fresh take? Get an instant paraphrase of this document with our AI Paraphraser
2.3 Analysis of data using measure of dispersion with including standard deviation
Question R 1 R 2 R 3 Total Variance
Standard
deviation
1 35 45 80 50
7.07106781
19
2 65 15 80 1250
35.3553390
593
3 25 15 40 80 50
7.07106781
19
4 75 5 80 2450
49.4974746
831
5 72 8 80 2048
45.2548339
959
6 50 25 5 80 312.5
17.6776695
297
7 50 30 80 200
14.1421356
237
8 68 12 80 1568
39.5979797
464
9 70 10 80 1800
42.4264068
712
Variances: This will include overall variations as well as differences which will develop
at the time of distribution of frequency table. This will cater huge affect on relationship amongst
more than two elements or variables. Along with, it will provide influence to decision making
process of Murano. From above data it has been analysed that there are many people who
provide positive perspective to the company which assist them to improve brand image at
marketplace. Additionally, they will easily take benefits from their rivals at competitive world.
Standard deviation: It portrays that how a manager of company will expand their data
and in addition describe distance amongst value of mean. This will be evaluated through
identifying variation amongst each point of data. From above data it has been comprehended that
6
there are many individuals who are satisfied with the products and services of company.
Therefore, they will visit Murano many times.
2.4 Benefits of quartile, percentile and correlation coefficient in business context
Question R 1 R 2 R 3 Total
Correlation
coefficient
1 35 45 80 -1
2 65 15 80
3 25 15 40 80
-
0.54341298
33
4 75 5 80
5 72 8 80
6 50 25 5 80
7 50 30 80
8 68 12 80 1
9 70 10 80
Rather than this, there are many values which will be examined and must have to
comprehend by manager. There they will take aid of two methods which are defined as beneath:
Correlation coefficient: This is considered as a number of series which define relation
amongst two or many variables; therefore, they will promote an effective work. A perfect
correlation is when it lays between 1 and -1. if it is more or less then, this will affect distribution
of frequency in an adverse manner. Murano is providing many types of offers and discounts to
customers which presents positive relations.
Quartile: With assistance of this, population will be classified into some proportionate;
thus, they will motivate working of employees. It assists to develop better understanding and in
addition aid to take an effective decision (Rosemann and vom Brocke, 2015).
TASK 2
3.1 Preparation of charts, graphs in making a valid conclusion
Theme 1: Many clients visited Murano many time in last six months
7
⊘ This is a preview!⊘
Do you want full access?
Subscribe today to unlock all pages.
Trusted by 1+ million students worldwide
0.8 1 1.2 1.4 1.6 1.8 2 2.2
0
0.5
1
1.5
2
2.5
0
0.5
1
1.5
2
2.5
35
45
Column B
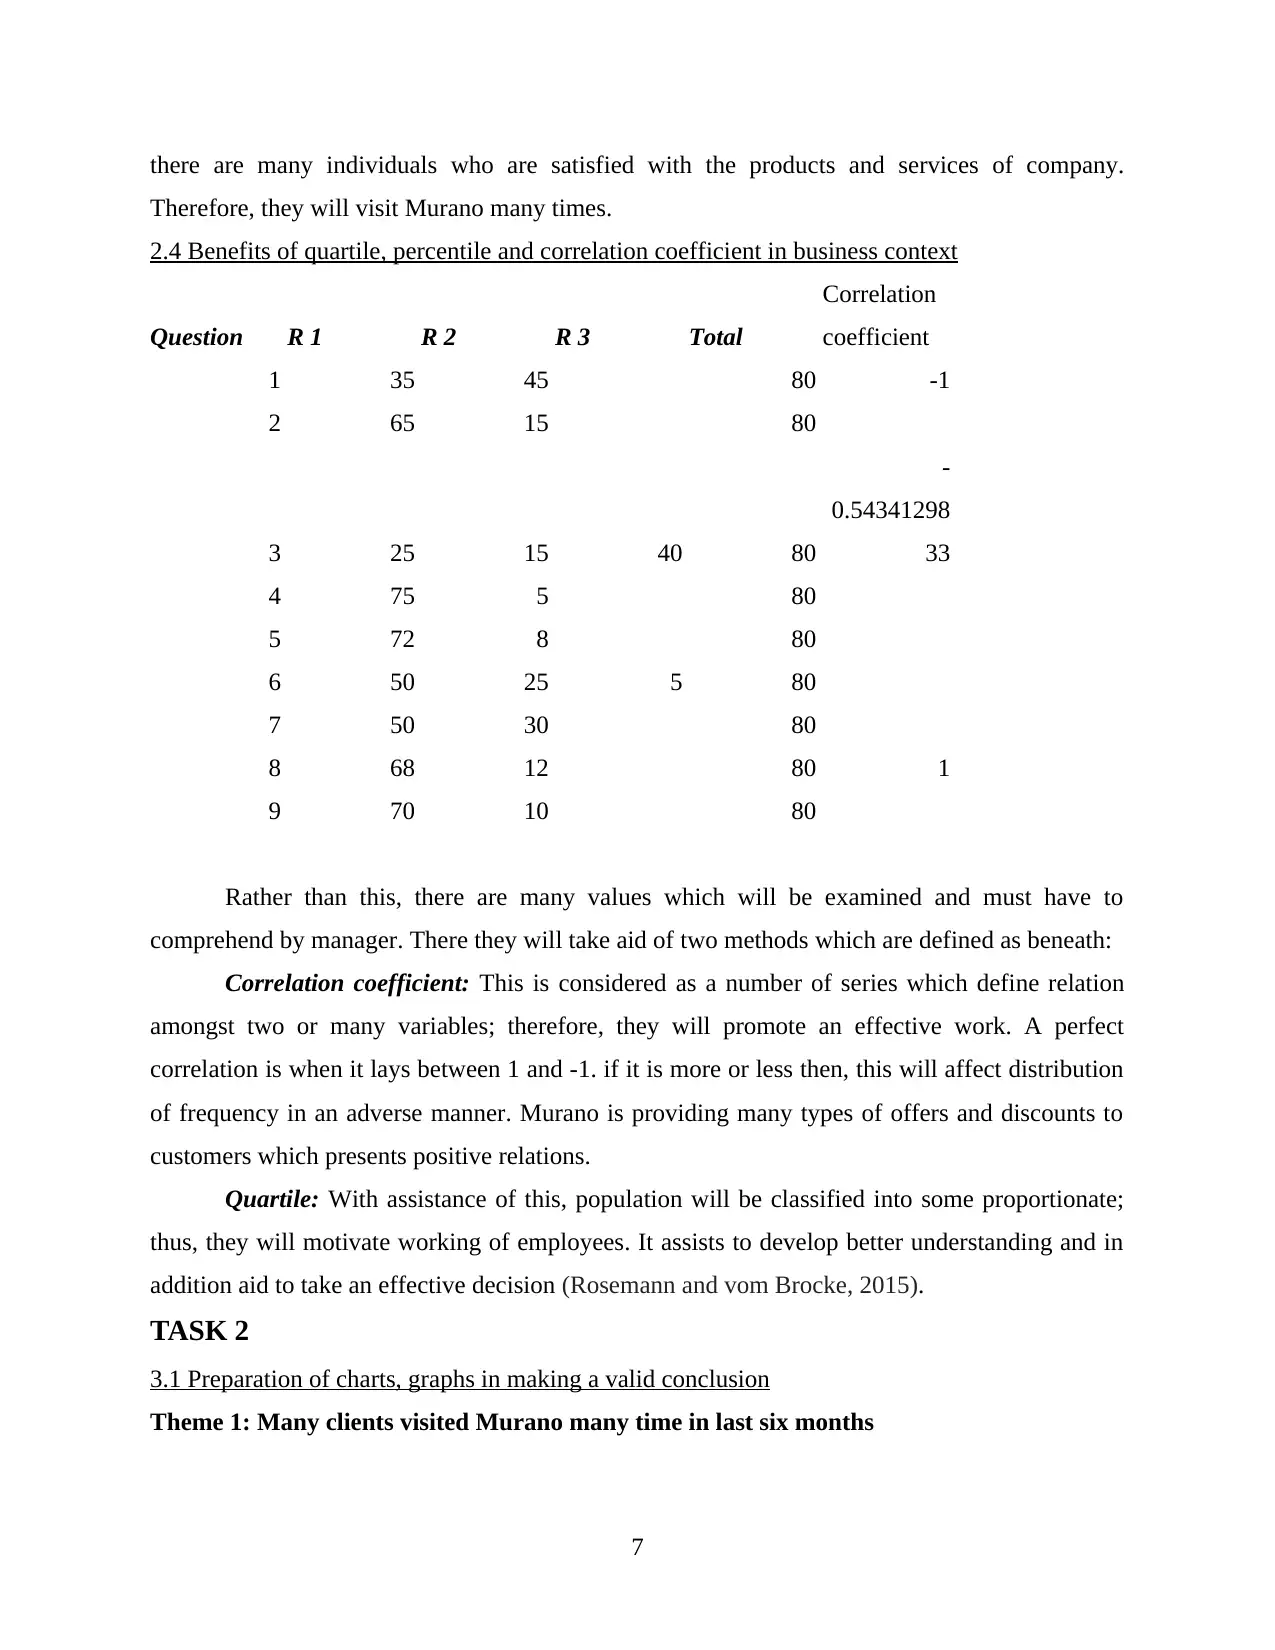
Interpretation: Murano is much famous restaurant which is situated in London. This place is
located near to mall which aid to pull attention of many individuals towards them so that visitors
gathering is in large number over there. As indicated by above presented graph, it has been
comprehended that there are almost 35 respondents who visited restaurant less than 4 times, but
remaining individuals visited this place more than 4 times in past few months.
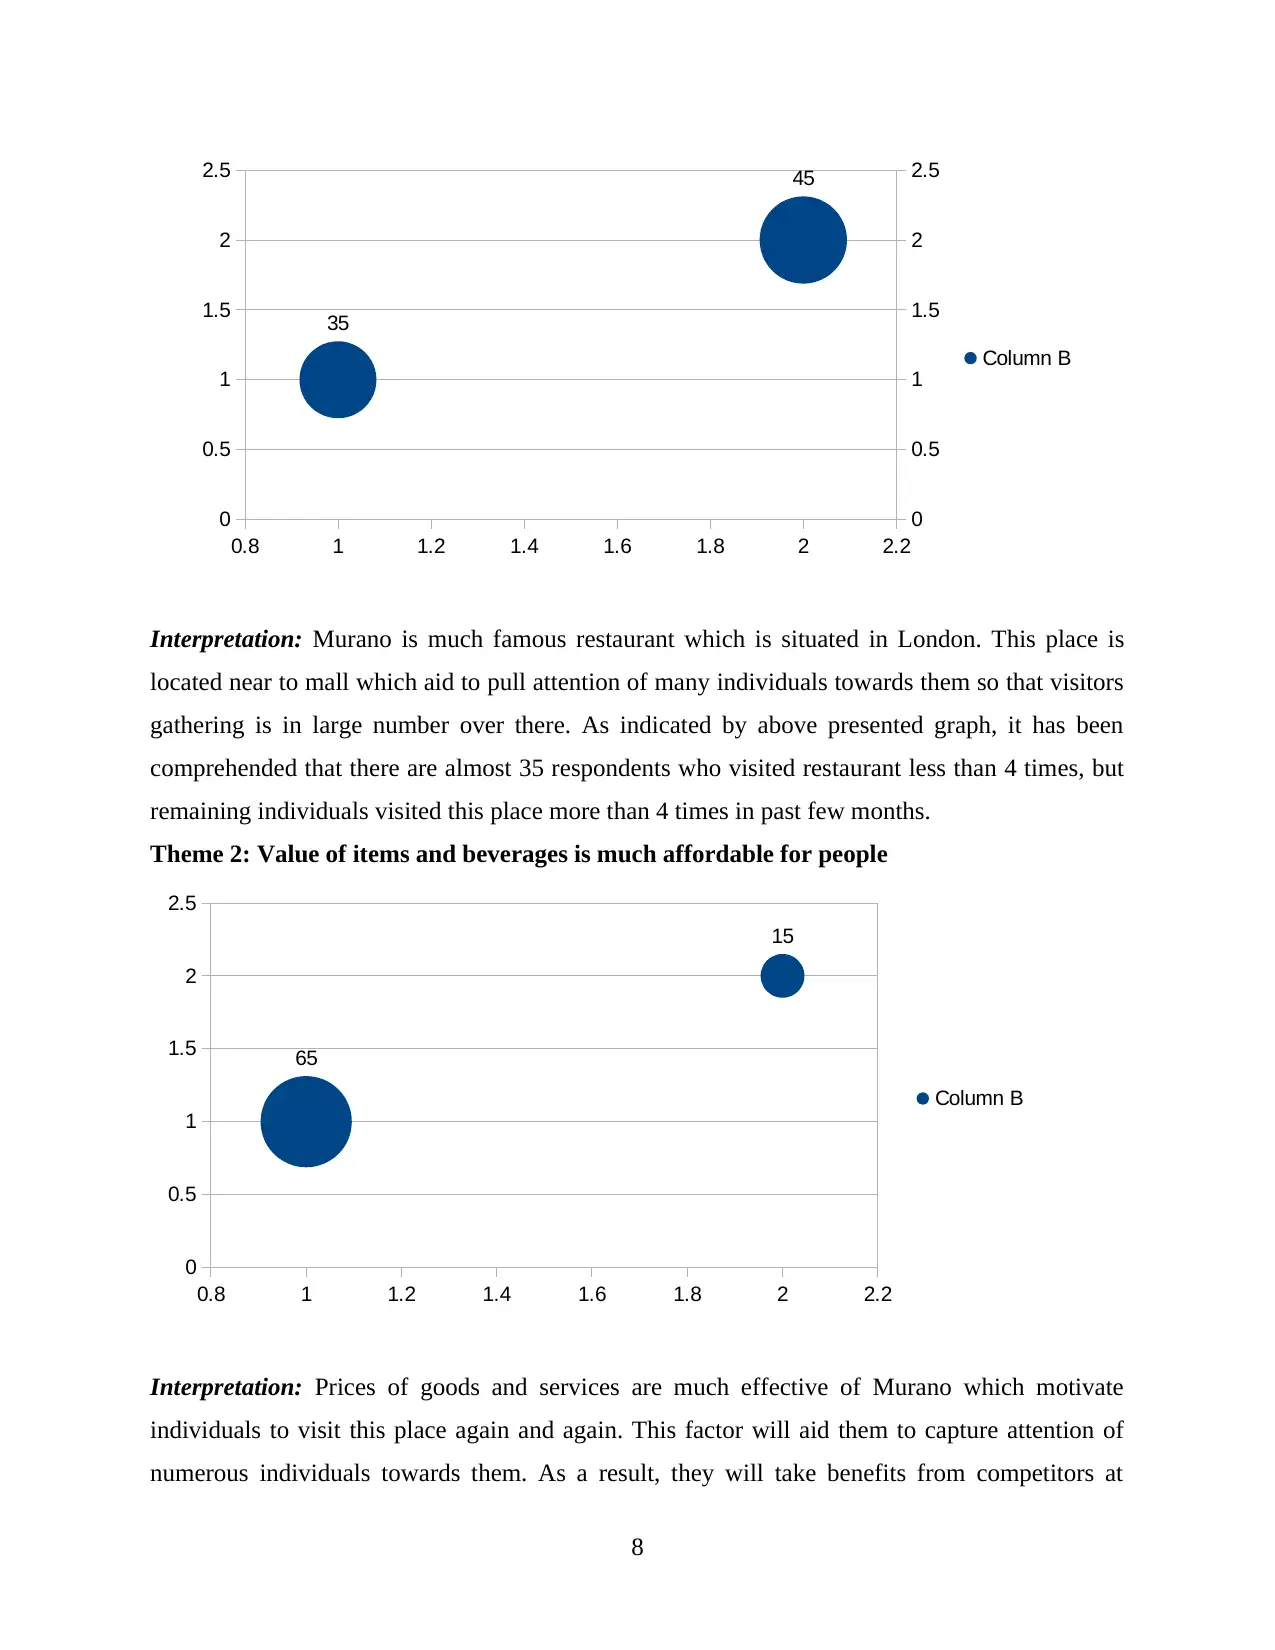
Theme 2: Value of items and beverages is much affordable for people
0.8 1 1.2 1.4 1.6 1.8 2 2.2
0
0.5
1
1.5
2
2.5
65
15
Column B
Interpretation: Prices of goods and services are much effective of Murano which motivate
individuals to visit this place again and again. This factor will aid them to capture attention of
numerous individuals towards them. As a result, they will take benefits from competitors at
8
0
0.5
1
1.5
2
2.5
0
0.5
1
1.5
2
2.5
35
45
Column B
Interpretation: Murano is much famous restaurant which is situated in London. This place is
located near to mall which aid to pull attention of many individuals towards them so that visitors
gathering is in large number over there. As indicated by above presented graph, it has been
comprehended that there are almost 35 respondents who visited restaurant less than 4 times, but
remaining individuals visited this place more than 4 times in past few months.
Theme 2: Value of items and beverages is much affordable for people
0.8 1 1.2 1.4 1.6 1.8 2 2.2
0
0.5
1
1.5
2
2.5
65
15
Column B
Interpretation: Prices of goods and services are much effective of Murano which motivate
individuals to visit this place again and again. This factor will aid them to capture attention of
numerous individuals towards them. As a result, they will take benefits from competitors at
8
Paraphrase This Document
Need a fresh take? Get an instant paraphrase of this document with our AI Paraphraser
marketplace. From above graph, it has been understood that almost 65 people are favouring this
statement but remaining are not in favour of this.
Theme 3: Food and beverages of restaurant will aid to gain attention of many people
0.5 1 1.5 2 2.5 3 3.5
0
0.5
1
1.5
2
2.5
3
3.5
25
15
40
Column B
Interpretation: Murano is much popular place which is situated in London. Food and beverages,
ambience and location is much appropriate which aid to capture attention of many people
towards them. This will assist them to improve their market share and reputation of company.
From above presented graph, it has been understood that almost 25 respondents attract towards
restaurant because of their location and approximately 15 individuals visit this place due to
ambience. Remaining persons get attracted because of their quality of food and beverages.
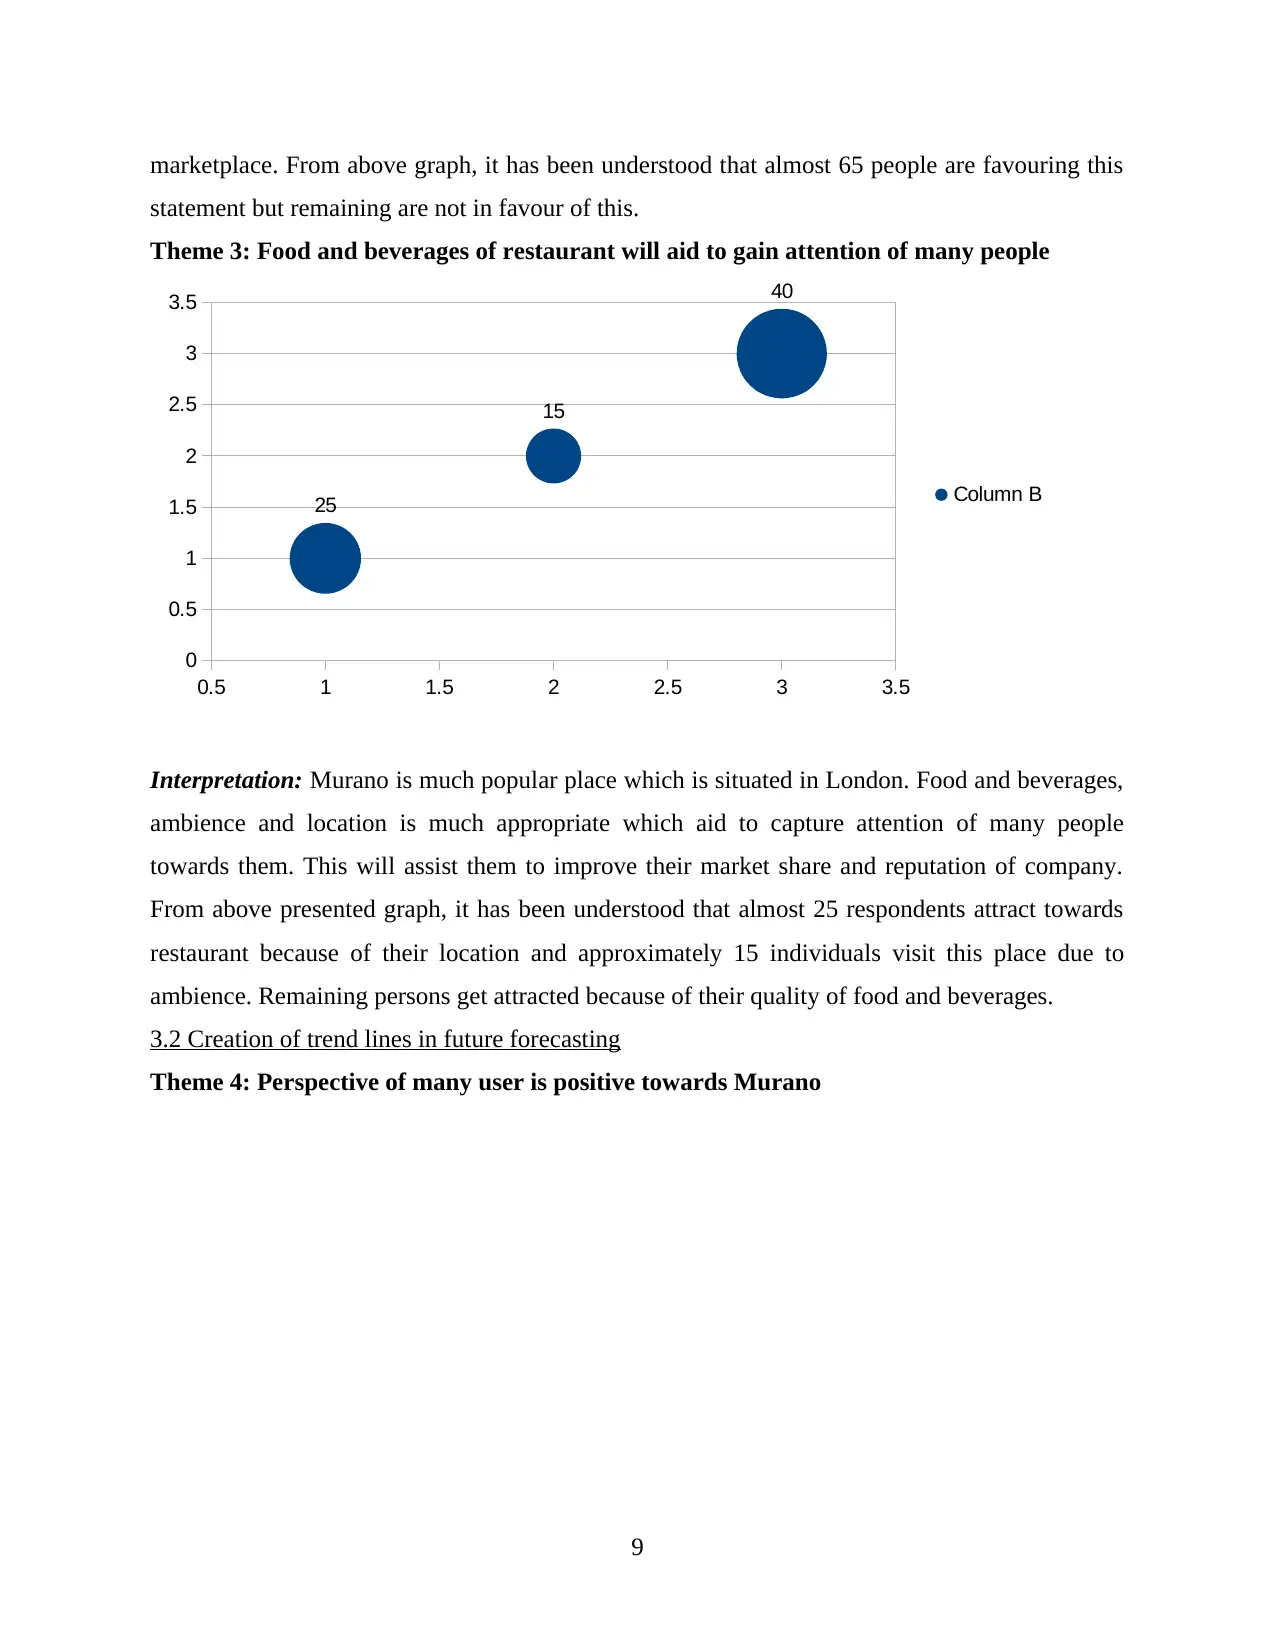
3.2 Creation of trend lines in future forecasting
Theme 4: Perspective of many user is positive towards Murano
9
statement but remaining are not in favour of this.
Theme 3: Food and beverages of restaurant will aid to gain attention of many people
0.5 1 1.5 2 2.5 3 3.5
0
0.5
1
1.5
2
2.5
3
3.5
25
15
40
Column B
Interpretation: Murano is much popular place which is situated in London. Food and beverages,
ambience and location is much appropriate which aid to capture attention of many people
towards them. This will assist them to improve their market share and reputation of company.
From above presented graph, it has been understood that almost 25 respondents attract towards
restaurant because of their location and approximately 15 individuals visit this place due to
ambience. Remaining persons get attracted because of their quality of food and beverages.
3.2 Creation of trend lines in future forecasting
Theme 4: Perspective of many user is positive towards Murano
9
Positive Negative
0
10
20
30
40
50
60
70
80 75
5
Column B
Linear (Column B)
Interpretation: As per the viewpoint of many people they are positive towards Murano. The
main reason behind it, that their quality of goods and services which is much effective as
compare to their contenders. From above presented trend line, it get comprehended that almost
75 individuals are favouring this argument but remaining are negative with this perspective.
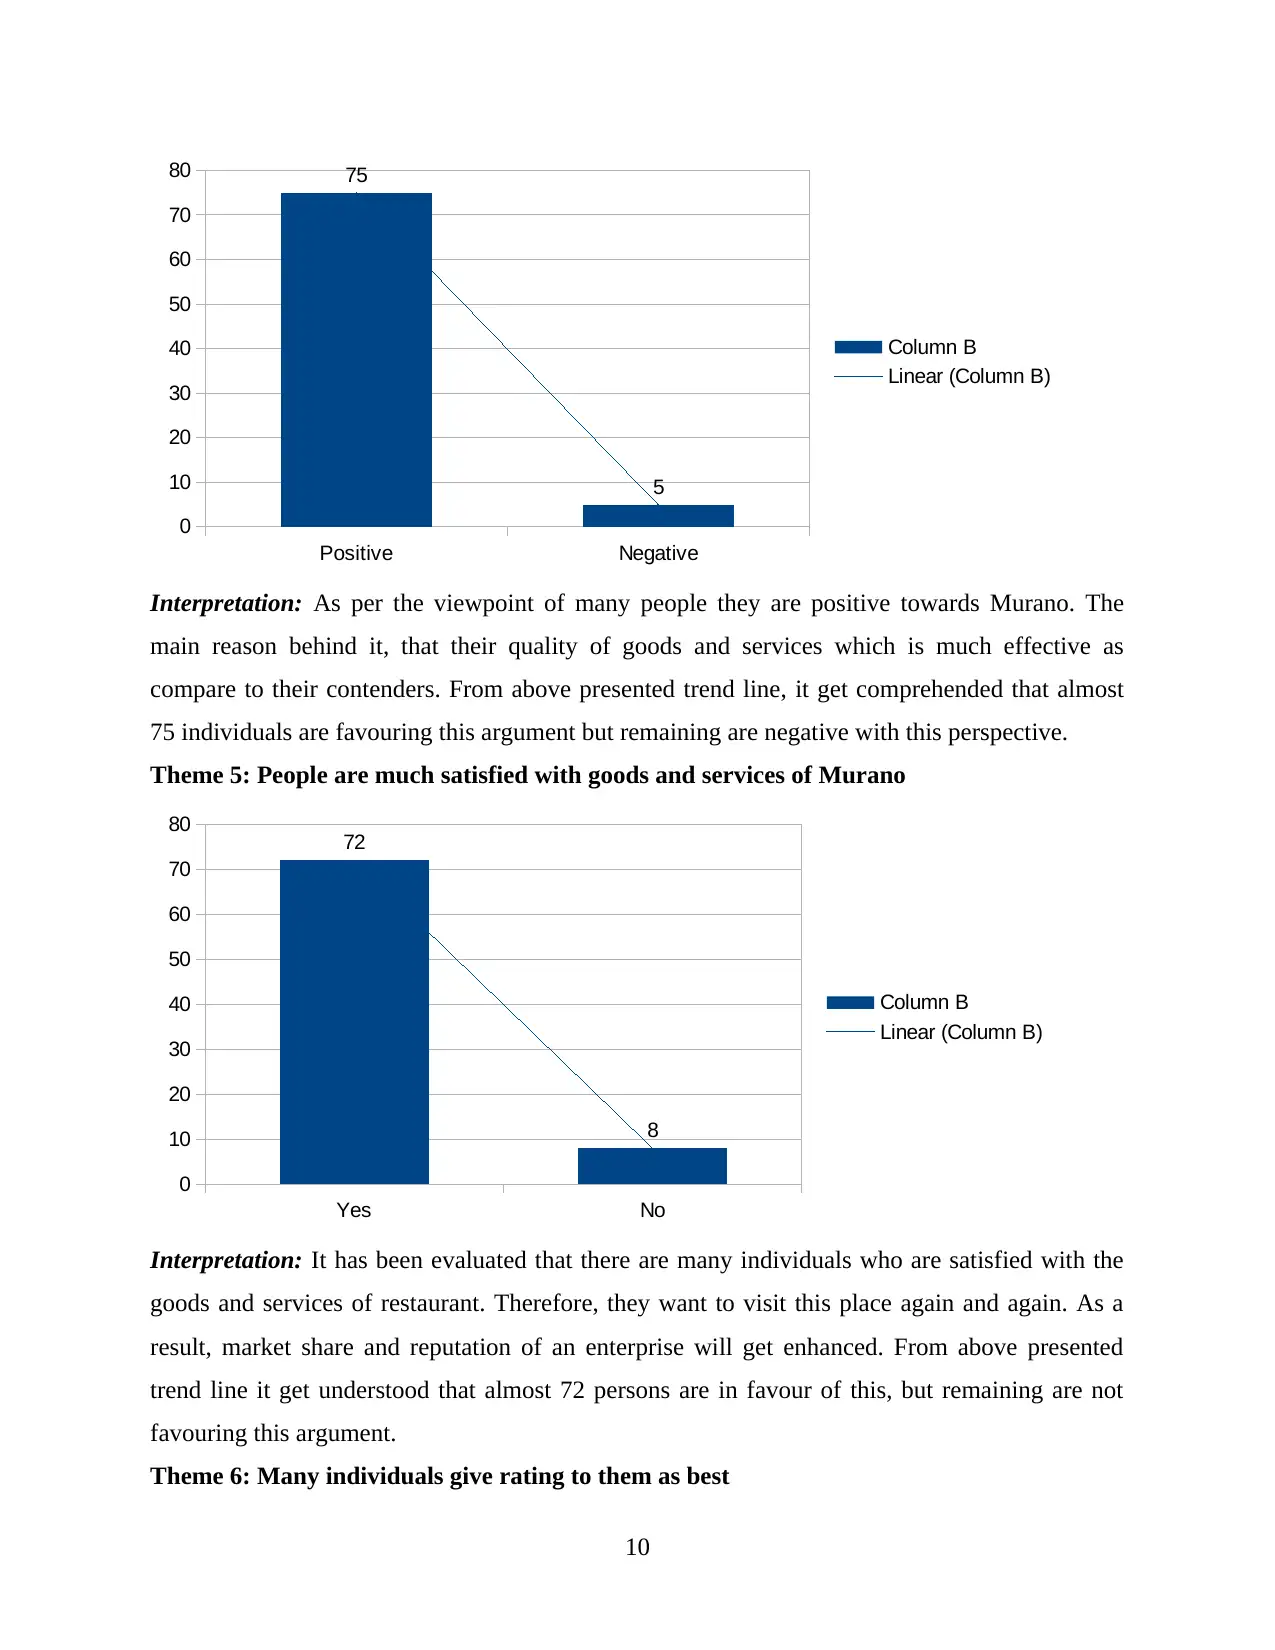
Theme 5: People are much satisfied with goods and services of Murano
Yes No
0
10
20
30
40
50
60
70
80 72
8
Column B
Linear (Column B)
Interpretation: It has been evaluated that there are many individuals who are satisfied with the
goods and services of restaurant. Therefore, they want to visit this place again and again. As a
result, market share and reputation of an enterprise will get enhanced. From above presented
trend line it get understood that almost 72 persons are in favour of this, but remaining are not
favouring this argument.
Theme 6: Many individuals give rating to them as best
10
0
10
20
30
40
50
60
70
80 75
5
Column B
Linear (Column B)
Interpretation: As per the viewpoint of many people they are positive towards Murano. The
main reason behind it, that their quality of goods and services which is much effective as
compare to their contenders. From above presented trend line, it get comprehended that almost
75 individuals are favouring this argument but remaining are negative with this perspective.
Theme 5: People are much satisfied with goods and services of Murano
Yes No
0
10
20
30
40
50
60
70
80 72
8
Column B
Linear (Column B)
Interpretation: It has been evaluated that there are many individuals who are satisfied with the
goods and services of restaurant. Therefore, they want to visit this place again and again. As a
result, market share and reputation of an enterprise will get enhanced. From above presented
trend line it get understood that almost 72 persons are in favour of this, but remaining are not
favouring this argument.
Theme 6: Many individuals give rating to them as best
10
⊘ This is a preview!⊘
Do you want full access?
Subscribe today to unlock all pages.
Trusted by 1+ million students worldwide
1 out of 18
Related Documents


Your All-in-One AI-Powered Toolkit for Academic Success.
+13062052269
info@desklib.com
Available 24*7 on WhatsApp / Email
![[object Object]](/_next/static/media/star-bottom.7253800d.svg)
Unlock your academic potential
Copyright © 2020–2026 A2Z Services. All Rights Reserved. Developed and managed by ZUCOL.