Business Decision Making Report: Evaluating Customer Responses
VerifiedAdded on 2020/07/22
|22
|5940
|295
Report
AI Summary
This report focuses on business decision-making for a restaurant, Food for Friends, planning to open a new outlet in London, UK. It details the creation of an action plan for data collection using primary and secondary sources, including questionnaires. The report analyzes data using statistical tools like mean, median, and mode to evaluate customer responses. Sampling techniques and questionnaire design are discussed, along with the creation of charts, graphs, and trend lines to present data effectively. The project also covers the use of information processing tools, critical path systems, and financial tools for decision-making, culminating in a formal business report and PowerPoint presentation.
Business Decision
Making
Making
Paraphrase This Document
Need a fresh take? Get an instant paraphrase of this document with our AI Paraphraser
TABLE OF CONTENTS
INTRODUCTION...........................................................................................................................1
TASK 1............................................................................................................................................1
1.1 Preparation of an action plan for collecting data through various sources.......................1
1.2 Use of sampling in relation to collecting information......................................................2
1.3 Questionnaire for gaining different aspects of business...................................................3
2.1 Creation of information on the basis of questionnaire.....................................................5
2.2 Use of mean, median and mode in decision making........................................................6
2.3 Use of measure of dispersion in taking beneficial judgement..........................................7
2.4 Quartile and correlation coefficient for decision taking purpose.....................................8
TASK 2............................................................................................................................................9
3.1 Use of graphs and charts on the basis of information......................................................9
3.2 Creation of trend line on the basis of information..........................................................11
3.3 PowerPoint presentation.................................................................................................13
3.4 Formal business report...................................................................................................13
TASK 3..........................................................................................................................................14
4.1 Information processing tool for analysing the data........................................................14
4.2 Determination of critical path system.............................................................................15
4.3 Financial tools usage for decision taking.......................................................................17
CONCLUSION..............................................................................................................................18
REFERENCES..............................................................................................................................19
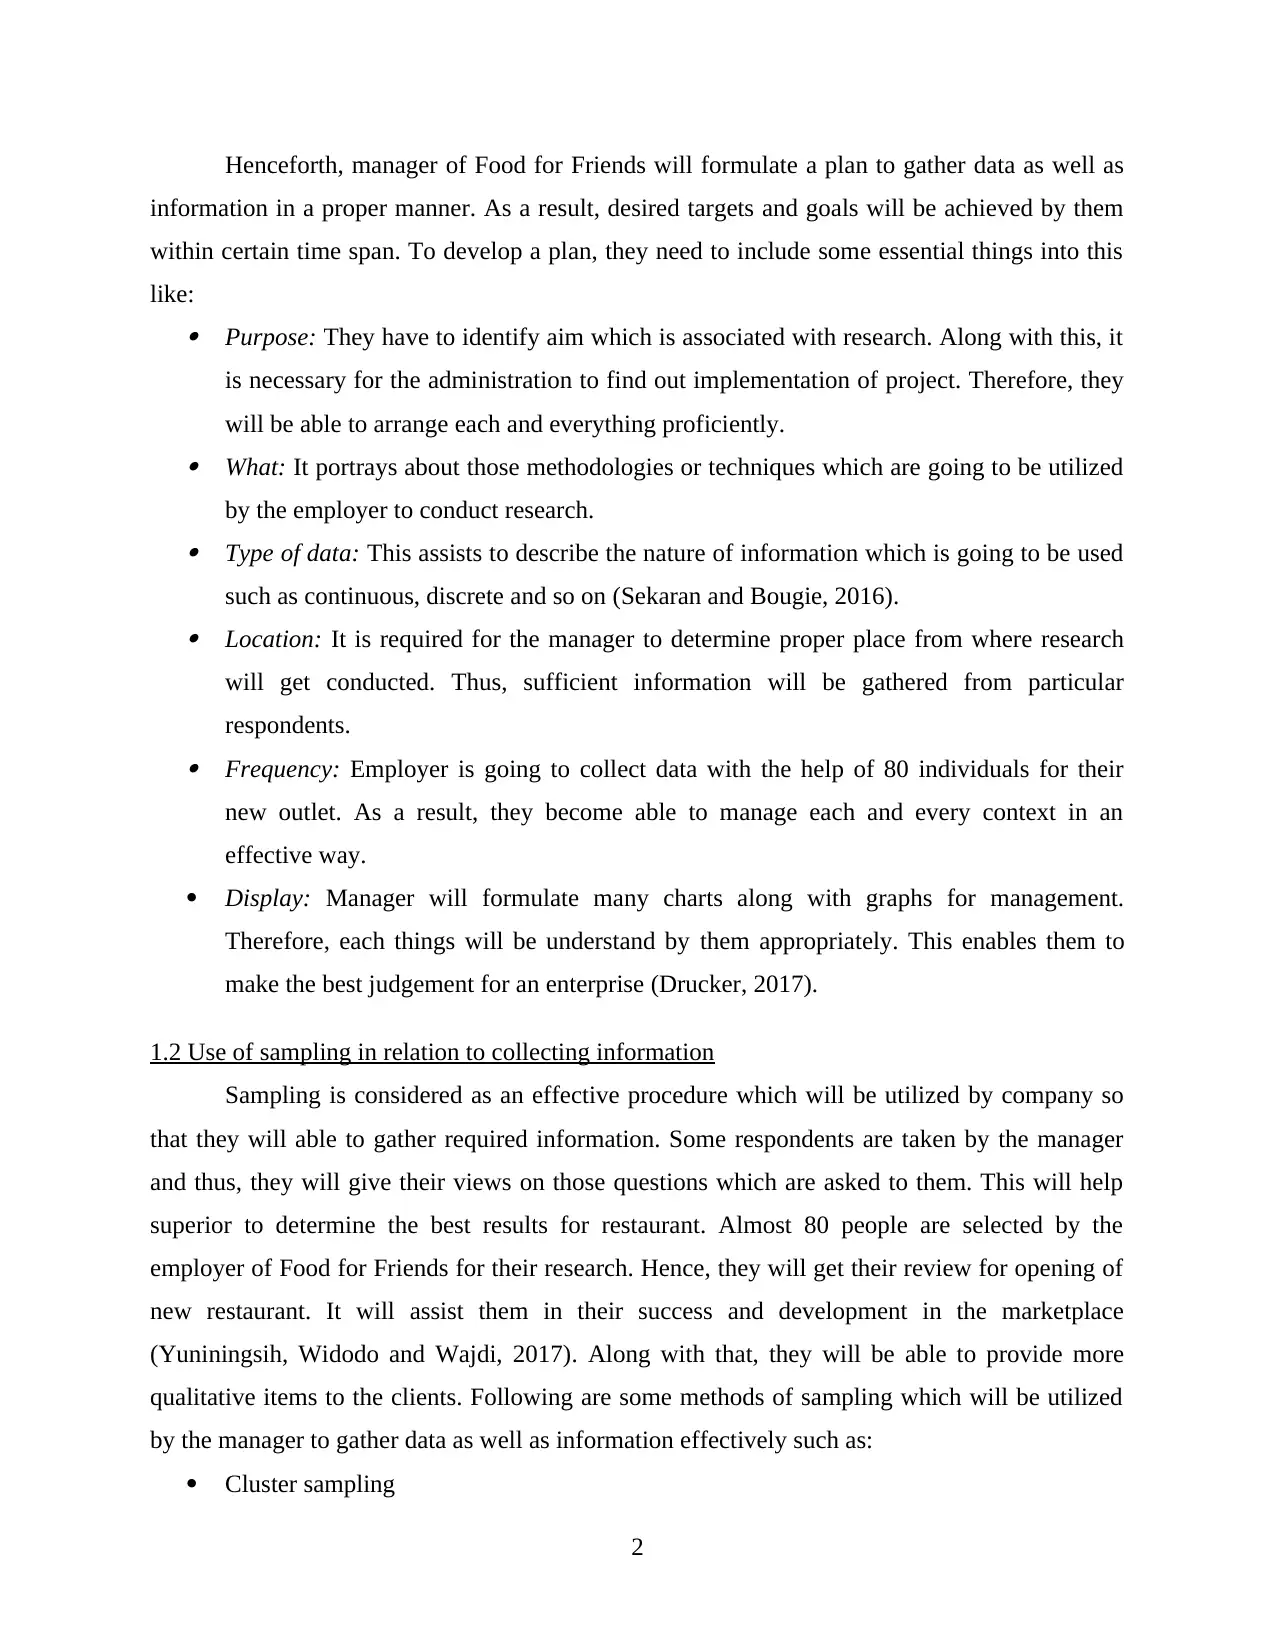
INTRODUCTION
For gaining success and growth in the future, business decision plays an important role. It
is significant for the senior management to make appropriate decisions which are highly
associated with business and its management so that better results and output could be
maintained (Rothman, 2017). This project is based on Food for Friends restaurant that wants to
open another outlet in London, UK for which they want to evaluate ultimate responses of their
customers. In such context, they organise a project with name of business decision making. This
project includes creation of plan for collecting primary and secondary data. Use of relevant
technique of survey by which management will become able to evaluate various aspects
effectively is also covered. On the basis of gathered responses, suitable outcomes are evaluated
properly by applying suitable tools and techniques. Moreover, graphs and charts are used so that
complete data will be disseminated properly. Use of software generated information in order to
evaluate feasibility if project is also highlighted here.
TASK 1
1.1 Preparation of an action plan for collecting data through various sources
To gather information in an appropriate manner, superiors will utilize data collection
methods. This aids them to attain coveted targets and objectives within limited period of time
(Thirumalai and Senthilkumar, 2017). Along with this, it is fundamental for the employer to
perform entire work in a systematic way. An action plan will be formulated by the manager to
accomplish goals within specific duration. For the above stated aim, management needs to work
on each target effectively as well as efficiently. Henceforth, methods of data collection will be
classified into two parts:
Primary data: As indicated by this, information is collected by the superior for first time.
This will be associated with some particular aim. This sort of data is much reliable and
adequate because it is related to the current period. It will help the organisation to take an
effective judgement for business in respect of future. There are some examples related to
it: questionnaire, interview and so on (Data Collection Plan, 2017).
Secondary data: This type of information will be gathered by superiors from various
sources such as internet, journal, newspaper, research paper and many others. It
consumes less time and fund, but reliability of this data is not very much (Drucker, 2017).
1
⊘ This is a preview!⊘
Do you want full access?
Subscribe today to unlock all pages.
Trusted by 1+ million students worldwide
Henceforth, manager of Food for Friends will formulate a plan to gather data as well as
information in a proper manner. As a result, desired targets and goals will be achieved by them
within certain time span. To develop a plan, they need to include some essential things into this
like: Purpose: They have to identify aim which is associated with research. Along with this, it
is necessary for the administration to find out implementation of project. Therefore, they
will be able to arrange each and everything proficiently. What: It portrays about those methodologies or techniques which are going to be utilized
by the employer to conduct research. Type of data: This assists to describe the nature of information which is going to be used
such as continuous, discrete and so on (Sekaran and Bougie, 2016). Location: It is required for the manager to determine proper place from where research
will get conducted. Thus, sufficient information will be gathered from particular
respondents. Frequency: Employer is going to collect data with the help of 80 individuals for their
new outlet. As a result, they become able to manage each and every context in an
effective way.
Display: Manager will formulate many charts along with graphs for management.
Therefore, each things will be understand by them appropriately. This enables them to
make the best judgement for an enterprise (Drucker, 2017).
1.2 Use of sampling in relation to collecting information
Sampling is considered as an effective procedure which will be utilized by company so
that they will able to gather required information. Some respondents are taken by the manager
and thus, they will give their views on those questions which are asked to them. This will help
superior to determine the best results for restaurant. Almost 80 people are selected by the
employer of Food for Friends for their research. Hence, they will get their review for opening of
new restaurant. It will assist them in their success and development in the marketplace
(Yuniningsih, Widodo and Wajdi, 2017). Along with that, they will be able to provide more
qualitative items to the clients. Following are some methods of sampling which will be utilized
by the manager to gather data as well as information effectively such as:
Cluster sampling
2
Paraphrase This Document
Need a fresh take? Get an instant paraphrase of this document with our AI Paraphraser
Random sampling
Strata sampling
Stratified sampling
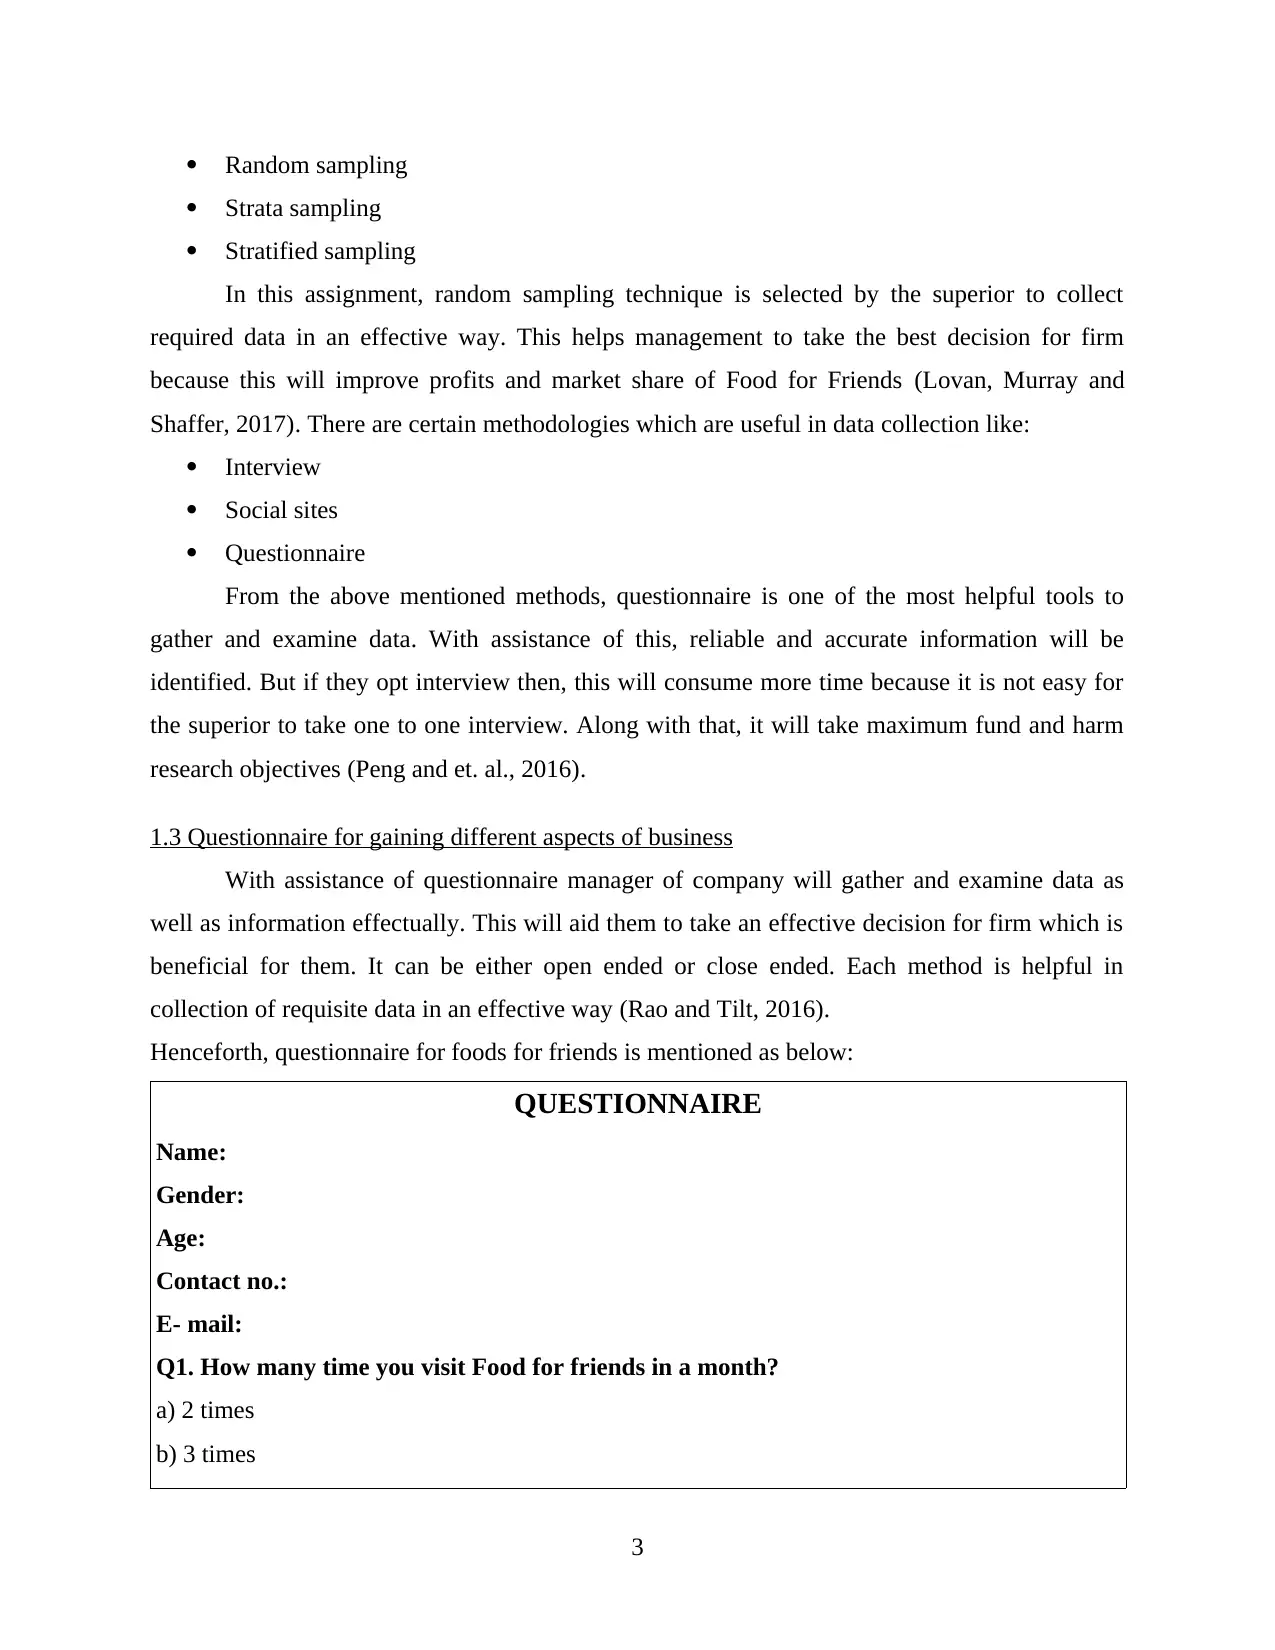
In this assignment, random sampling technique is selected by the superior to collect
required data in an effective way. This helps management to take the best decision for firm
because this will improve profits and market share of Food for Friends (Lovan, Murray and
Shaffer, 2017). There are certain methodologies which are useful in data collection like:
Interview
Social sites
Questionnaire
From the above mentioned methods, questionnaire is one of the most helpful tools to
gather and examine data. With assistance of this, reliable and accurate information will be
identified. But if they opt interview then, this will consume more time because it is not easy for
the superior to take one to one interview. Along with that, it will take maximum fund and harm
research objectives (Peng and et. al., 2016).
1.3 Questionnaire for gaining different aspects of business
With assistance of questionnaire manager of company will gather and examine data as
well as information effectually. This will aid them to take an effective decision for firm which is
beneficial for them. It can be either open ended or close ended. Each method is helpful in
collection of requisite data in an effective way (Rao and Tilt, 2016).
Henceforth, questionnaire for foods for friends is mentioned as below:
QUESTIONNAIRE
Name:
Gender:
Age:
Contact no.:
E- mail:
Q1. How many time you visit Food for friends in a month?
a) 2 times
b) 3 times
3
Strata sampling
Stratified sampling
In this assignment, random sampling technique is selected by the superior to collect
required data in an effective way. This helps management to take the best decision for firm
because this will improve profits and market share of Food for Friends (Lovan, Murray and
Shaffer, 2017). There are certain methodologies which are useful in data collection like:
Interview
Social sites
Questionnaire
From the above mentioned methods, questionnaire is one of the most helpful tools to
gather and examine data. With assistance of this, reliable and accurate information will be
identified. But if they opt interview then, this will consume more time because it is not easy for
the superior to take one to one interview. Along with that, it will take maximum fund and harm
research objectives (Peng and et. al., 2016).
1.3 Questionnaire for gaining different aspects of business
With assistance of questionnaire manager of company will gather and examine data as
well as information effectually. This will aid them to take an effective decision for firm which is
beneficial for them. It can be either open ended or close ended. Each method is helpful in
collection of requisite data in an effective way (Rao and Tilt, 2016).
Henceforth, questionnaire for foods for friends is mentioned as below:
QUESTIONNAIRE
Name:
Gender:
Age:
Contact no.:
E- mail:
Q1. How many time you visit Food for friends in a month?
a) 2 times
b) 3 times
3
c) once in a week
b) never
Q2. What kind of food you ordered over there?
a) Chinese
b) Italian
c) Mexican
Q3. Which element will attract attention of individual towards Food for friends?
a) Food quality
b) Interior
c) Discounts and other offers
Q4. What sort of additional entertainment you are expecting over there?
a) Pop music
b) Live music
c) Bar
d) Disc
Q5. From where you got to know about the restaurant?
a) Internet
b) Friends
c) Advertisement
d) Random
Q6. Do you satisfied with the services of restaurant?
a) Yes
b) No
Q7. How much the price element is significant for you?
a) Highly
b) Somewhat
c) Less
Q8. Do you attract towards special offers which is providing by Food for friends?
a) Yes
b) No
Q9. Do you prefer buffets system in restaurant?
4
⊘ This is a preview!⊘
Do you want full access?
Subscribe today to unlock all pages.
Trusted by 1+ million students worldwide
a) Yes
b) No
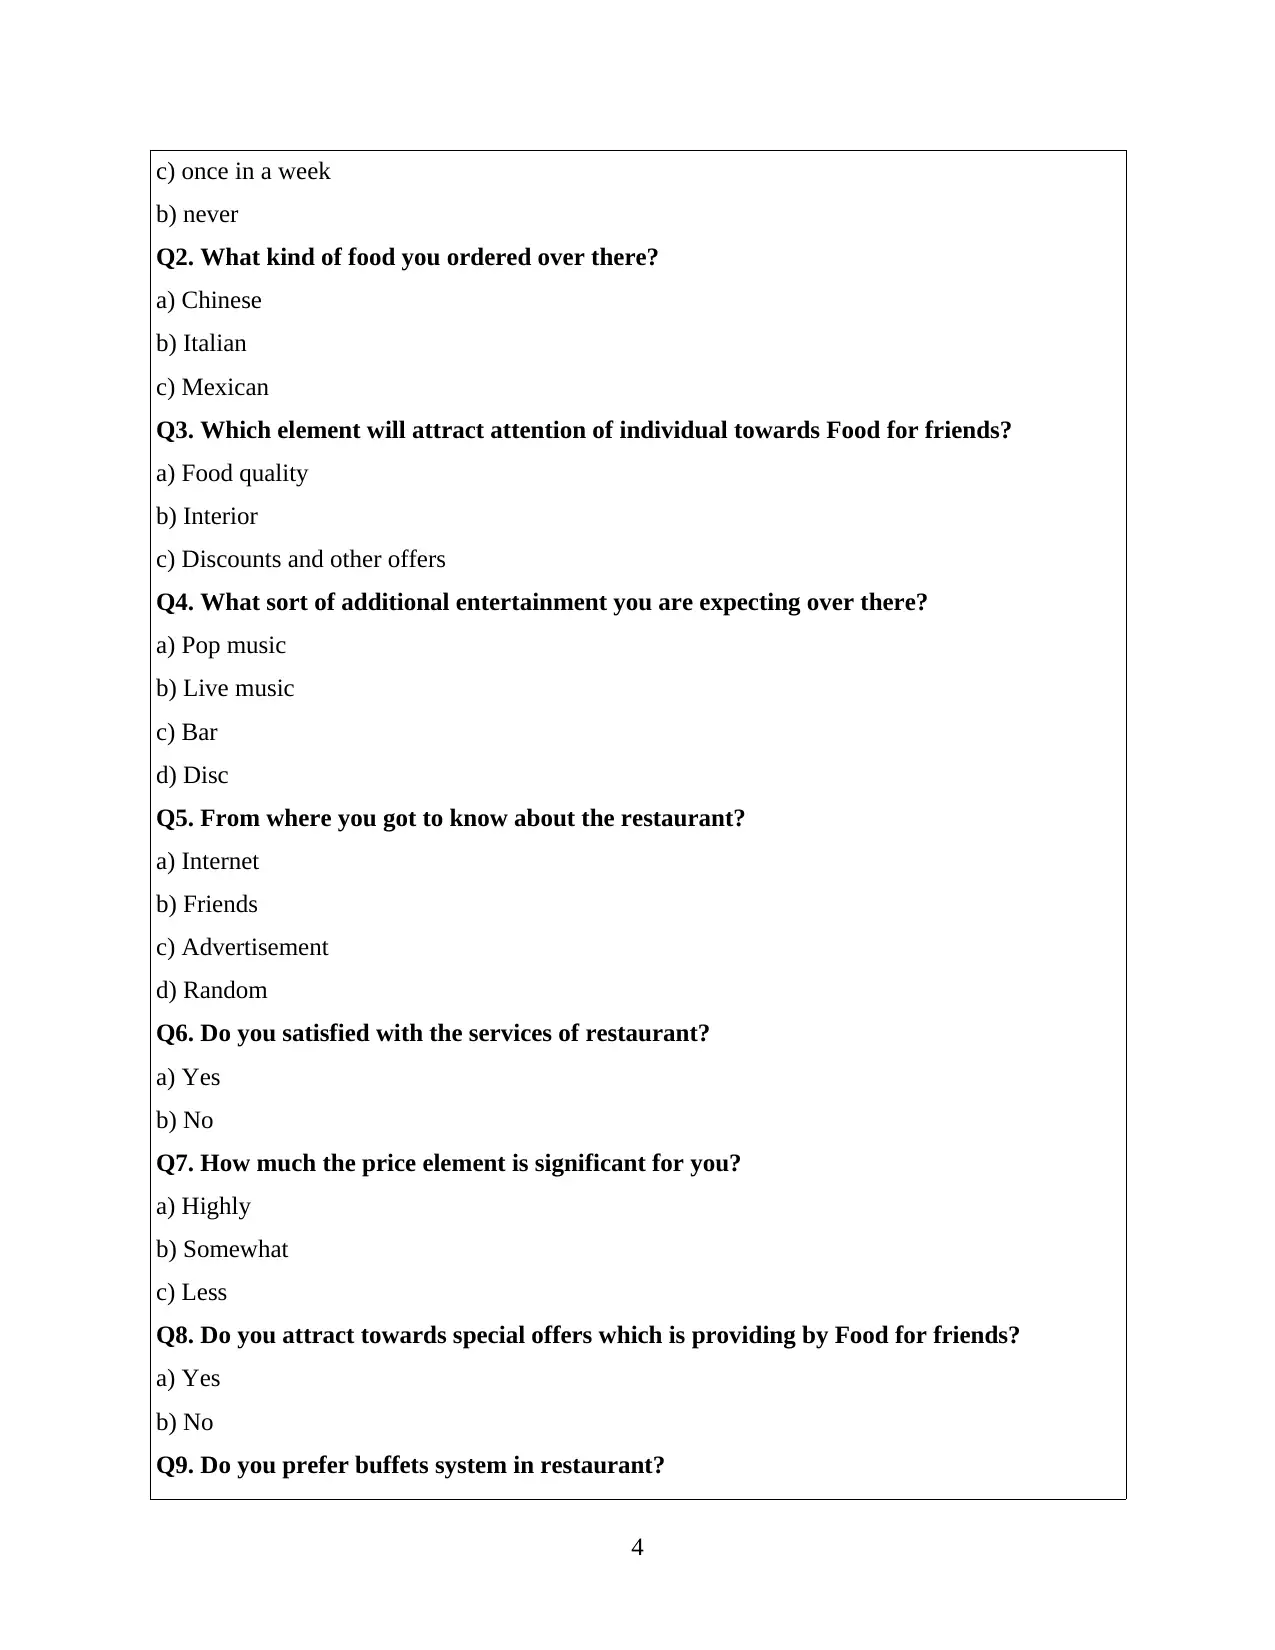
Q10. Do you want to provide any recommendations or suggestions?
With assistance of this, superior will gather data and information and in addition
determine interest and opinion of many respondents. This will help organisation to make
necessary alterations as per requirement. It will render success and advancement to enterprise
and in addition, they will formulate strategies for business accordingly (Morton, 2017).
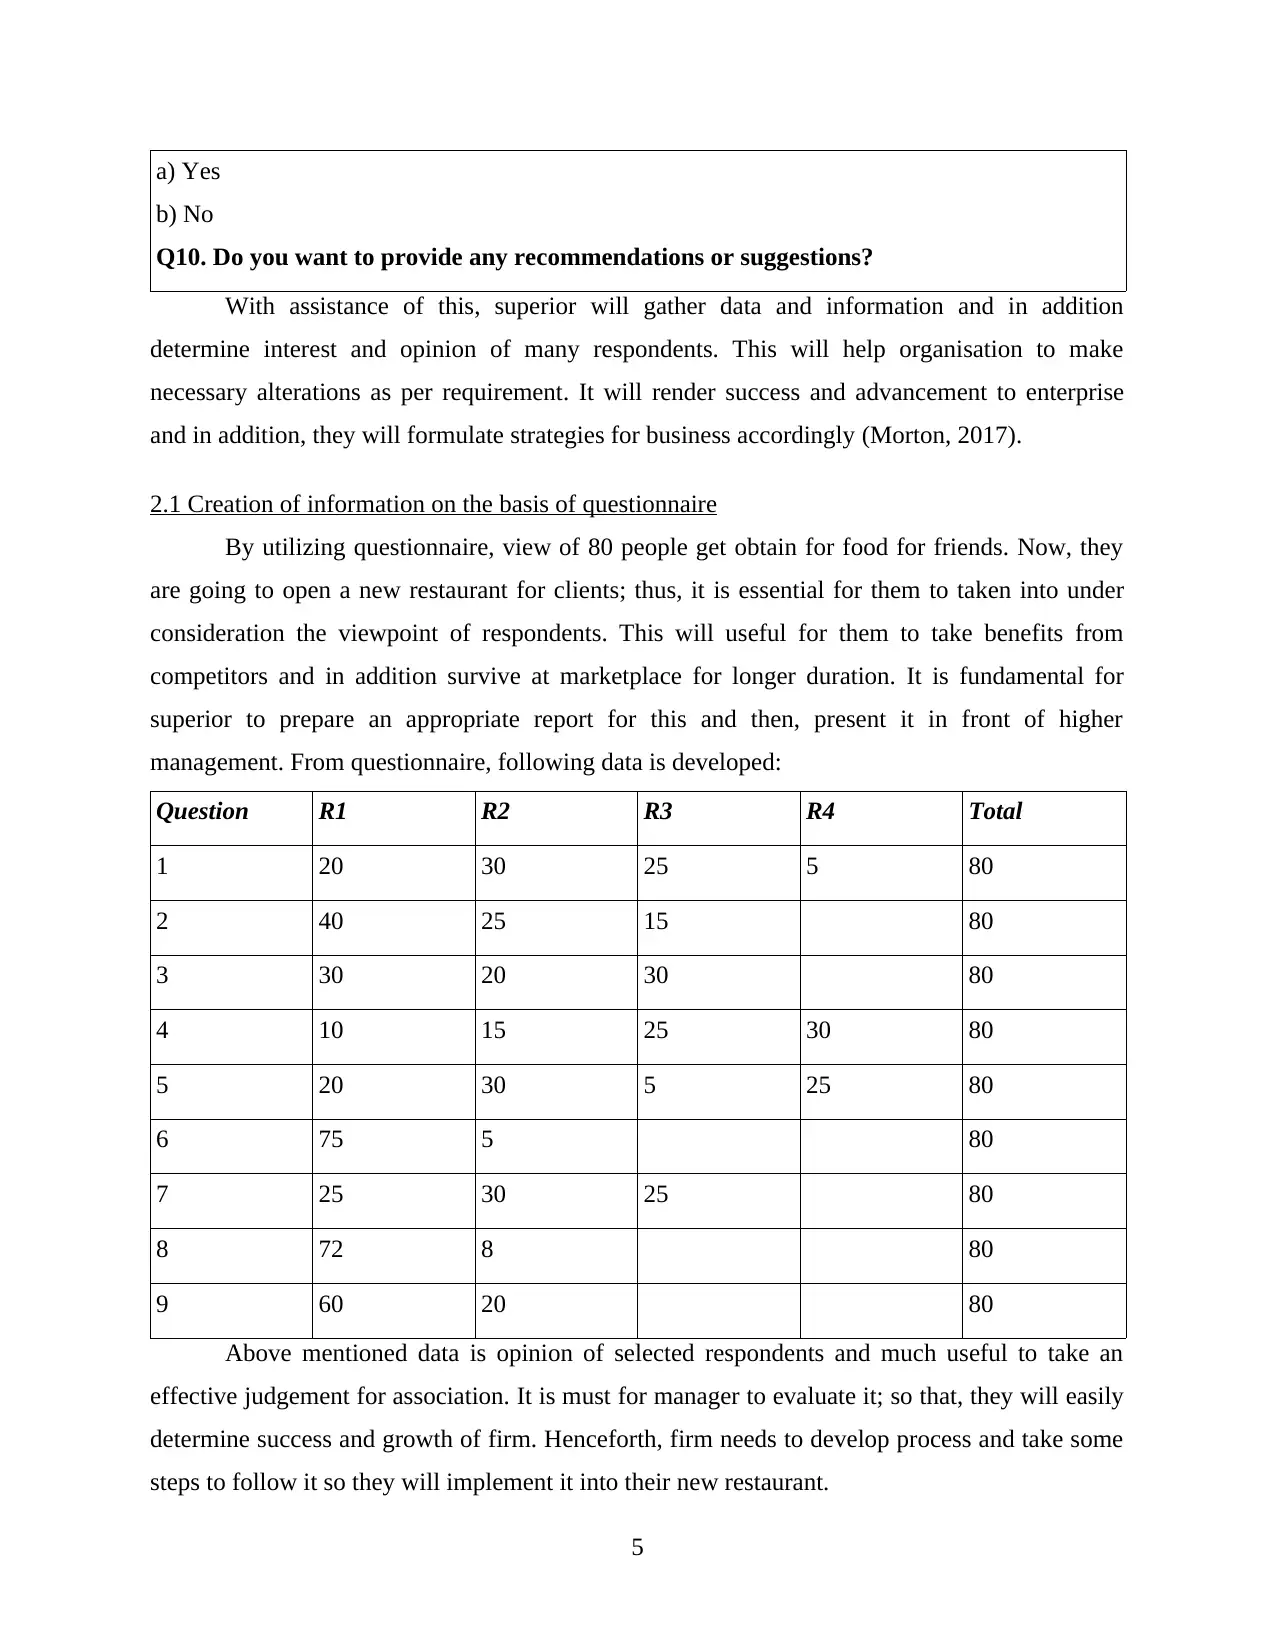
2.1 Creation of information on the basis of questionnaire
By utilizing questionnaire, view of 80 people get obtain for food for friends. Now, they
are going to open a new restaurant for clients; thus, it is essential for them to taken into under
consideration the viewpoint of respondents. This will useful for them to take benefits from
competitors and in addition survive at marketplace for longer duration. It is fundamental for
superior to prepare an appropriate report for this and then, present it in front of higher
management. From questionnaire, following data is developed:
Question R1 R2 R3 R4 Total
1 20 30 25 5 80
2 40 25 15 80
3 30 20 30 80
4 10 15 25 30 80
5 20 30 5 25 80
6 75 5 80
7 25 30 25 80
8 72 8 80
9 60 20 80
Above mentioned data is opinion of selected respondents and much useful to take an
effective judgement for association. It is must for manager to evaluate it; so that, they will easily
determine success and growth of firm. Henceforth, firm needs to develop process and take some
steps to follow it so they will implement it into their new restaurant.
5
b) No
Q10. Do you want to provide any recommendations or suggestions?
With assistance of this, superior will gather data and information and in addition
determine interest and opinion of many respondents. This will help organisation to make
necessary alterations as per requirement. It will render success and advancement to enterprise
and in addition, they will formulate strategies for business accordingly (Morton, 2017).
2.1 Creation of information on the basis of questionnaire
By utilizing questionnaire, view of 80 people get obtain for food for friends. Now, they
are going to open a new restaurant for clients; thus, it is essential for them to taken into under
consideration the viewpoint of respondents. This will useful for them to take benefits from
competitors and in addition survive at marketplace for longer duration. It is fundamental for
superior to prepare an appropriate report for this and then, present it in front of higher
management. From questionnaire, following data is developed:
Question R1 R2 R3 R4 Total
1 20 30 25 5 80
2 40 25 15 80
3 30 20 30 80
4 10 15 25 30 80
5 20 30 5 25 80
6 75 5 80
7 25 30 25 80
8 72 8 80
9 60 20 80
Above mentioned data is opinion of selected respondents and much useful to take an
effective judgement for association. It is must for manager to evaluate it; so that, they will easily
determine success and growth of firm. Henceforth, firm needs to develop process and take some
steps to follow it so they will implement it into their new restaurant.
5
Paraphrase This Document
Need a fresh take? Get an instant paraphrase of this document with our AI Paraphraser
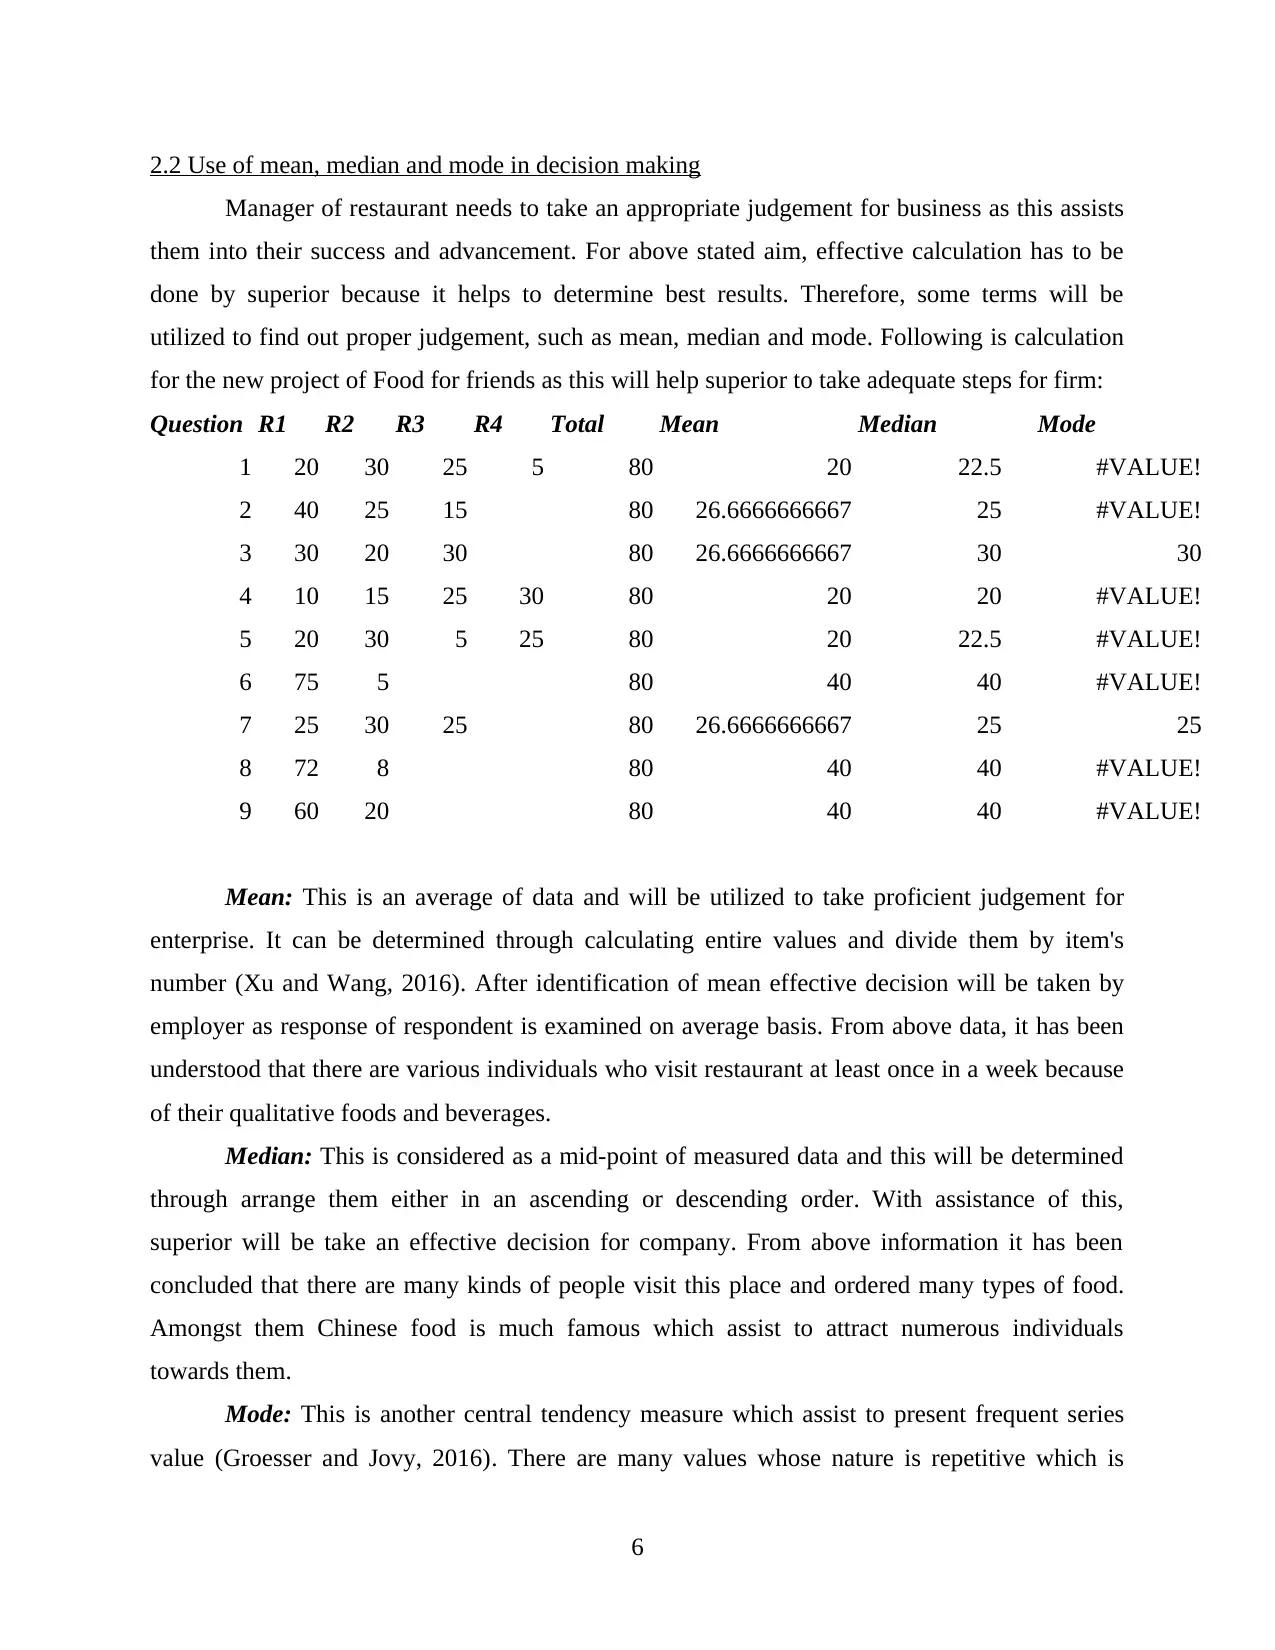
2.2 Use of mean, median and mode in decision making
Manager of restaurant needs to take an appropriate judgement for business as this assists
them into their success and advancement. For above stated aim, effective calculation has to be
done by superior because it helps to determine best results. Therefore, some terms will be
utilized to find out proper judgement, such as mean, median and mode. Following is calculation
for the new project of Food for friends as this will help superior to take adequate steps for firm:
Question R1 R2 R3 R4 Total Mean Median Mode
1 20 30 25 5 80 20 22.5 #VALUE!
2 40 25 15 80 26.6666666667 25 #VALUE!
3 30 20 30 80 26.6666666667 30 30
4 10 15 25 30 80 20 20 #VALUE!
5 20 30 5 25 80 20 22.5 #VALUE!
6 75 5 80 40 40 #VALUE!
7 25 30 25 80 26.6666666667 25 25
8 72 8 80 40 40 #VALUE!
9 60 20 80 40 40 #VALUE!
Mean: This is an average of data and will be utilized to take proficient judgement for
enterprise. It can be determined through calculating entire values and divide them by item's
number (Xu and Wang, 2016). After identification of mean effective decision will be taken by
employer as response of respondent is examined on average basis. From above data, it has been
understood that there are various individuals who visit restaurant at least once in a week because
of their qualitative foods and beverages.
Median: This is considered as a mid-point of measured data and this will be determined
through arrange them either in an ascending or descending order. With assistance of this,
superior will be take an effective decision for company. From above information it has been
concluded that there are many kinds of people visit this place and ordered many types of food.
Amongst them Chinese food is much famous which assist to attract numerous individuals
towards them.
Mode: This is another central tendency measure which assist to present frequent series
value (Groesser and Jovy, 2016). There are many values whose nature is repetitive which is
6
known as mode value. From above data and information it has been understood that people
attract towards organisation because of food quality and discount offers. This enables them to
enhance their goodwill and revenues which help to gain competitive advantage from rivals at
marketplace.
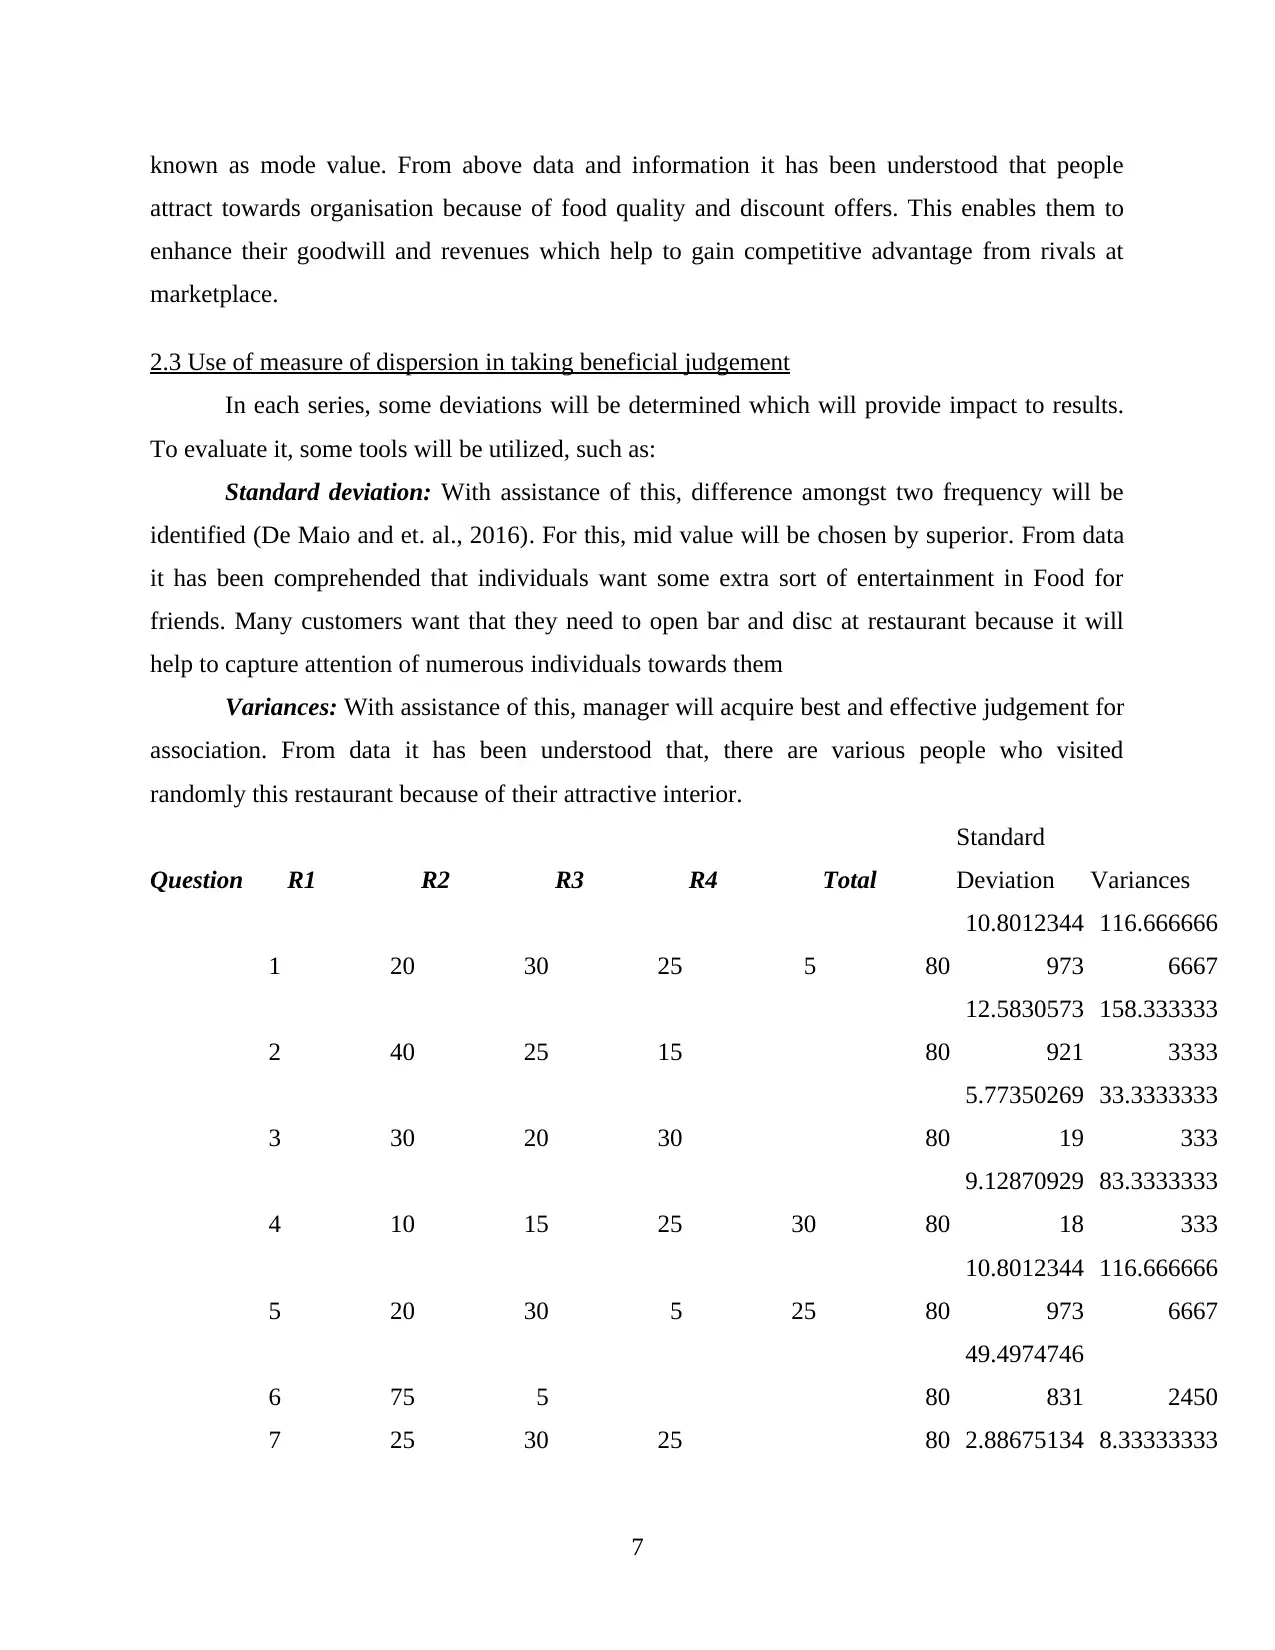
2.3 Use of measure of dispersion in taking beneficial judgement
In each series, some deviations will be determined which will provide impact to results.
To evaluate it, some tools will be utilized, such as:
Standard deviation: With assistance of this, difference amongst two frequency will be
identified (De Maio and et. al., 2016). For this, mid value will be chosen by superior. From data
it has been comprehended that individuals want some extra sort of entertainment in Food for
friends. Many customers want that they need to open bar and disc at restaurant because it will
help to capture attention of numerous individuals towards them
Variances: With assistance of this, manager will acquire best and effective judgement for
association. From data it has been understood that, there are various people who visited
randomly this restaurant because of their attractive interior.
Question R1 R2 R3 R4 Total
Standard
Deviation Variances
1 20 30 25 5 80
10.8012344
973
116.666666
6667
2 40 25 15 80
12.5830573
921
158.333333
3333
3 30 20 30 80
5.77350269
19
33.3333333
333
4 10 15 25 30 80
9.12870929
18
83.3333333
333
5 20 30 5 25 80
10.8012344
973
116.666666
6667
6 75 5 80
49.4974746
831 2450
7 25 30 25 80 2.88675134 8.33333333
7
attract towards organisation because of food quality and discount offers. This enables them to
enhance their goodwill and revenues which help to gain competitive advantage from rivals at
marketplace.
2.3 Use of measure of dispersion in taking beneficial judgement
In each series, some deviations will be determined which will provide impact to results.
To evaluate it, some tools will be utilized, such as:
Standard deviation: With assistance of this, difference amongst two frequency will be
identified (De Maio and et. al., 2016). For this, mid value will be chosen by superior. From data
it has been comprehended that individuals want some extra sort of entertainment in Food for
friends. Many customers want that they need to open bar and disc at restaurant because it will
help to capture attention of numerous individuals towards them
Variances: With assistance of this, manager will acquire best and effective judgement for
association. From data it has been understood that, there are various people who visited
randomly this restaurant because of their attractive interior.
Question R1 R2 R3 R4 Total
Standard
Deviation Variances
1 20 30 25 5 80
10.8012344
973
116.666666
6667
2 40 25 15 80
12.5830573
921
158.333333
3333
3 30 20 30 80
5.77350269
19
33.3333333
333
4 10 15 25 30 80
9.12870929
18
83.3333333
333
5 20 30 5 25 80
10.8012344
973
116.666666
6667
6 75 5 80
49.4974746
831 2450
7 25 30 25 80 2.88675134 8.33333333
7
⊘ This is a preview!⊘
Do you want full access?
Subscribe today to unlock all pages.
Trusted by 1+ million students worldwide
59 33
8 72 8 80
45.2548339
959 2048
9 60 20 80
28.2842712
475 800
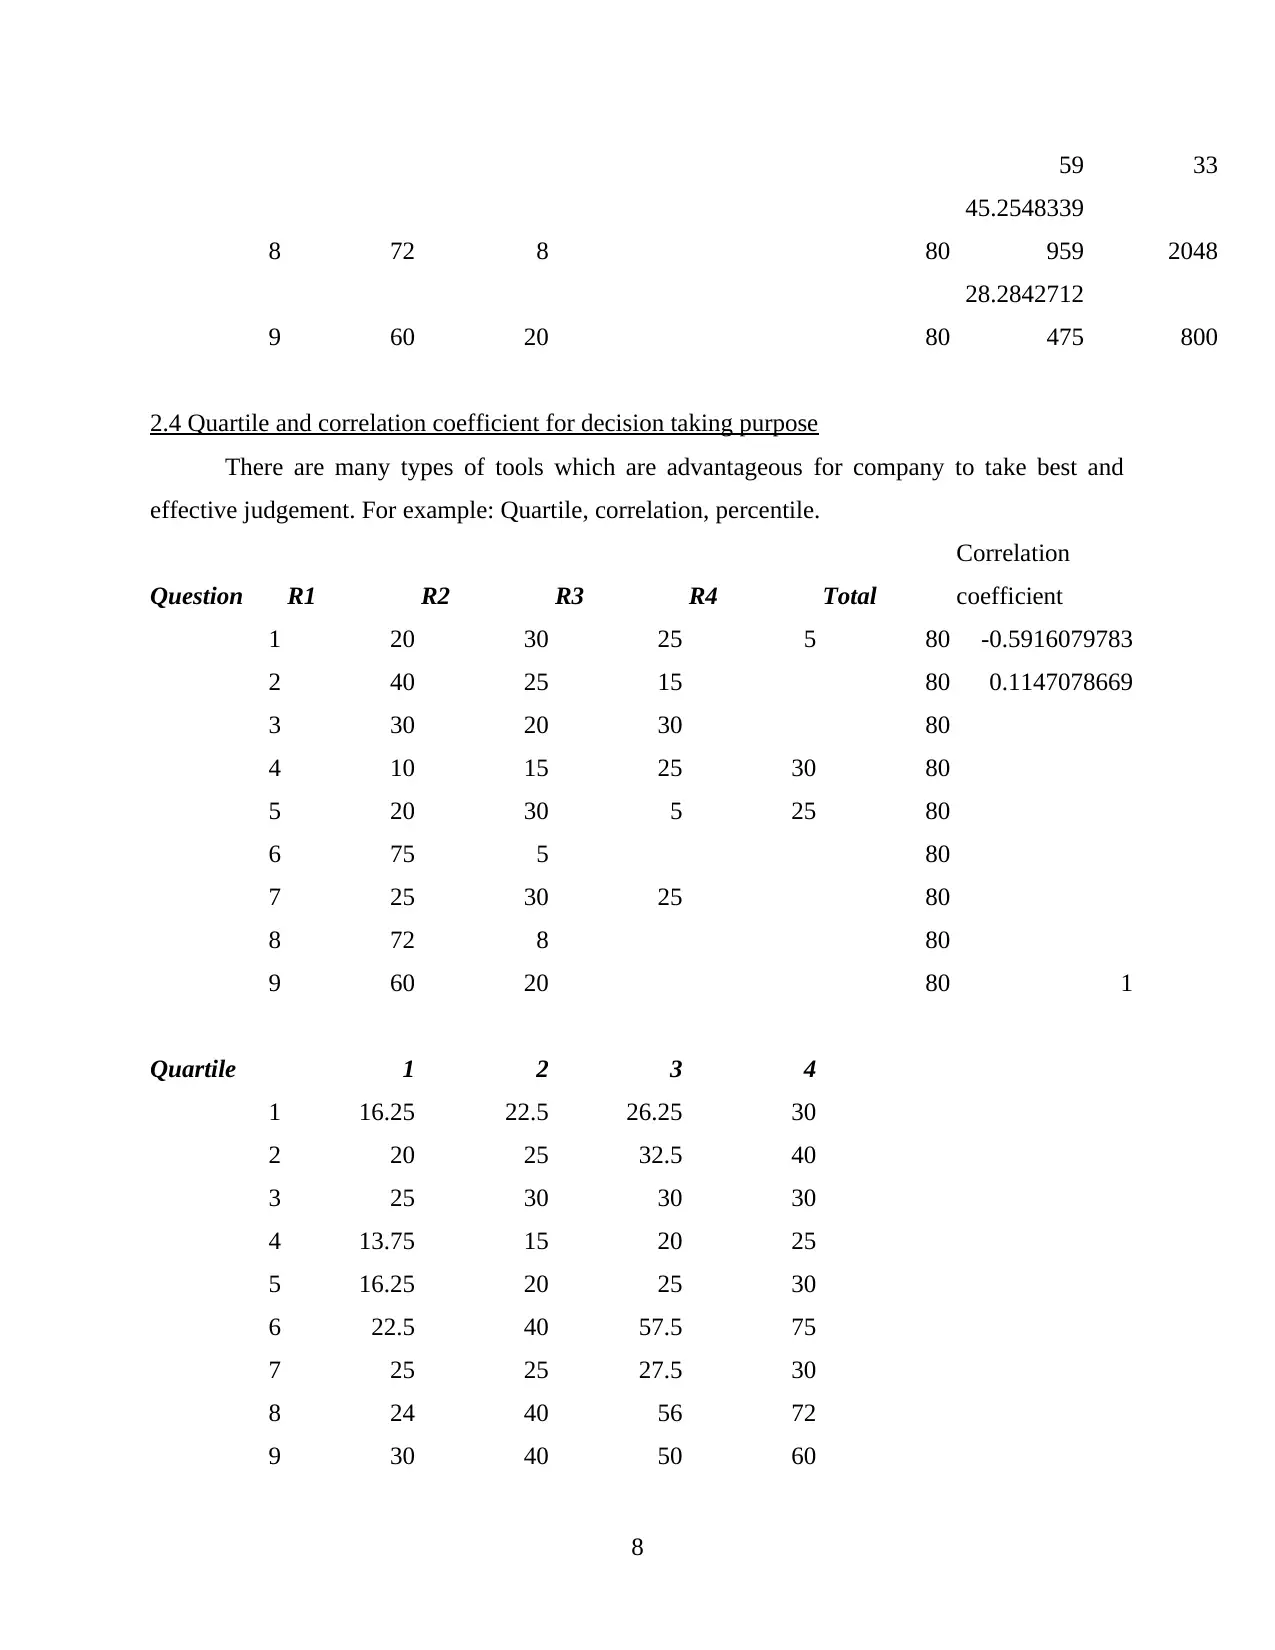
2.4 Quartile and correlation coefficient for decision taking purpose
There are many types of tools which are advantageous for company to take best and
effective judgement. For example: Quartile, correlation, percentile.
Question R1 R2 R3 R4 Total
Correlation
coefficient
1 20 30 25 5 80 -0.5916079783
2 40 25 15 80 0.1147078669
3 30 20 30 80
4 10 15 25 30 80
5 20 30 5 25 80
6 75 5 80
7 25 30 25 80
8 72 8 80
9 60 20 80 1
Quartile 1 2 3 4
1 16.25 22.5 26.25 30
2 20 25 32.5 40
3 25 30 30 30
4 13.75 15 20 25
5 16.25 20 25 30
6 22.5 40 57.5 75
7 25 25 27.5 30
8 24 40 56 72
9 30 40 50 60
8
8 72 8 80
45.2548339
959 2048
9 60 20 80
28.2842712
475 800
2.4 Quartile and correlation coefficient for decision taking purpose
There are many types of tools which are advantageous for company to take best and
effective judgement. For example: Quartile, correlation, percentile.
Question R1 R2 R3 R4 Total
Correlation
coefficient
1 20 30 25 5 80 -0.5916079783
2 40 25 15 80 0.1147078669
3 30 20 30 80
4 10 15 25 30 80
5 20 30 5 25 80
6 75 5 80
7 25 30 25 80
8 72 8 80
9 60 20 80 1
Quartile 1 2 3 4
1 16.25 22.5 26.25 30
2 20 25 32.5 40
3 25 30 30 30
4 13.75 15 20 25
5 16.25 20 25 30
6 22.5 40 57.5 75
7 25 25 27.5 30
8 24 40 56 72
9 30 40 50 60
8
Paraphrase This Document
Need a fresh take? Get an instant paraphrase of this document with our AI Paraphraser
Quartile: There are some series value which will affect decision of business either
directly or indirectly. Fundamentally, there are four quartiles, i.e. Q1, Q2, Q3 and Q4. From
above data, it has been comprehended that, there are numerous individuals who are highly
satisfied with the services of Food for friends.
Percentile: With assistance of this, outcome will be examined in percentage manner. It
has been examined that there are various people who never get affected by the price of goods and
services because of their income level (Crane and Matten, 2016).
Correlation: It describes relationship amongst two data. If it is 1 or -1 then, this is
considered as best relation. From above data, it has been comprehended that there are some
customers of restaurant who want buffet system.
TASK 2
3.1 Use of graphs and charts on the basis of information
2 times 3 times once in a week never
0
5
10
15
20
25
30
20
30
25
5
Column B
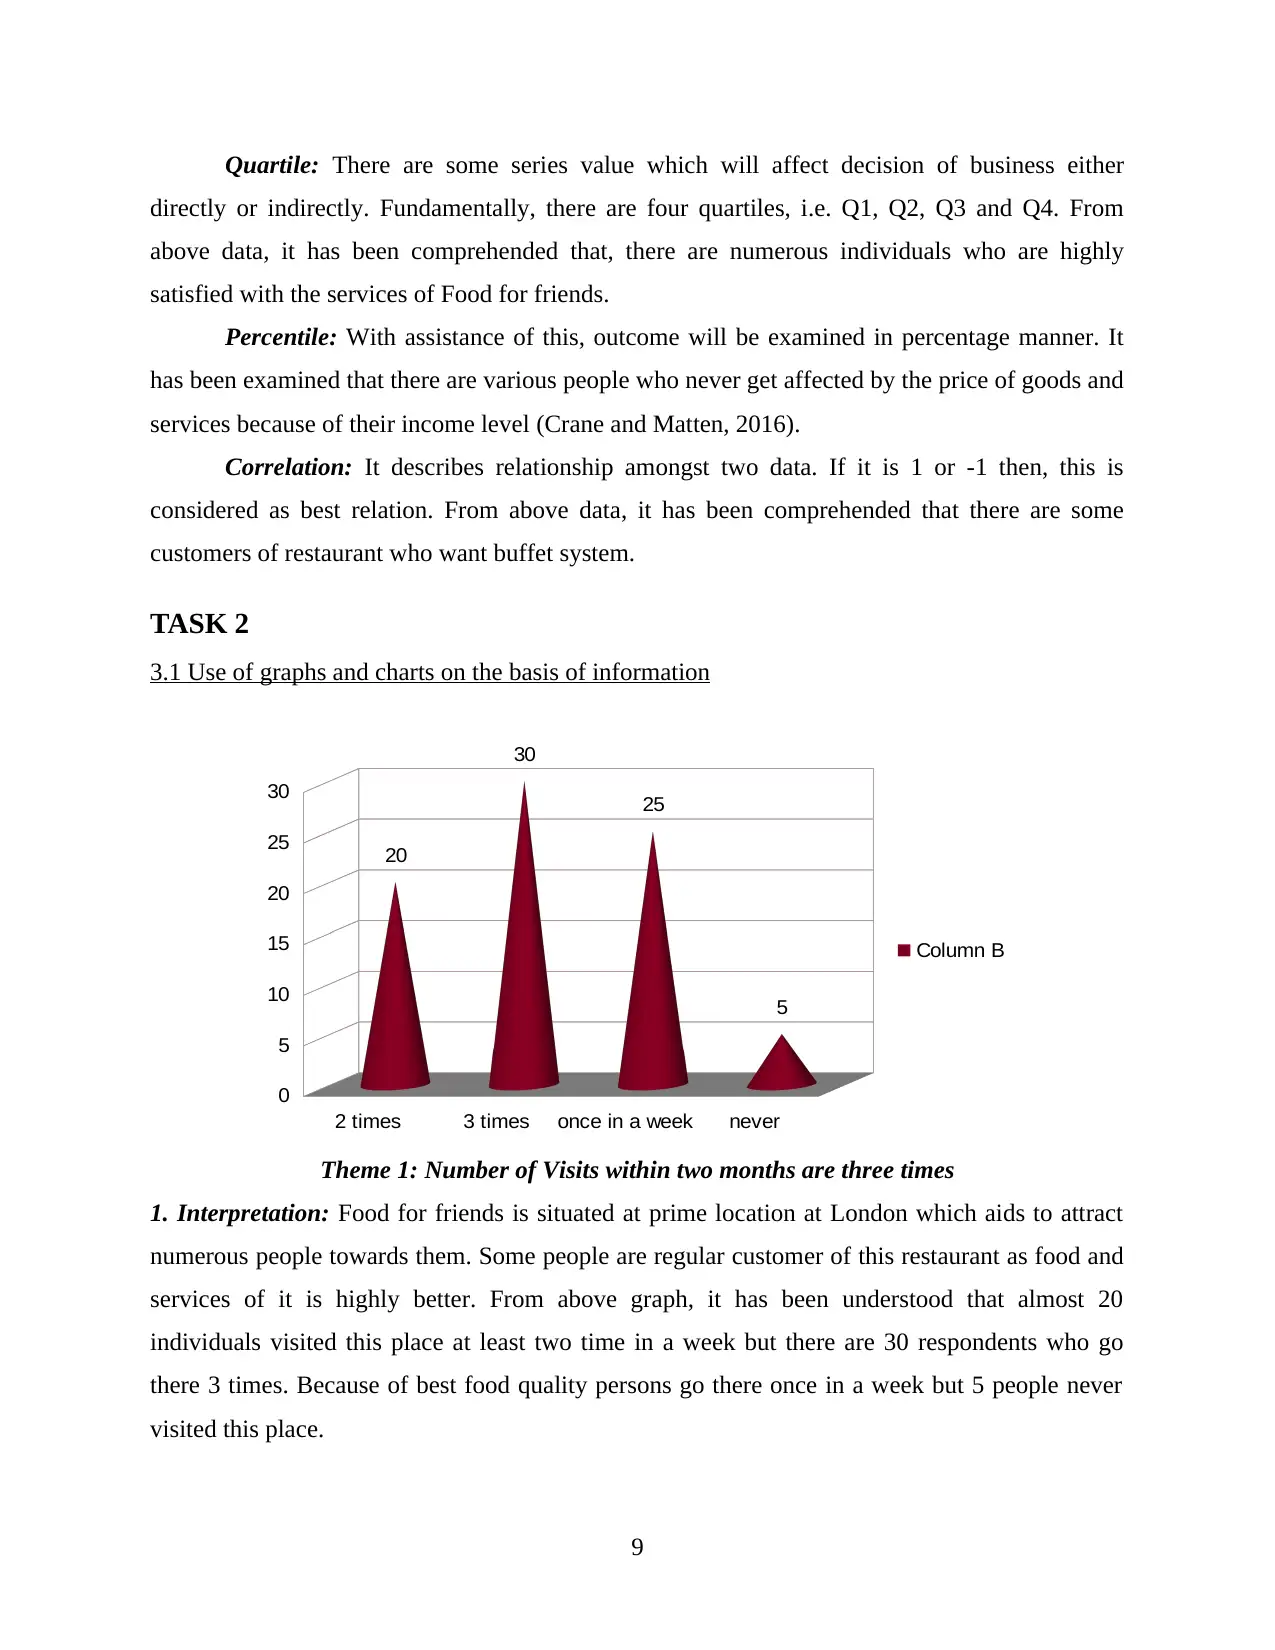
Theme 1: Number of Visits within two months are three times
1. Interpretation: Food for friends is situated at prime location at London which aids to attract
numerous people towards them. Some people are regular customer of this restaurant as food and
services of it is highly better. From above graph, it has been understood that almost 20
individuals visited this place at least two time in a week but there are 30 respondents who go
there 3 times. Because of best food quality persons go there once in a week but 5 people never
visited this place.
9
directly or indirectly. Fundamentally, there are four quartiles, i.e. Q1, Q2, Q3 and Q4. From
above data, it has been comprehended that, there are numerous individuals who are highly
satisfied with the services of Food for friends.
Percentile: With assistance of this, outcome will be examined in percentage manner. It
has been examined that there are various people who never get affected by the price of goods and
services because of their income level (Crane and Matten, 2016).
Correlation: It describes relationship amongst two data. If it is 1 or -1 then, this is
considered as best relation. From above data, it has been comprehended that there are some
customers of restaurant who want buffet system.
TASK 2
3.1 Use of graphs and charts on the basis of information
2 times 3 times once in a week never
0
5
10
15
20
25
30
20
30
25
5
Column B
Theme 1: Number of Visits within two months are three times
1. Interpretation: Food for friends is situated at prime location at London which aids to attract
numerous people towards them. Some people are regular customer of this restaurant as food and
services of it is highly better. From above graph, it has been understood that almost 20
individuals visited this place at least two time in a week but there are 30 respondents who go
there 3 times. Because of best food quality persons go there once in a week but 5 people never
visited this place.
9
Chinese Italian Mexican
0
5
10
15
20
25
30
35
40
Column B
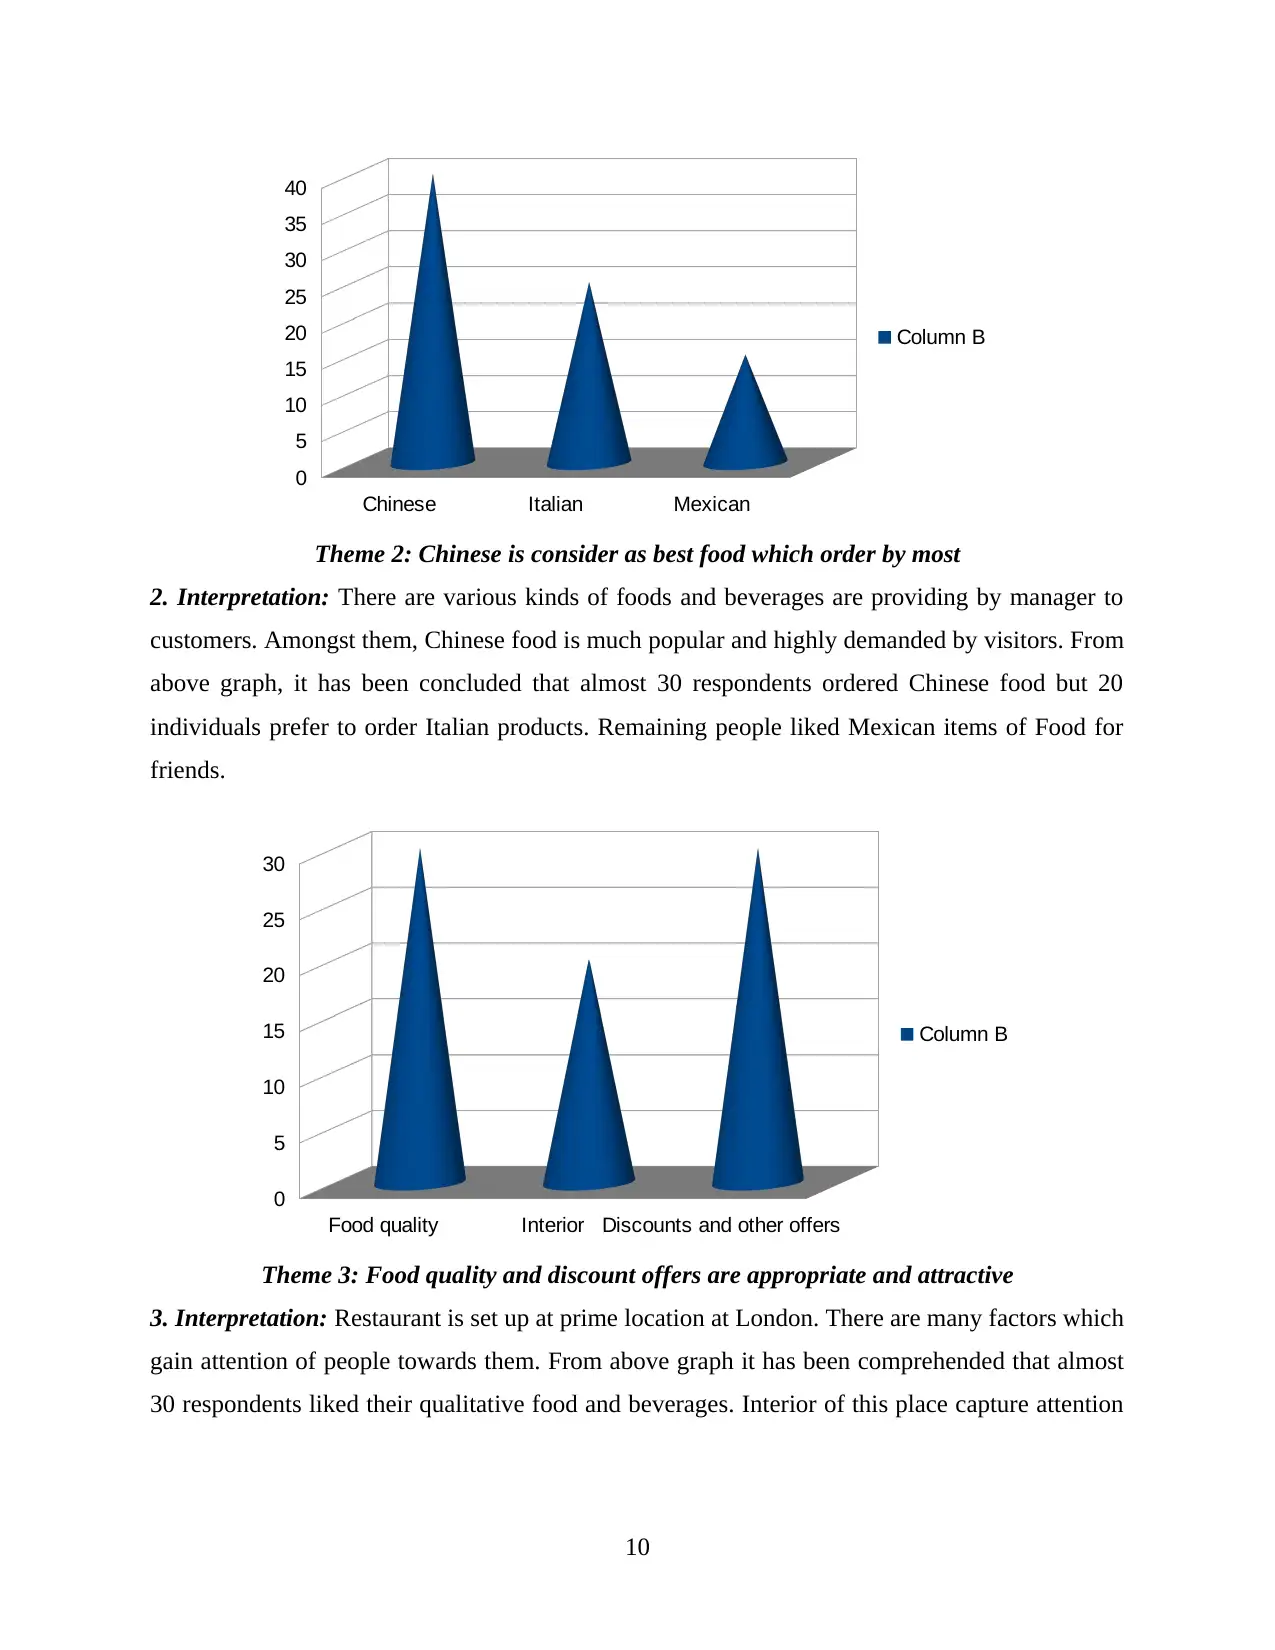
Theme 2: Chinese is consider as best food which order by most
2. Interpretation: There are various kinds of foods and beverages are providing by manager to
customers. Amongst them, Chinese food is much popular and highly demanded by visitors. From
above graph, it has been concluded that almost 30 respondents ordered Chinese food but 20
individuals prefer to order Italian products. Remaining people liked Mexican items of Food for
friends.
Food quality Interior Discounts and other offers
0
5
10
15
20
25
30
Column B
Theme 3: Food quality and discount offers are appropriate and attractive
3. Interpretation: Restaurant is set up at prime location at London. There are many factors which
gain attention of people towards them. From above graph it has been comprehended that almost
30 respondents liked their qualitative food and beverages. Interior of this place capture attention
10
0
5
10
15
20
25
30
35
40
Column B
Theme 2: Chinese is consider as best food which order by most
2. Interpretation: There are various kinds of foods and beverages are providing by manager to
customers. Amongst them, Chinese food is much popular and highly demanded by visitors. From
above graph, it has been concluded that almost 30 respondents ordered Chinese food but 20
individuals prefer to order Italian products. Remaining people liked Mexican items of Food for
friends.
Food quality Interior Discounts and other offers
0
5
10
15
20
25
30
Column B
Theme 3: Food quality and discount offers are appropriate and attractive
3. Interpretation: Restaurant is set up at prime location at London. There are many factors which
gain attention of people towards them. From above graph it has been comprehended that almost
30 respondents liked their qualitative food and beverages. Interior of this place capture attention
10
⊘ This is a preview!⊘
Do you want full access?
Subscribe today to unlock all pages.
Trusted by 1+ million students worldwide
1 out of 22
Related Documents


Your All-in-One AI-Powered Toolkit for Academic Success.
+13062052269
info@desklib.com
Available 24*7 on WhatsApp / Email
![[object Object]](/_next/static/media/star-bottom.7253800d.svg)
Unlock your academic potential
Copyright © 2020–2026 A2Z Services. All Rights Reserved. Developed and managed by ZUCOL.