Business Decision Making Report: Data Collection and Analysis, London
VerifiedAdded on 2020/11/23
|21
|3715
|133
Report
AI Summary
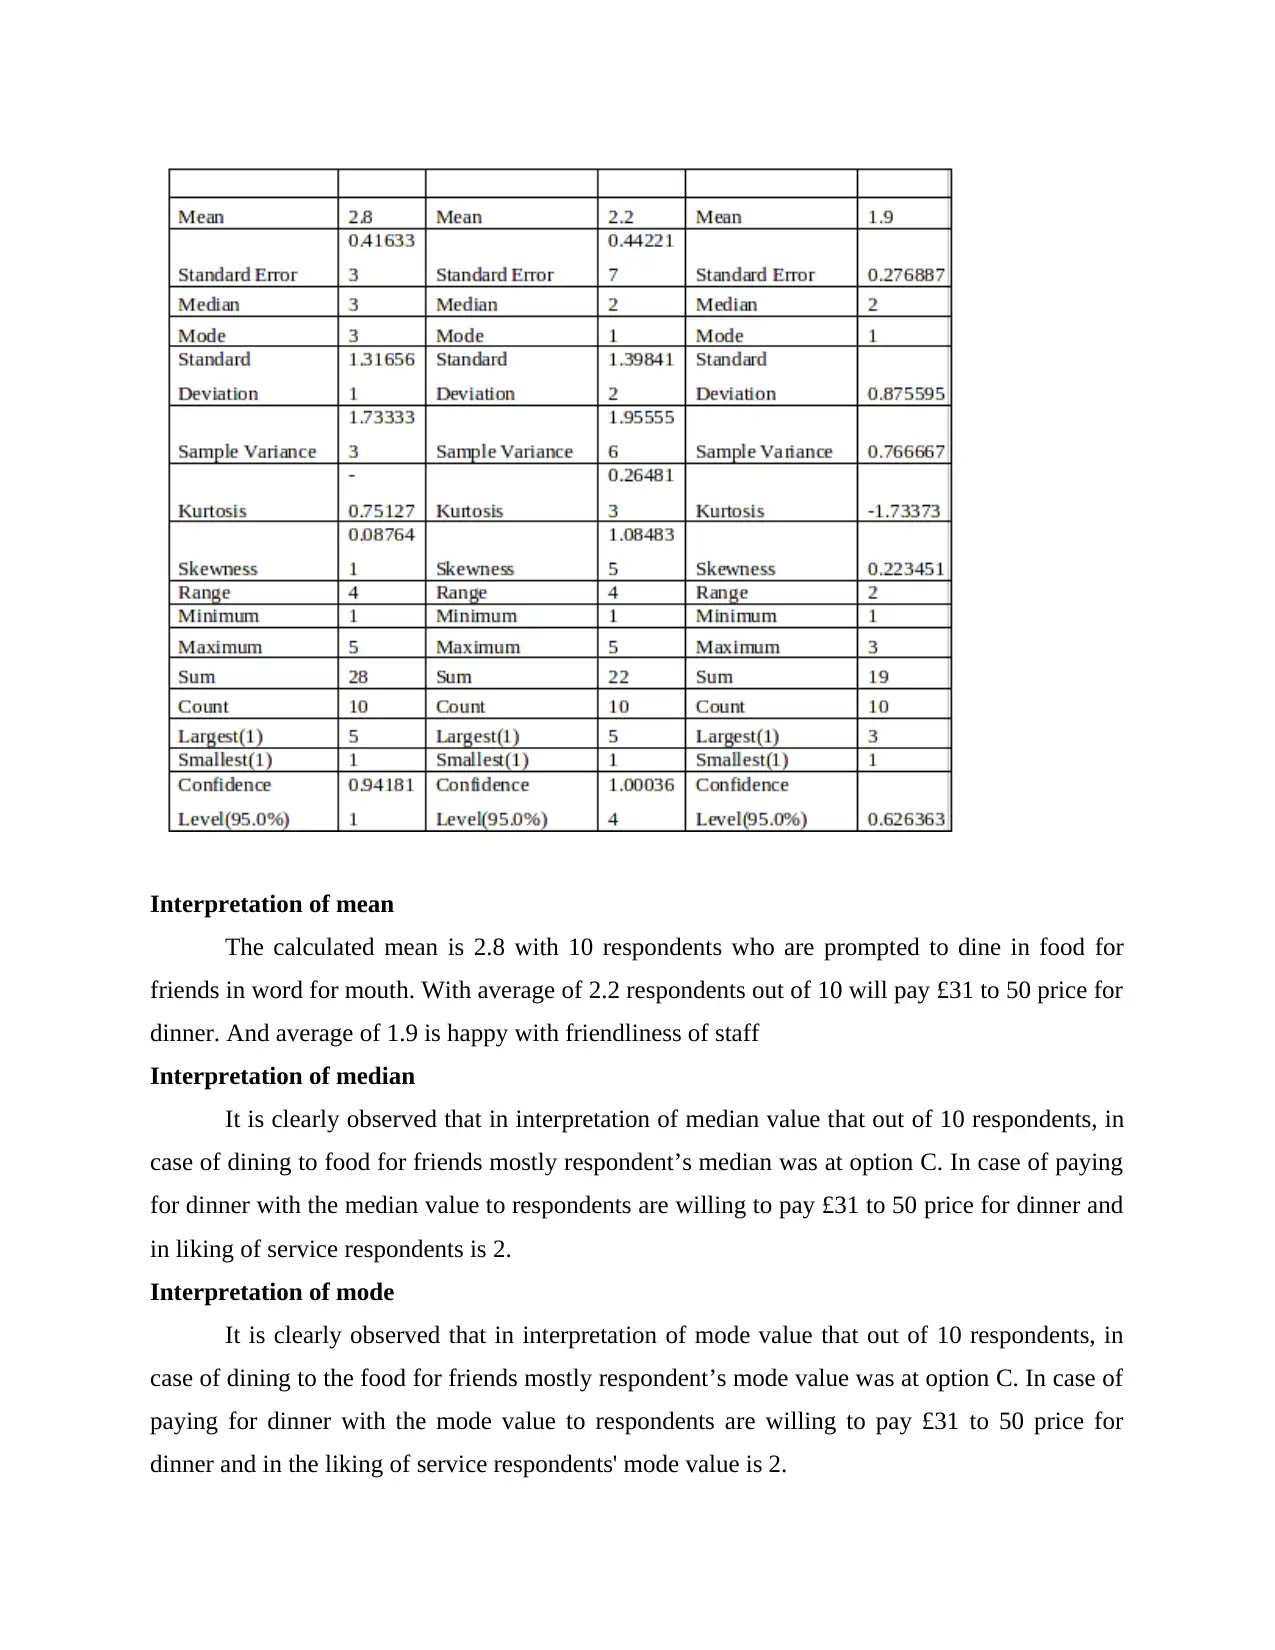
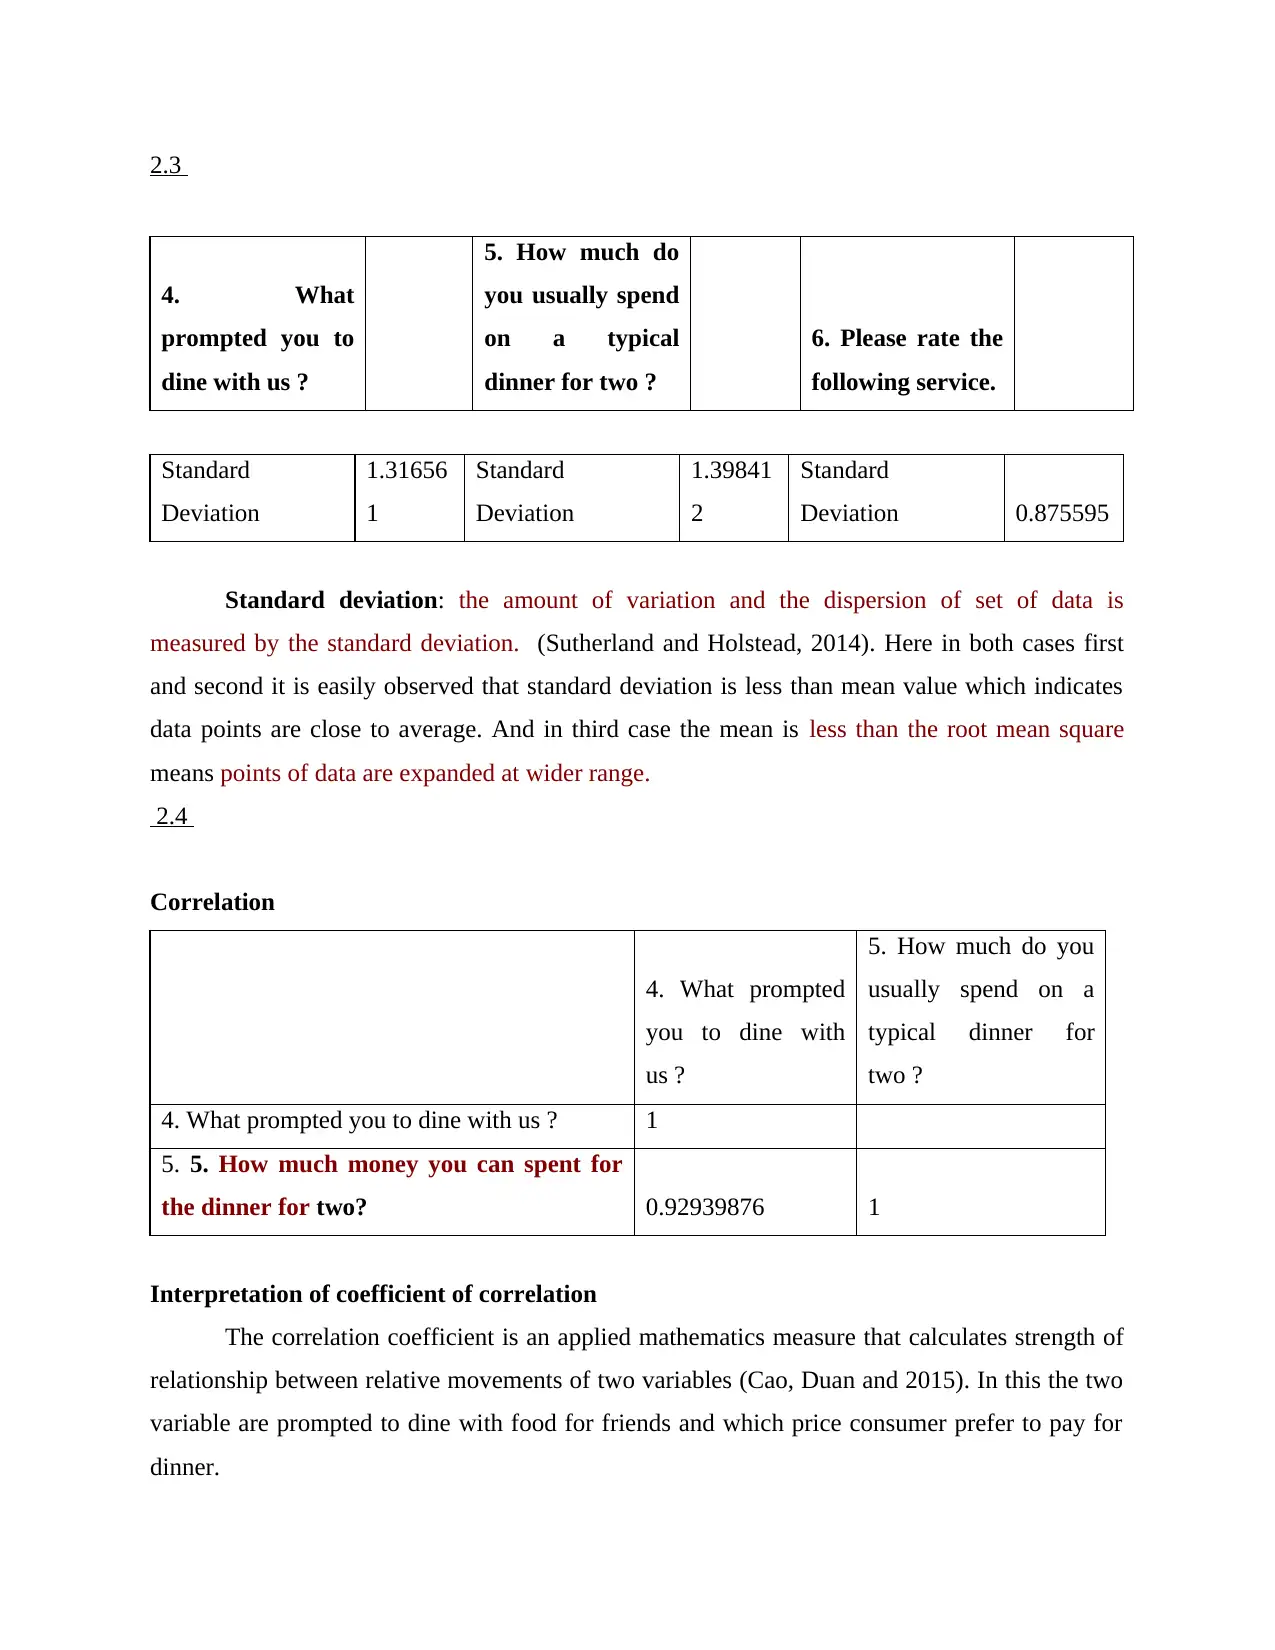
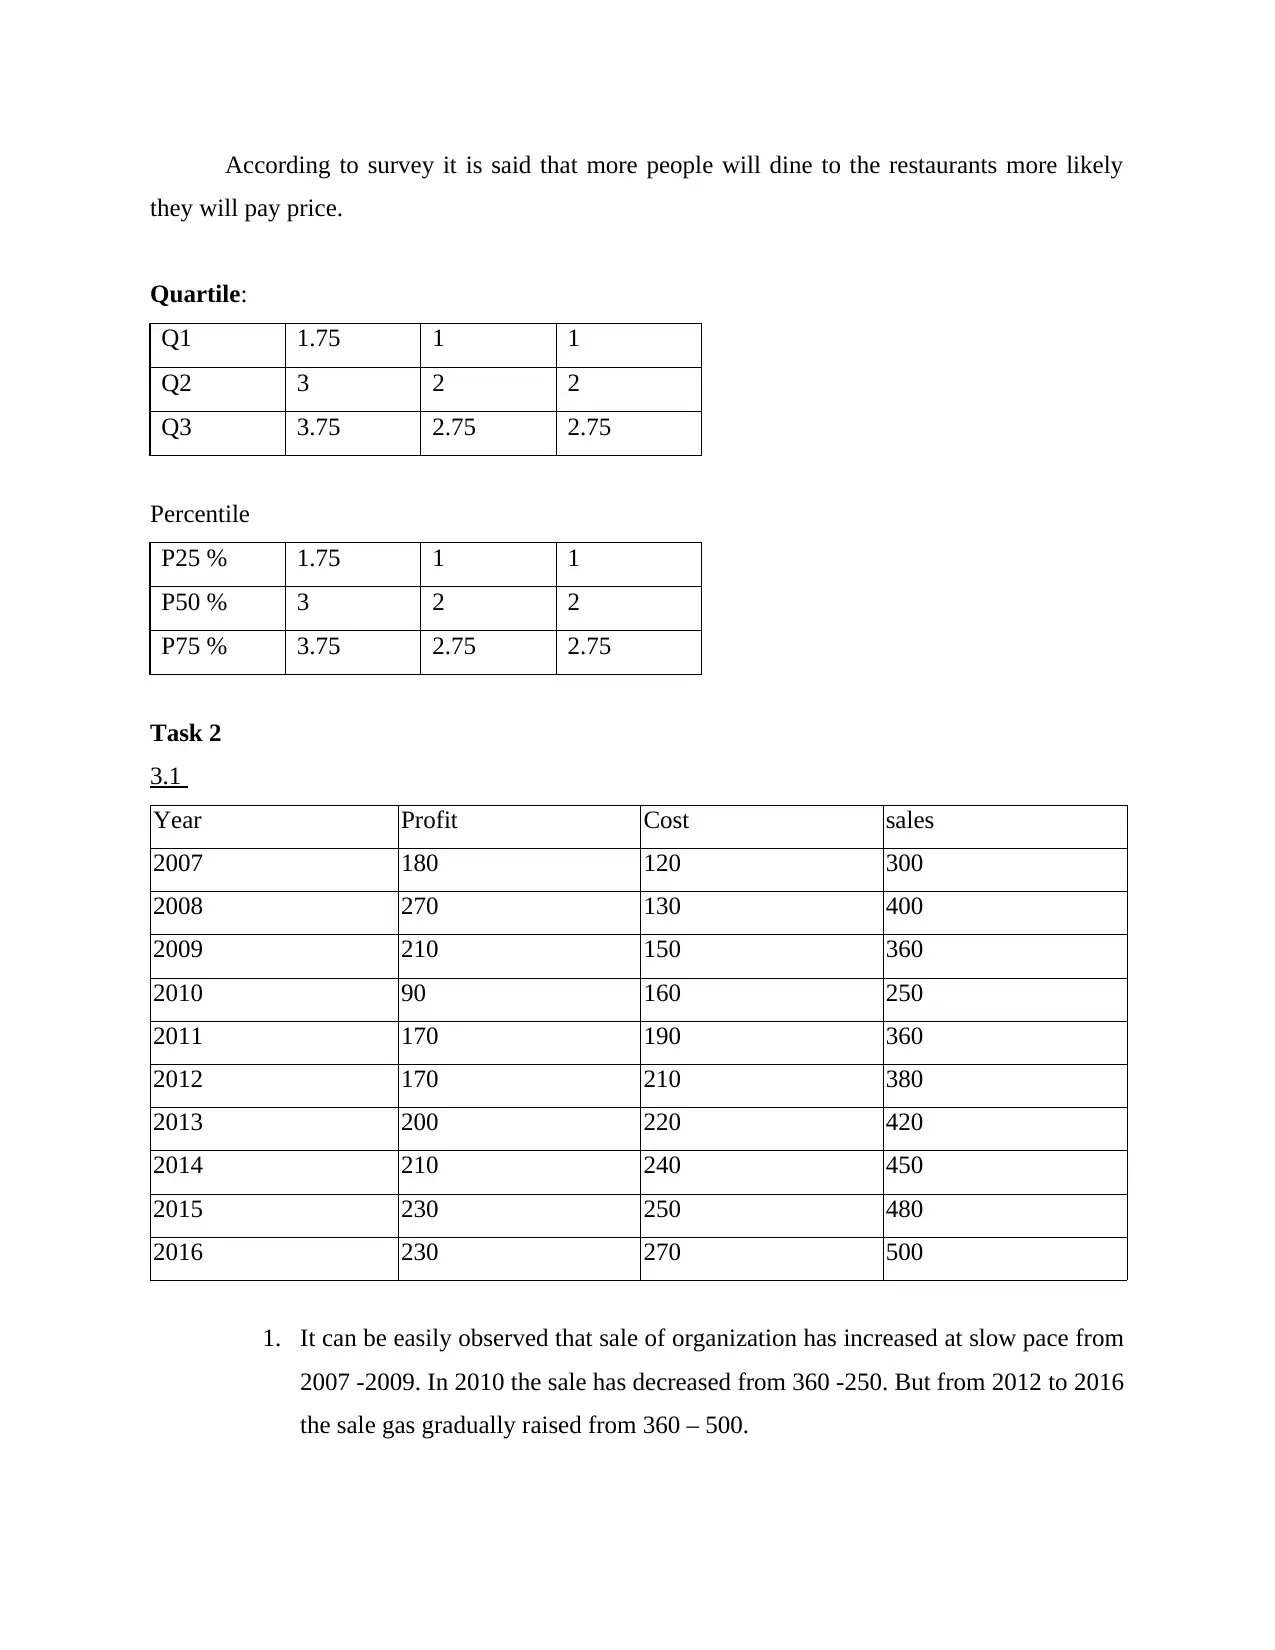
This report focuses on business decision-making for a restaurant named 'Food for Friends' planning to expand in London. It begins by outlining data collection plans, differentiating between quantitative and qualitative data, and emphasizing the importance of both primary and secondary data. The report details survey methodologies, including questionnaire design with both closed and open-ended questions, and discusses sampling techniques like simple random sampling. The report then presents and interprets survey data, using representative values like mean, median, and mode, along with measures of dispersion such as standard deviation. It also includes correlation analysis and quartile/percentile calculations to provide a comprehensive data analysis. The report further analyzes financial data, including profit, cost, and sales trends, and presents these using trend lines and interpretations. The report also includes a questionnaire designed to gather customer feedback and preferences. The analysis utilizes various statistical tools to aid in decision-making, supporting the restaurant's expansion strategy based on consumer insights. Finally, the report provides a conclusion that summarizes key findings and insights from the data analysis, providing recommendations for the business expansion.

BUSINESS DECISION
MAKING
MAKING
Paraphrase This Document
Need a fresh take? Get an instant paraphrase of this document with our AI Paraphraser

TABLE OF CONTENTS
INTRODUCTION...........................................................................................................................3
TASK 1 ...........................................................................................................................................3
1.1 ...............................................................................................................................................3
1.2 ...............................................................................................................................................3
1.3 ...............................................................................................................................................4
2.1................................................................................................................................................6
2.2 ...............................................................................................................................................9
2.3 .............................................................................................................................................11
2.4 ............................................................................................................................................11
Task 2.............................................................................................................................................12
3.1 .............................................................................................................................................12
3.2 ............................................................................................................................................13
3.3 Enclosed in PPT..................................................................................................................15
3.4..............................................................................................................................................15
TASK 3..........................................................................................................................................15
4.1 & 4.2 ...................................................................................................................................15
4.3 .............................................................................................................................................16
CONCLUSION..............................................................................................................................19
REFERENCES..............................................................................................................................20

INTRODUCTION
The present report is based on the restaurants naming food for friends in which the
owner has decided for the expansion of business in London. This report will present plan for the
data collection and also various methods to analyse them. In this report the manager of research
team has got responsibilities to know about the consumer tastes and preferences so that further
expansion can takes place. For this various statistical tools, capital budgeting techniques and the
network diagrams were applied by research team so that decision-making for the expansion can
be taken.
TASK 1
1.1
Data is consisted of verses, statistics, photographs, map, icons etc. data are of two types
quantifiable and qualitative. In quantifiable data, information is collected from set of questions,
cases, surveys, etc. quantitative are always recognized in numbers layout. Quantitative data have
numerical information, which includes statistical techniques. While qualitative data includes
narratives and words. The analysis of data including highlighting keywords, extracting themes,
and elaborating on concepts. Qualitative data comes when the observation fall into separate
distinct categories (Pettigrew, 2014).
These data are always taped in detail. It is necessary to gather both to acquire the
outstanding result for Food for Friends. With the help of interviews, research and observation,
primary data is collected. But according to the situation this is necessary to collect consumer’s
response thus interviews are very essential. Subsidiary data are taped which subsist presently
(Reymen and et.al, 2017). Idea of collecting main or subsidiary data for scenario are casual
examination, telephony scrutiny, quick questionnaires, perceiving consumers, use of website to
receive feedback from customers, analyses company's details etc.
1.2
It is used to collect data from the specific segments. It studies samplings of individual
units from a population and related techniques of collection. It includes the instruments or
procedures that some question that may or may not be answered (Arnsten and Pittenger, 2017).
In given case it is very necessary to collect information from customers about their taste and
preferences, liking and disliking, etc. questionnaire be like having close or open question.
According to this there are mainly two ways to conduct the surveys I.e. questionnaires and
⊘ This is a preview!⊘
Do you want full access?
Subscribe today to unlock all pages.

Trusted by 1+ million students worldwide

interviews. This survey can also be done by the quantitative assessment and qualitative design
methodology.
Talking about the sampling ways, the sampling used are of 2 types non probability and
probability sampling. Both the methods have different type of techniques for sampling (Collier,
2015). For example, non-probability sampling is consisted of snowball method, quota sampling,
and judgemental sample method (He, Wang and Akula, 2017). Whereas probability consisted of
cluster sampling, method of random sampling, stratified method of sampling and systematic
sampling method. In this scenario where Simple random techniques can be use as the sampling
frame and best suitable way to conduct survey is from questionnaires which consist of both open
and close ended questions.
1.3
Dear precious client,
We food for friends as the leading restaurants in markets looking to give more than that
our customer anticipates. We are introducing food for friends’ small store where you can easily
access and order the food which you want. To raise the service for customer orientation, I want
to ask some questions.
Thanks for your precious time in advance for answering the questions.
For providing amended work in future
Best regards,
---------------------
Managing director,
Food for friends
Consumer Name: ------------
Address: --------------
Age: -------------
Gender: -----------
1. Are you satisfied to trade with food for friends.
Yes () no ()
please provide the specification if you answer is no
2. What is your satisfaction with the taste of our food?
a. Fantabulous
Paraphrase This Document
Need a fresh take? Get an instant paraphrase of this document with our AI Paraphraser

b. Very good
c. Good
d. Fine
3. How often do you feed at our restaurants?
a. Daily
b. Weakly
c. Every month
d. Once in a three months
e. Once in a six months or fewer
4. What makes you to feed with us?
a. Location
b. Experience
c. Word of mouth
d. Advertisement
e. All of these
5. How much money you can spent for the dinner for two?
a. £31 to 50
b. £51 to 70
c. £71 to 90
d. £91 to 110
e. Over £110
6. Which service you like most.
a. Friendliness to staff
b. knowledge of the staff about menu
c. Consideration of staffs
7. Kindly provide the ratings in the menu for the following items
a. food Quality
b. variety of Menu
c. price in the menu.
8.Do our staffs meet your needs?

a. Yes
b. No
9.Would you like someone to contact you?
a. Yes
b. No
10. The accuracy of our food order
a. Satisfied
b. Unsatisfied
11. Did you like the overall atmosphere of the restaurant?
a. Yes
b. No
2.1
4. What prompted you to dine with us? Respondents percentage
a. Location 2 20.00%
b. Experience 2 20.00%
c. Word of mouth 3 30.00%
d. Advertisement 2 20.00%
e. All of these 1 10.00%
Total 10 100.00%
b. No
9.Would you like someone to contact you?
a. Yes
b. No
10. The accuracy of our food order
a. Satisfied
b. Unsatisfied
11. Did you like the overall atmosphere of the restaurant?
a. Yes
b. No
2.1
4. What prompted you to dine with us? Respondents percentage
a. Location 2 20.00%
b. Experience 2 20.00%
c. Word of mouth 3 30.00%
d. Advertisement 2 20.00%
e. All of these 1 10.00%
Total 10 100.00%
⊘ This is a preview!⊘
Do you want full access?
Subscribe today to unlock all pages.

Trusted by 1+ million students worldwide

a. Location
b. Past Experience
c. Word of mouth
d. Advertisement
e. All of these
0
0.5
1
1.5
2
2.5
3
3.5
2 2
3
2
1
20.00% 20.00% 30.00% 20.00% 10.00%
Respondents
percentage
Interpretations
According to this survey conducted for food for friends to know about customers taste
and preferences, it can be easily observed that from the entire, only 30 % percent respondents are
prompting the restaurant just for word of mouth, then from location, experience, and
advertisement 20 %. There are only 10 % respondents which are influenced by all the factors to
prompt in food for friends.
5. How much money you can spent for the dinner for two? Respondents percentage
a. £31 to 50 4 40.00%
b. £51 to 70 3 30.00%
c. £71 to 90 1 10.00%
d. £91 to 110 1 10.00%
e. Over £110 1 10.00%
Total 10 100.00%
Paraphrase This Document
Need a fresh take? Get an instant paraphrase of this document with our AI Paraphraser

a. £31 to 50
b. £51 to 70
c. £71 to 90
d. £91 to 110
e. Over £ 110
0
0.5
1
1.5
2
2.5
3
3.5
4
4.5
4
3
1 1 1
40.00% 30.00% 10.00% 10.00% 10.00%
Respondents
percentage
Interpretations
According to this survey conducted for food for friends to know about customers taste
and preferences, it can be easily observed that from entire group, there are 40 % respondents
which spend £31 to 50 for the dinner 30 % used £51 to 70. There are only 10 % respondents
which are ready to pay more than £71 -110 for the dinner.
6. Which service you like most. Respondents percentage
a. Friendliness to staff 4 40.00%
b. Staff's knowledge of the menu 3 30.00%
c. Attentiveness of staffs 3 30.00%
Total 10 100.00%

a. Friendliness to staff
b. Staff's knowledge of the menu
c. Attentiveness of staffs
0
0.5
1
1.5
2
2.5
3
3.5
4
4.5
4
3 3
40.00% 30.00% 30.00%
Respondents
percentage
Interpretation
According to this survey conducted for food for friends to know about customers taste
and preferences, it can be easily observed that from entire groups there are 40 % respondents
which like the behaviour of the employees, then to the attentiveness and staff knowledge about
the menus that is 30 %.
2.2
The food for friends will calculate the central tendencies which includes -
Mean: the calculation of the mean is done by number of observation upon sum of
observations.
Median: in the list of value there is a middle value called median (Barletted., 2016).
to identify the median, the numbers must be in ascending order that is from small to large. If it is
not then first convert it before finding the median.
4.What
prompted you to
dine with us ?
5. How much do
you usually spend
on a typical
dinner for two ?
6. Please rate the
following service.
⊘ This is a preview!⊘
Do you want full access?
Subscribe today to unlock all pages.

Trusted by 1+ million students worldwide

Interpretation of mean
The calculated mean is 2.8 with 10 respondents who are prompted to dine in food for
friends in word for mouth. With average of 2.2 respondents out of 10 will pay £31 to 50 price for
dinner. And average of 1.9 is happy with friendliness of staff
Interpretation of median
It is clearly observed that in interpretation of median value that out of 10 respondents, in
case of dining to food for friends mostly respondent’s median was at option C. In case of paying
for dinner with the median value to respondents are willing to pay £31 to 50 price for dinner and
in liking of service respondents is 2.
Interpretation of mode
It is clearly observed that in interpretation of mode value that out of 10 respondents, in
case of dining to the food for friends mostly respondent’s mode value was at option C. In case of
paying for dinner with the mode value to respondents are willing to pay £31 to 50 price for
dinner and in the liking of service respondents' mode value is 2.
Paraphrase This Document
Need a fresh take? Get an instant paraphrase of this document with our AI Paraphraser

2.3
4. What
prompted you to
dine with us ?
5. How much do
you usually spend
on a typical
dinner for two ?
6. Please rate the
following service.
Standard
Deviation
1.31656
1
Standard
Deviation
1.39841
2
Standard
Deviation 0.875595
Standard deviation: the amount of variation and the dispersion of set of data is
measured by the standard deviation. (Sutherland and Holstead, 2014). Here in both cases first
and second it is easily observed that standard deviation is less than mean value which indicates
data points are close to average. And in third case the mean is less than the root mean square
means points of data are expanded at wider range.
2.4
Correlation
4. What prompted
you to dine with
us ?
5. How much do you
usually spend on a
typical dinner for
two ?
4. What prompted you to dine with us ? 1
5. 5. How much money you can spent for
the dinner for two? 0.92939876 1
Interpretation of coefficient of correlation
The correlation coefficient is an applied mathematics measure that calculates strength of
relationship between relative movements of two variables (Cao, Duan and 2015). In this the two
variable are prompted to dine with food for friends and which price consumer prefer to pay for
dinner.

According to survey it is said that more people will dine to the restaurants more likely
they will pay price.
Quartile:
Q1 1.75 1 1
Q2 3 2 2
Q3 3.75 2.75 2.75
Percentile
P25 % 1.75 1 1
P50 % 3 2 2
P75 % 3.75 2.75 2.75
Task 2
3.1
Year Profit Cost sales
2007 180 120 300
2008 270 130 400
2009 210 150 360
2010 90 160 250
2011 170 190 360
2012 170 210 380
2013 200 220 420
2014 210 240 450
2015 230 250 480
2016 230 270 500
1. It can be easily observed that sale of organization has increased at slow pace from
2007 -2009. In 2010 the sale has decreased from 360 -250. But from 2012 to 2016
the sale gas gradually raised from 360 – 500.
⊘ This is a preview!⊘
Do you want full access?
Subscribe today to unlock all pages.

Trusted by 1+ million students worldwide
1 out of 21
Related Documents
Your All-in-One AI-Powered Toolkit for Academic Success.
+13062052269
info@desklib.com
Available 24*7 on WhatsApp / Email
Unlock your academic potential
Copyright © 2020–2025 A2Z Services. All Rights Reserved. Developed and managed by ZUCOL.


