Business Decision Making Report: Kitchen Design Ltd Analysis
VerifiedAdded on 2020/02/12
|31
|5744
|50
Report
AI Summary
This report focuses on business decision-making for Kitchen Design Ltd, examining market opportunities in bathroom design and equipment. It details data collection methods, including primary and secondary sources, survey methodology, and questionnaire design. The report analyzes sales data using mean, median, mode, range, standard deviation, and correlation, presenting findings through graphs and trend lines. Furthermore, it explores inventory management using information processing tools and discusses investment decisions using NPV and IRR. The study provides a comprehensive overview of market analysis, statistical tools, and strategic planning, supporting sound decision-making for business expansion.

BUSINESS DECISION MAKING
Paraphrase This Document
Need a fresh take? Get an instant paraphrase of this document with our AI Paraphraser
TABLE OF CONTENTS
Introduction......................................................................................................................................3
Task 1...............................................................................................................................................3
1.1 Primary and secondary sources of data..................................................................................3
1.2 Survey methodology and sampling frame work....................................................................6
1.3 Questionnaire.........................................................................................................................7
Task 2...............................................................................................................................................9
2.1 Calculations of Mean, mode and median...............................................................................9
2.2 Analyses of results...............................................................................................................11
2.3 Calculation of range, inter-quartile and standard deviation.................................................12
2.4 Calculation of correlation and quartiles...............................................................................13
Task 3.............................................................................................................................................15
3.1 Graphs and interpretation.....................................................................................................15
3.2 Trend lines and scatter graphs..............................................................................................20
3.3 data presentation..................................................................................................................20
3.4 Business report.....................................................................................................................25
Task 4.............................................................................................................................................26
4.1 Use of information processing tool to mange inventory......................................................26
4.2 Project plan..........................................................................................................................26
4.3 Investment decisions............................................................................................................28
Conclusion.....................................................................................................................................29
References......................................................................................................................................30
2
INTRODUCTION
Decision making is indispensable part of business; innumerable decisions affect the
overall performance of organization significantly. Managers have to take appropriate decisions
out of many alternatives which can help in growth of the company. Present report is based on
Kitchen Design Ltd (Kennedy and Avila, 2013). It is a reputed brand of contemporary kitchen
installation. Firm is aiming to explore opportunities for bathroom design and equipment.
Assignment will discuss primary and secondary source of data that can help the cited firm to
diversify into new market. For carrying out the research, survey methodology and sampling
frame work will be discussed in this study. Calculations of mean, mode, median will be done for
measuring working of the organization. Graphs, line chart will be presented for drawing valid
conclusion so that managers can make sound decision. Use of information processing tool will
be discussed for managing inventory effectively. Calculations of investment appraisal techniques
NPV & IRR will be done in this study (Poonnawat and Lehmann, 2014).
TASK 1
1.1 Primary and secondary sources of data
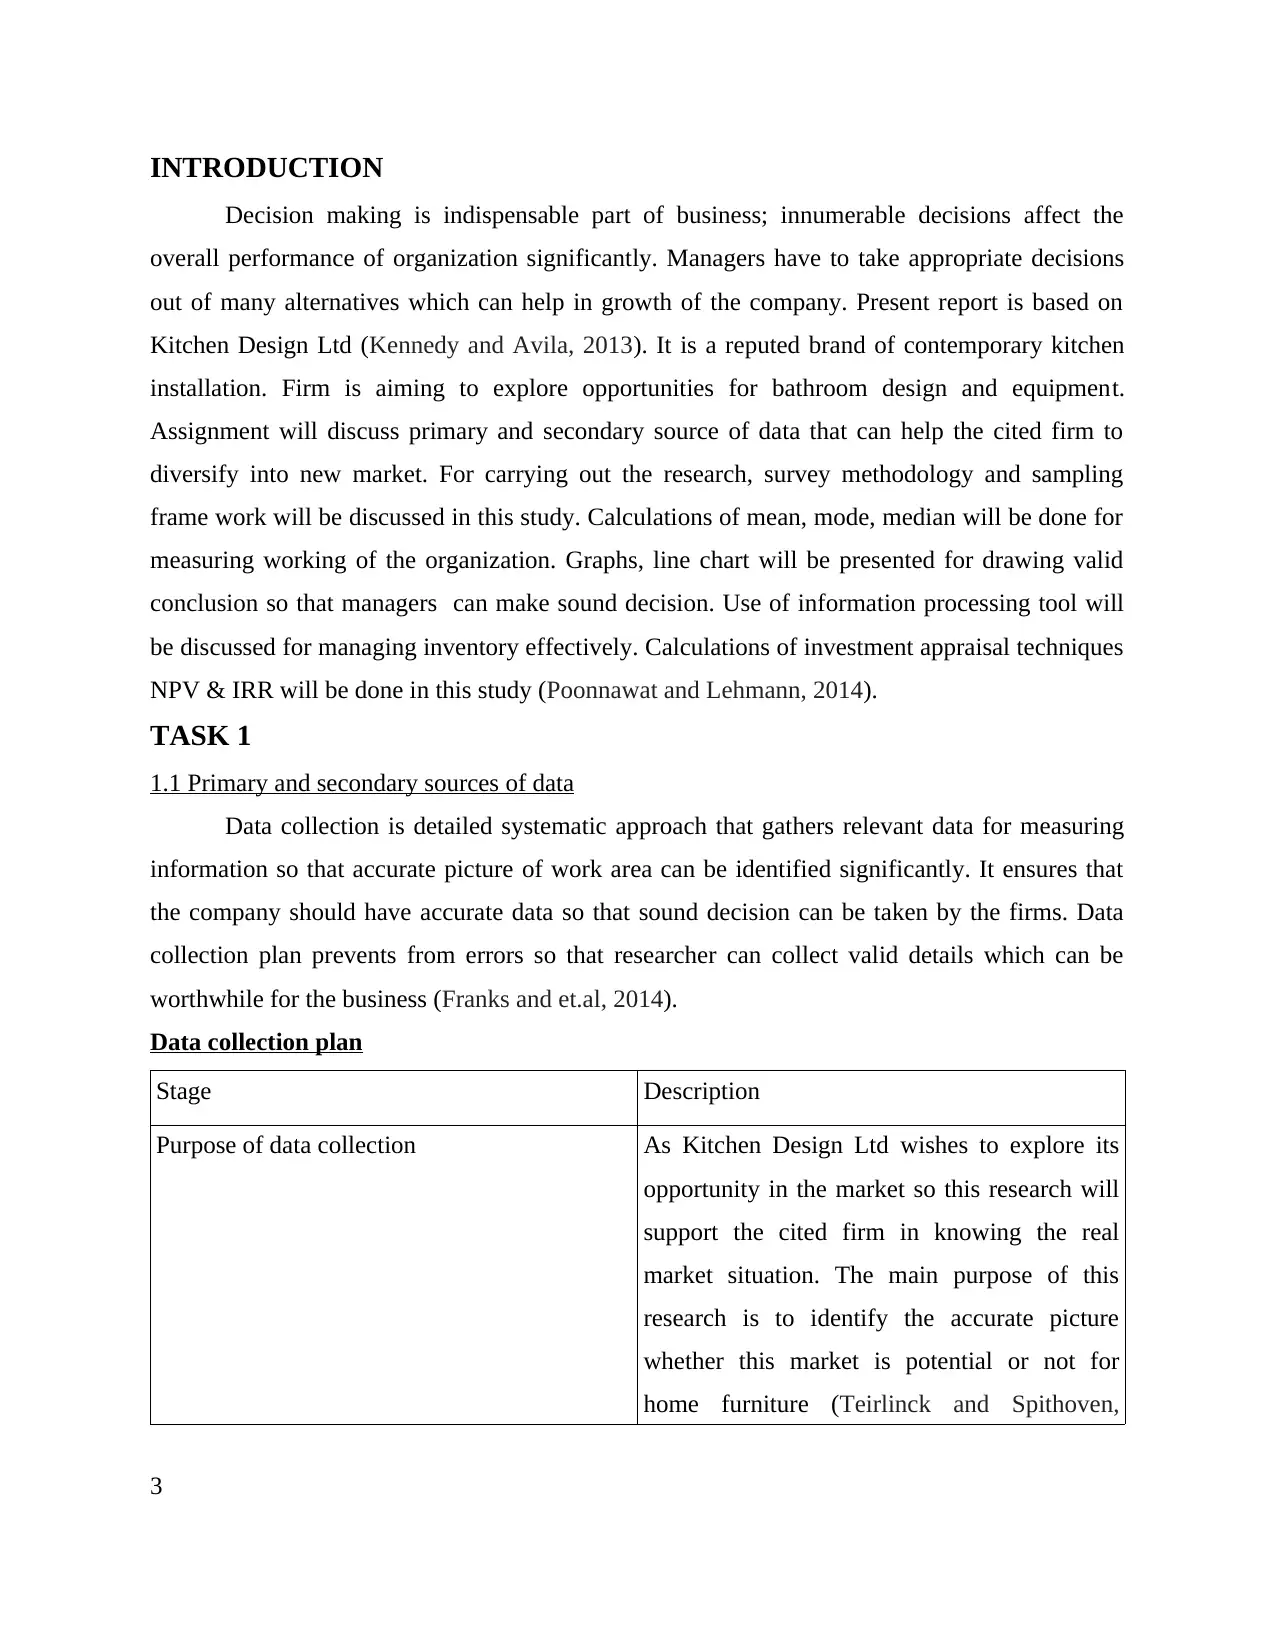
Data collection is detailed systematic approach that gathers relevant data for measuring
information so that accurate picture of work area can be identified significantly. It ensures that
the company should have accurate data so that sound decision can be taken by the firms. Data
collection plan prevents from errors so that researcher can collect valid details which can be
worthwhile for the business (Franks and et.al, 2014).
Data collection plan
Stage Description
Purpose of data collection As Kitchen Design Ltd wishes to explore its
opportunity in the market so this research will
support the cited firm in knowing the real
market situation. The main purpose of this
research is to identify the accurate picture
whether this market is potential or not for
home furniture (Teirlinck and Spithoven,
3
Decision making is indispensable part of business; innumerable decisions affect the
overall performance of organization significantly. Managers have to take appropriate decisions
out of many alternatives which can help in growth of the company. Present report is based on
Kitchen Design Ltd (Kennedy and Avila, 2013). It is a reputed brand of contemporary kitchen
installation. Firm is aiming to explore opportunities for bathroom design and equipment.
Assignment will discuss primary and secondary source of data that can help the cited firm to
diversify into new market. For carrying out the research, survey methodology and sampling
frame work will be discussed in this study. Calculations of mean, mode, median will be done for
measuring working of the organization. Graphs, line chart will be presented for drawing valid
conclusion so that managers can make sound decision. Use of information processing tool will
be discussed for managing inventory effectively. Calculations of investment appraisal techniques
NPV & IRR will be done in this study (Poonnawat and Lehmann, 2014).
TASK 1
1.1 Primary and secondary sources of data
Data collection is detailed systematic approach that gathers relevant data for measuring
information so that accurate picture of work area can be identified significantly. It ensures that
the company should have accurate data so that sound decision can be taken by the firms. Data
collection plan prevents from errors so that researcher can collect valid details which can be
worthwhile for the business (Franks and et.al, 2014).
Data collection plan
Stage Description
Purpose of data collection As Kitchen Design Ltd wishes to explore its
opportunity in the market so this research will
support the cited firm in knowing the real
market situation. The main purpose of this
research is to identify the accurate picture
whether this market is potential or not for
home furniture (Teirlinck and Spithoven,
3
⊘ This is a preview!⊘
Do you want full access?
Subscribe today to unlock all pages.
Trusted by 1+ million students worldwide
2013).
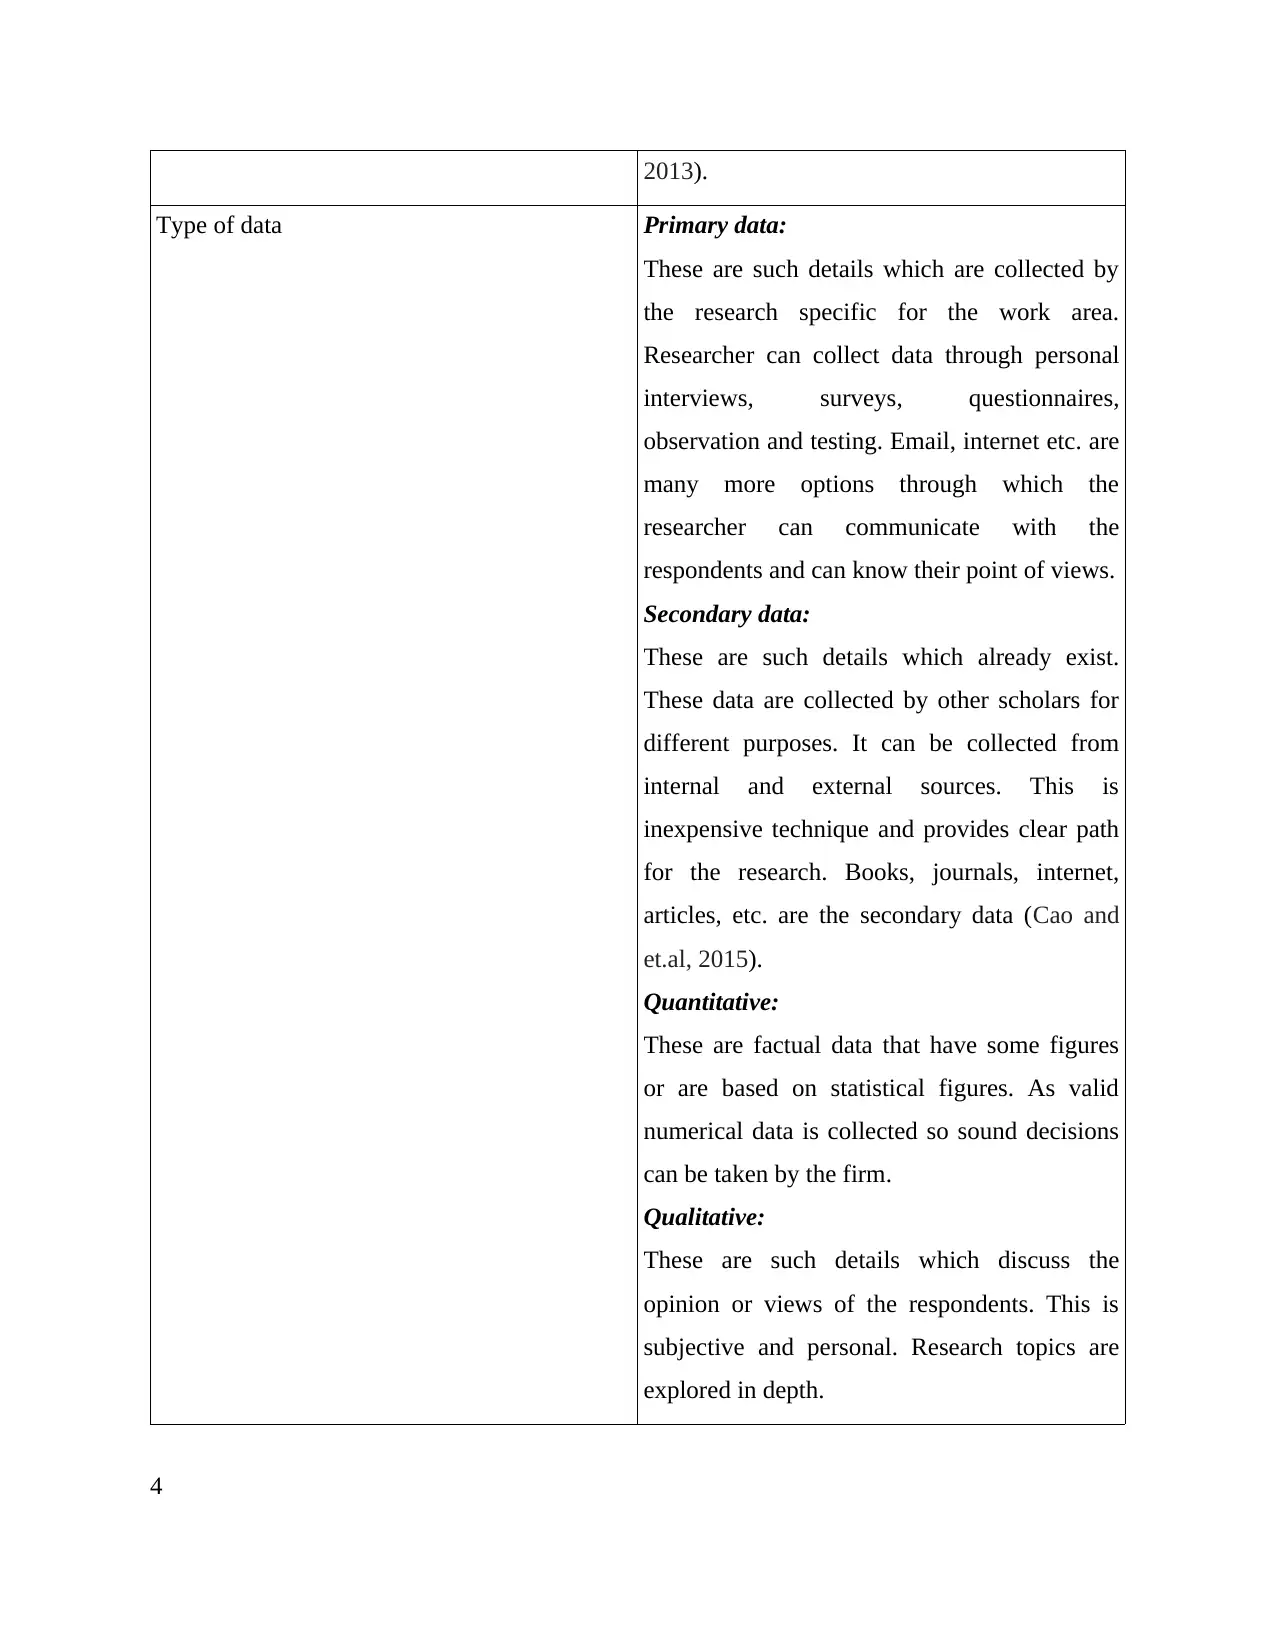
Type of data Primary data:
These are such details which are collected by
the research specific for the work area.
Researcher can collect data through personal
interviews, surveys, questionnaires,
observation and testing. Email, internet etc. are
many more options through which the
researcher can communicate with the
respondents and can know their point of views.
Secondary data:
These are such details which already exist.
These data are collected by other scholars for
different purposes. It can be collected from
internal and external sources. This is
inexpensive technique and provides clear path
for the research. Books, journals, internet,
articles, etc. are the secondary data (Cao and
et.al, 2015).
Quantitative:
These are factual data that have some figures
or are based on statistical figures. As valid
numerical data is collected so sound decisions
can be taken by the firm.
Qualitative:
These are such details which discuss the
opinion or views of the respondents. This is
subjective and personal. Research topics are
explored in depth.
4
Paraphrase This Document
Need a fresh take? Get an instant paraphrase of this document with our AI Paraphraser
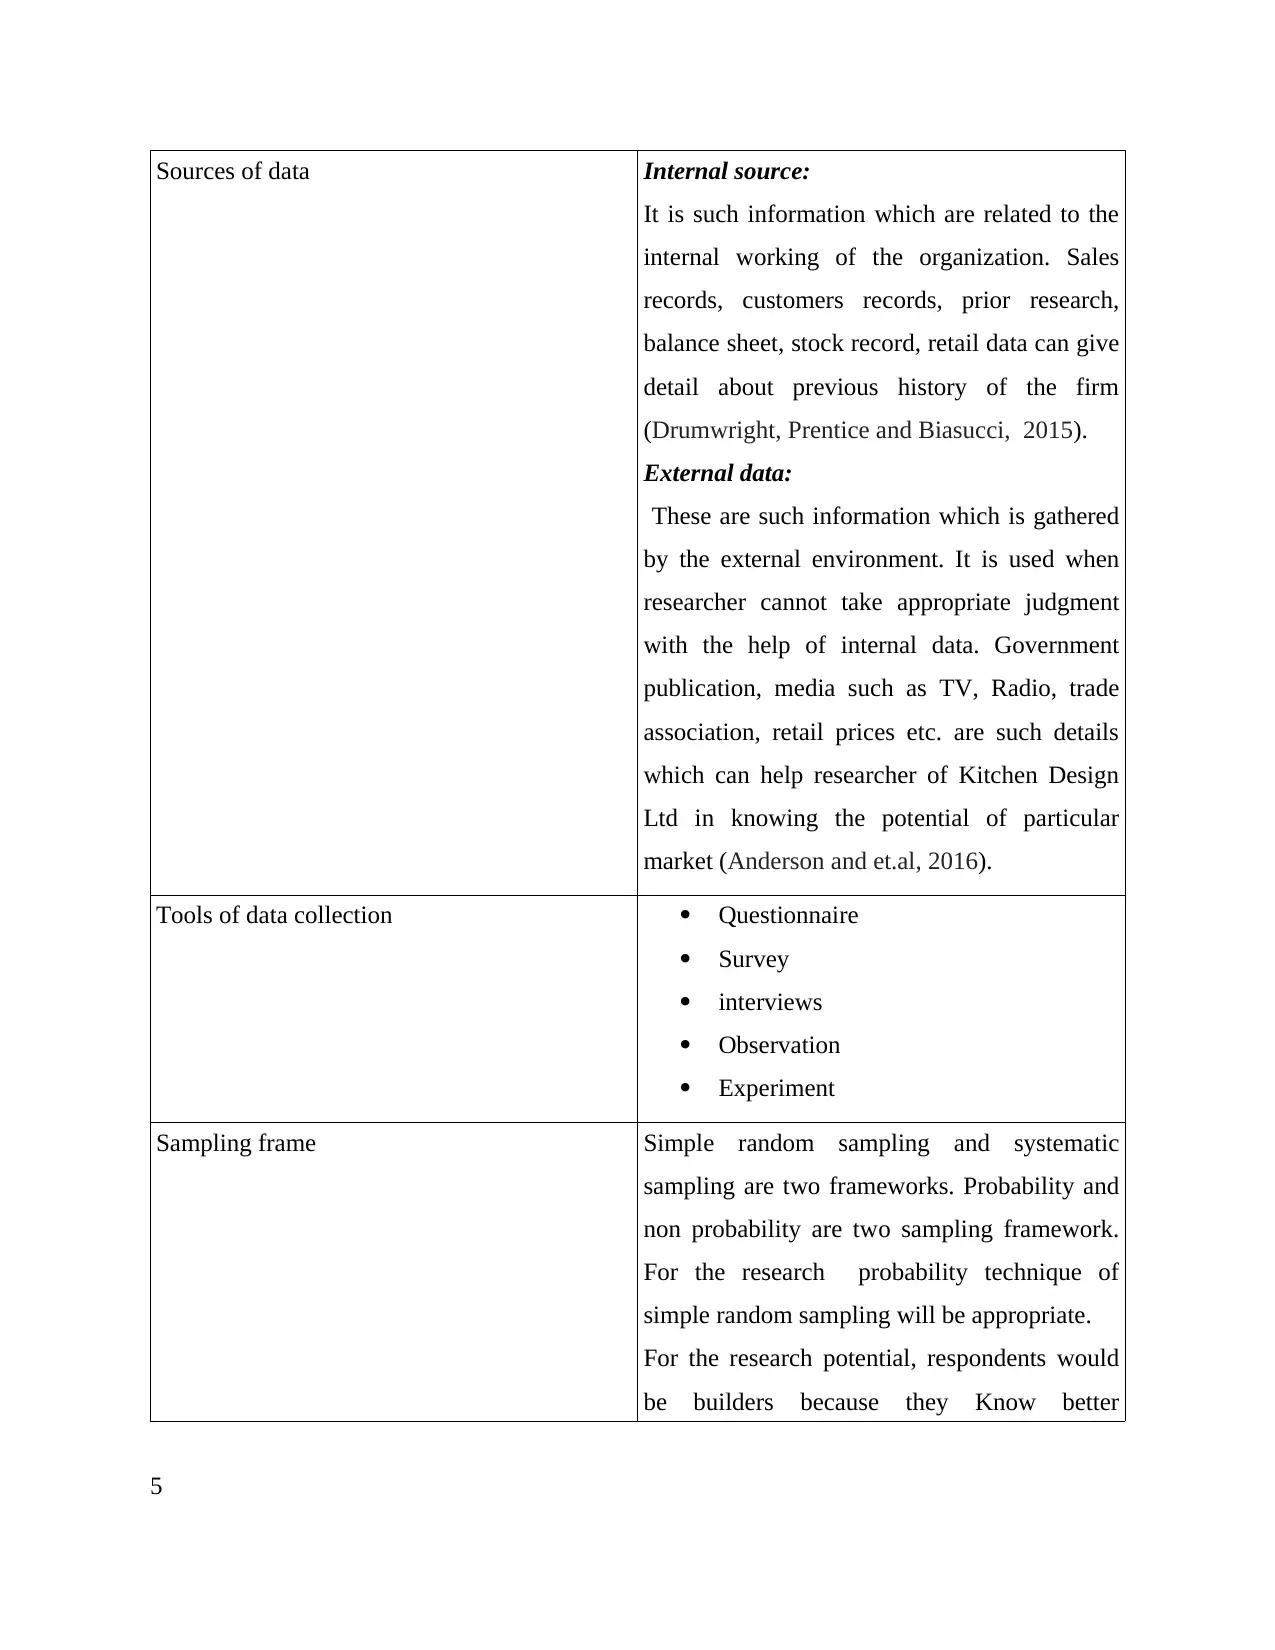
Sources of data Internal source:
It is such information which are related to the
internal working of the organization. Sales
records, customers records, prior research,
balance sheet, stock record, retail data can give
detail about previous history of the firm
(Drumwright, Prentice and Biasucci, 2015).
External data:
These are such information which is gathered
by the external environment. It is used when
researcher cannot take appropriate judgment
with the help of internal data. Government
publication, media such as TV, Radio, trade
association, retail prices etc. are such details
which can help researcher of Kitchen Design
Ltd in knowing the potential of particular
market (Anderson and et.al, 2016).
Tools of data collection Questionnaire
Survey
interviews
Observation
Experiment
Sampling frame Simple random sampling and systematic
sampling are two frameworks. Probability and
non probability are two sampling framework.
For the research probability technique of
simple random sampling will be appropriate.
For the research potential, respondents would
be builders because they Know better
5
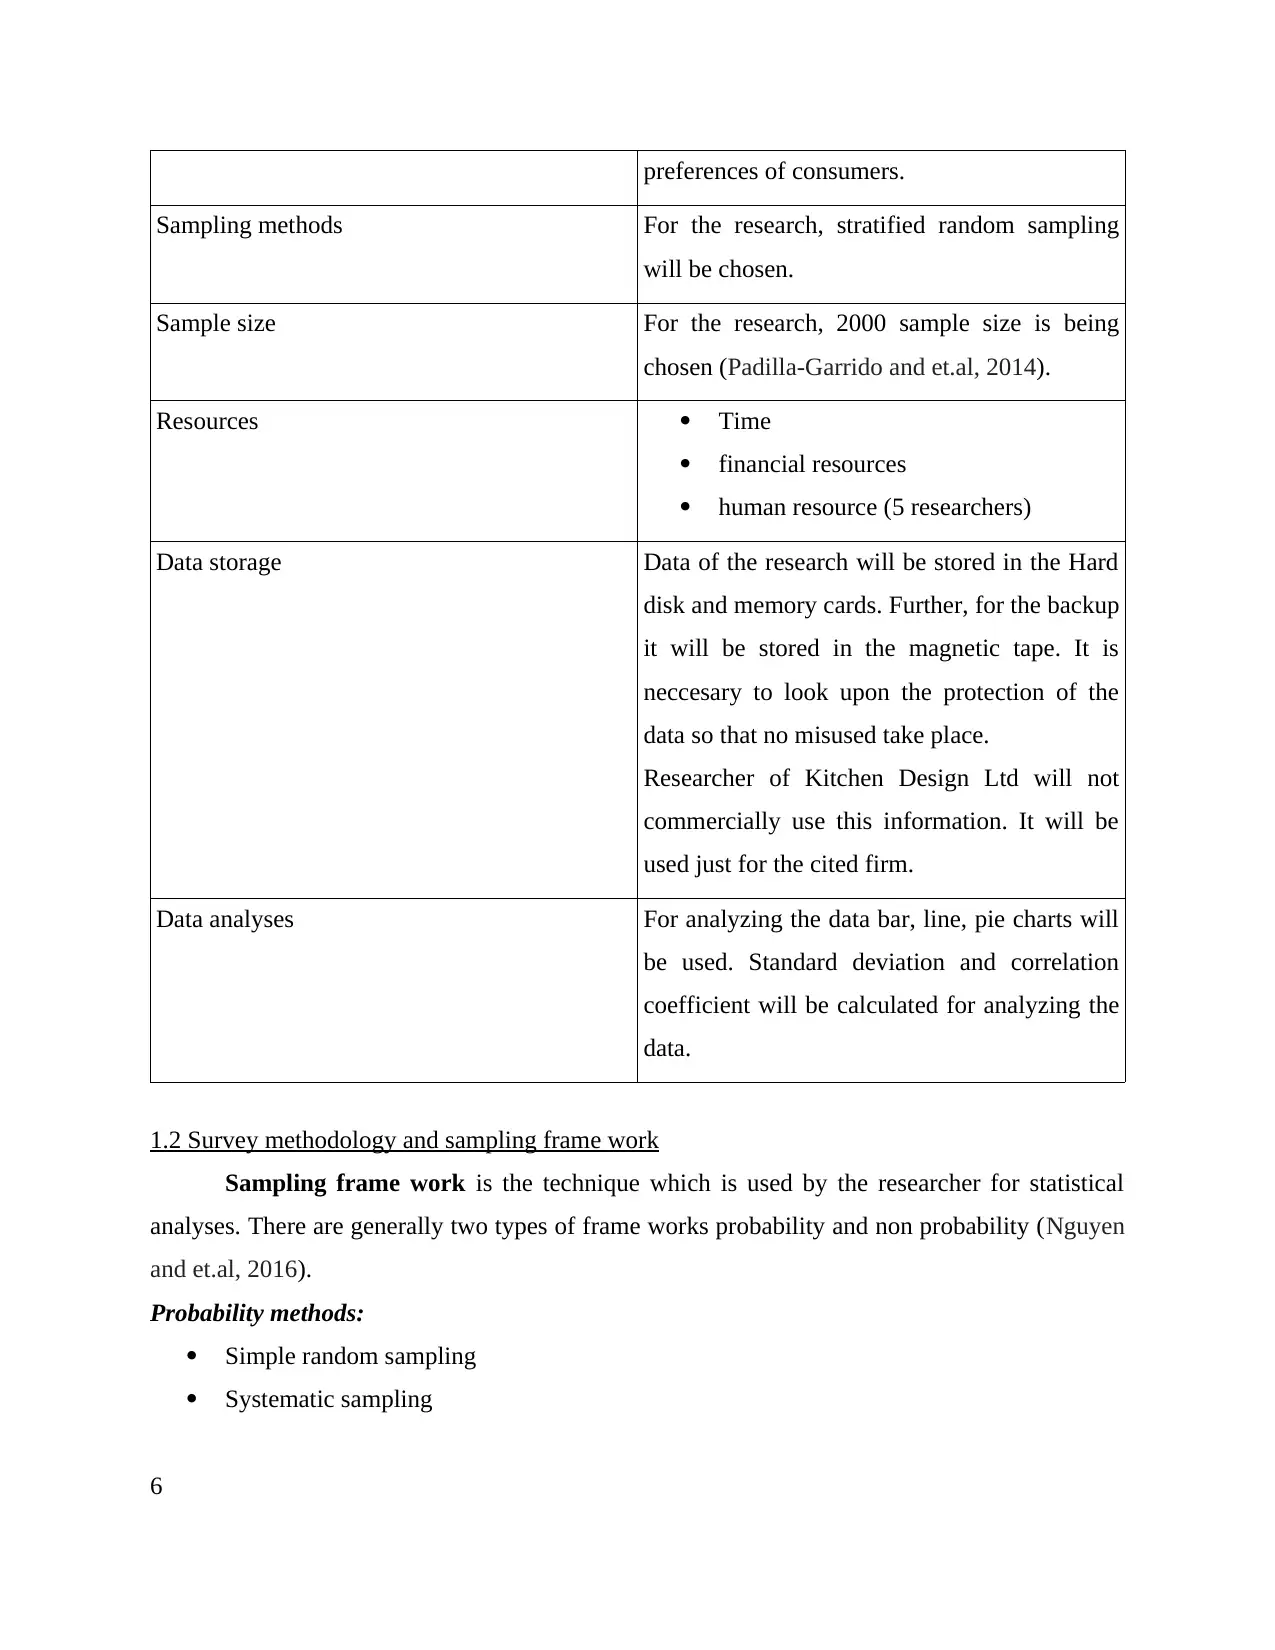
preferences of consumers.
Sampling methods For the research, stratified random sampling
will be chosen.
Sample size For the research, 2000 sample size is being
chosen (Padilla-Garrido and et.al, 2014).
Resources Time
financial resources
human resource (5 researchers)
Data storage Data of the research will be stored in the Hard
disk and memory cards. Further, for the backup
it will be stored in the magnetic tape. It is
neccesary to look upon the protection of the
data so that no misused take place.
Researcher of Kitchen Design Ltd will not
commercially use this information. It will be
used just for the cited firm.
Data analyses For analyzing the data bar, line, pie charts will
be used. Standard deviation and correlation
coefficient will be calculated for analyzing the
data.
1.2 Survey methodology and sampling frame work
Sampling frame work is the technique which is used by the researcher for statistical
analyses. There are generally two types of frame works probability and non probability (Nguyen
and et.al, 2016).
Probability methods:
Simple random sampling
Systematic sampling
6
⊘ This is a preview!⊘
Do you want full access?
Subscribe today to unlock all pages.
Trusted by 1+ million students worldwide
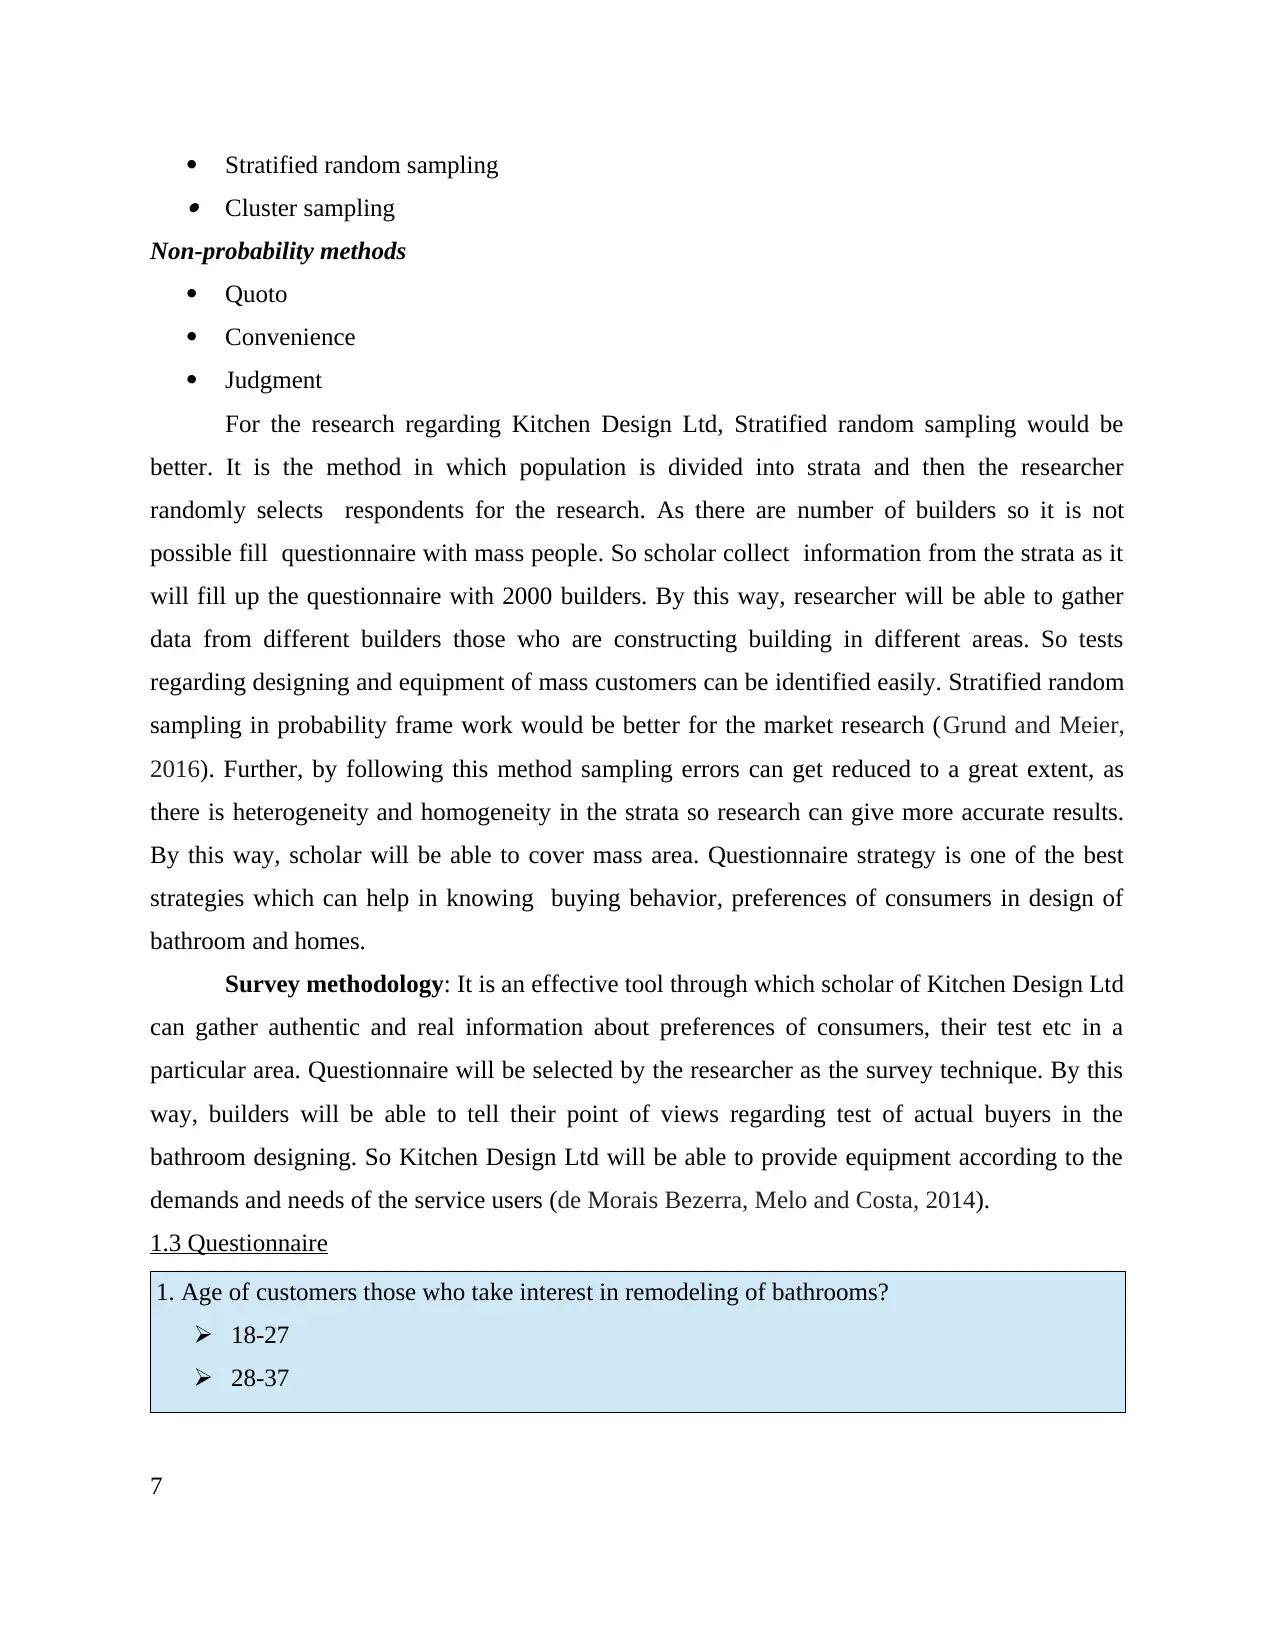
Stratified random sampling Cluster sampling
Non-probability methods
Quoto
Convenience
Judgment
For the research regarding Kitchen Design Ltd, Stratified random sampling would be
better. It is the method in which population is divided into strata and then the researcher
randomly selects respondents for the research. As there are number of builders so it is not
possible fill questionnaire with mass people. So scholar collect information from the strata as it
will fill up the questionnaire with 2000 builders. By this way, researcher will be able to gather
data from different builders those who are constructing building in different areas. So tests
regarding designing and equipment of mass customers can be identified easily. Stratified random
sampling in probability frame work would be better for the market research (Grund and Meier,
2016). Further, by following this method sampling errors can get reduced to a great extent, as
there is heterogeneity and homogeneity in the strata so research can give more accurate results.
By this way, scholar will be able to cover mass area. Questionnaire strategy is one of the best
strategies which can help in knowing buying behavior, preferences of consumers in design of
bathroom and homes.
Survey methodology: It is an effective tool through which scholar of Kitchen Design Ltd
can gather authentic and real information about preferences of consumers, their test etc in a
particular area. Questionnaire will be selected by the researcher as the survey technique. By this
way, builders will be able to tell their point of views regarding test of actual buyers in the
bathroom designing. So Kitchen Design Ltd will be able to provide equipment according to the
demands and needs of the service users (de Morais Bezerra, Melo and Costa, 2014).
1.3 Questionnaire
1. Age of customers those who take interest in remodeling of bathrooms?
18-27
28-37
7
Paraphrase This Document
Need a fresh take? Get an instant paraphrase of this document with our AI Paraphraser
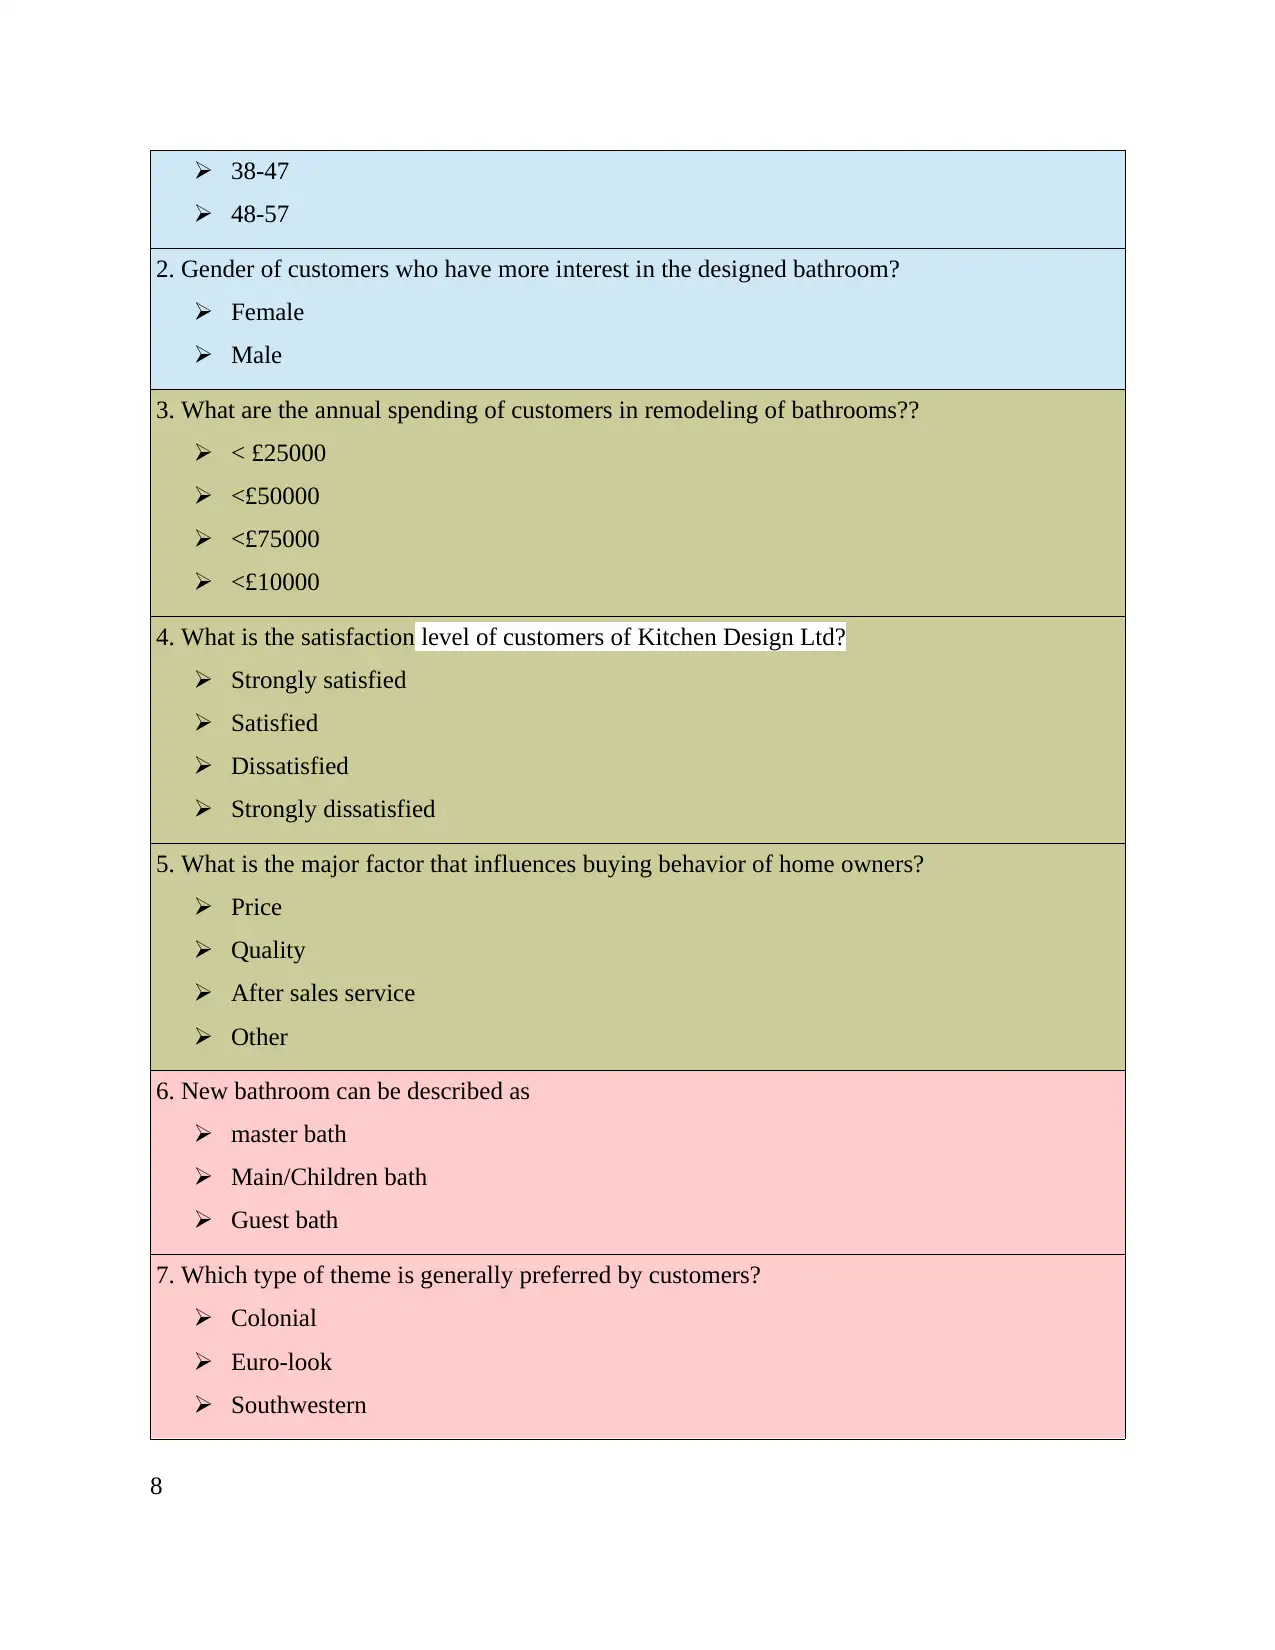
38-47
48-57
2. Gender of customers who have more interest in the designed bathroom?
Female
Male
3. What are the annual spending of customers in remodeling of bathrooms??
< £25000
<£50000
<£75000
<£10000
4. What is the satisfaction level of customers of Kitchen Design Ltd?
Strongly satisfied
Satisfied
Dissatisfied
Strongly dissatisfied
5. What is the major factor that influences buying behavior of home owners?
Price
Quality
After sales service
Other
6. New bathroom can be described as
master bath
Main/Children bath
Guest bath
7. Which type of theme is generally preferred by customers?
Colonial
Euro-look
Southwestern
8
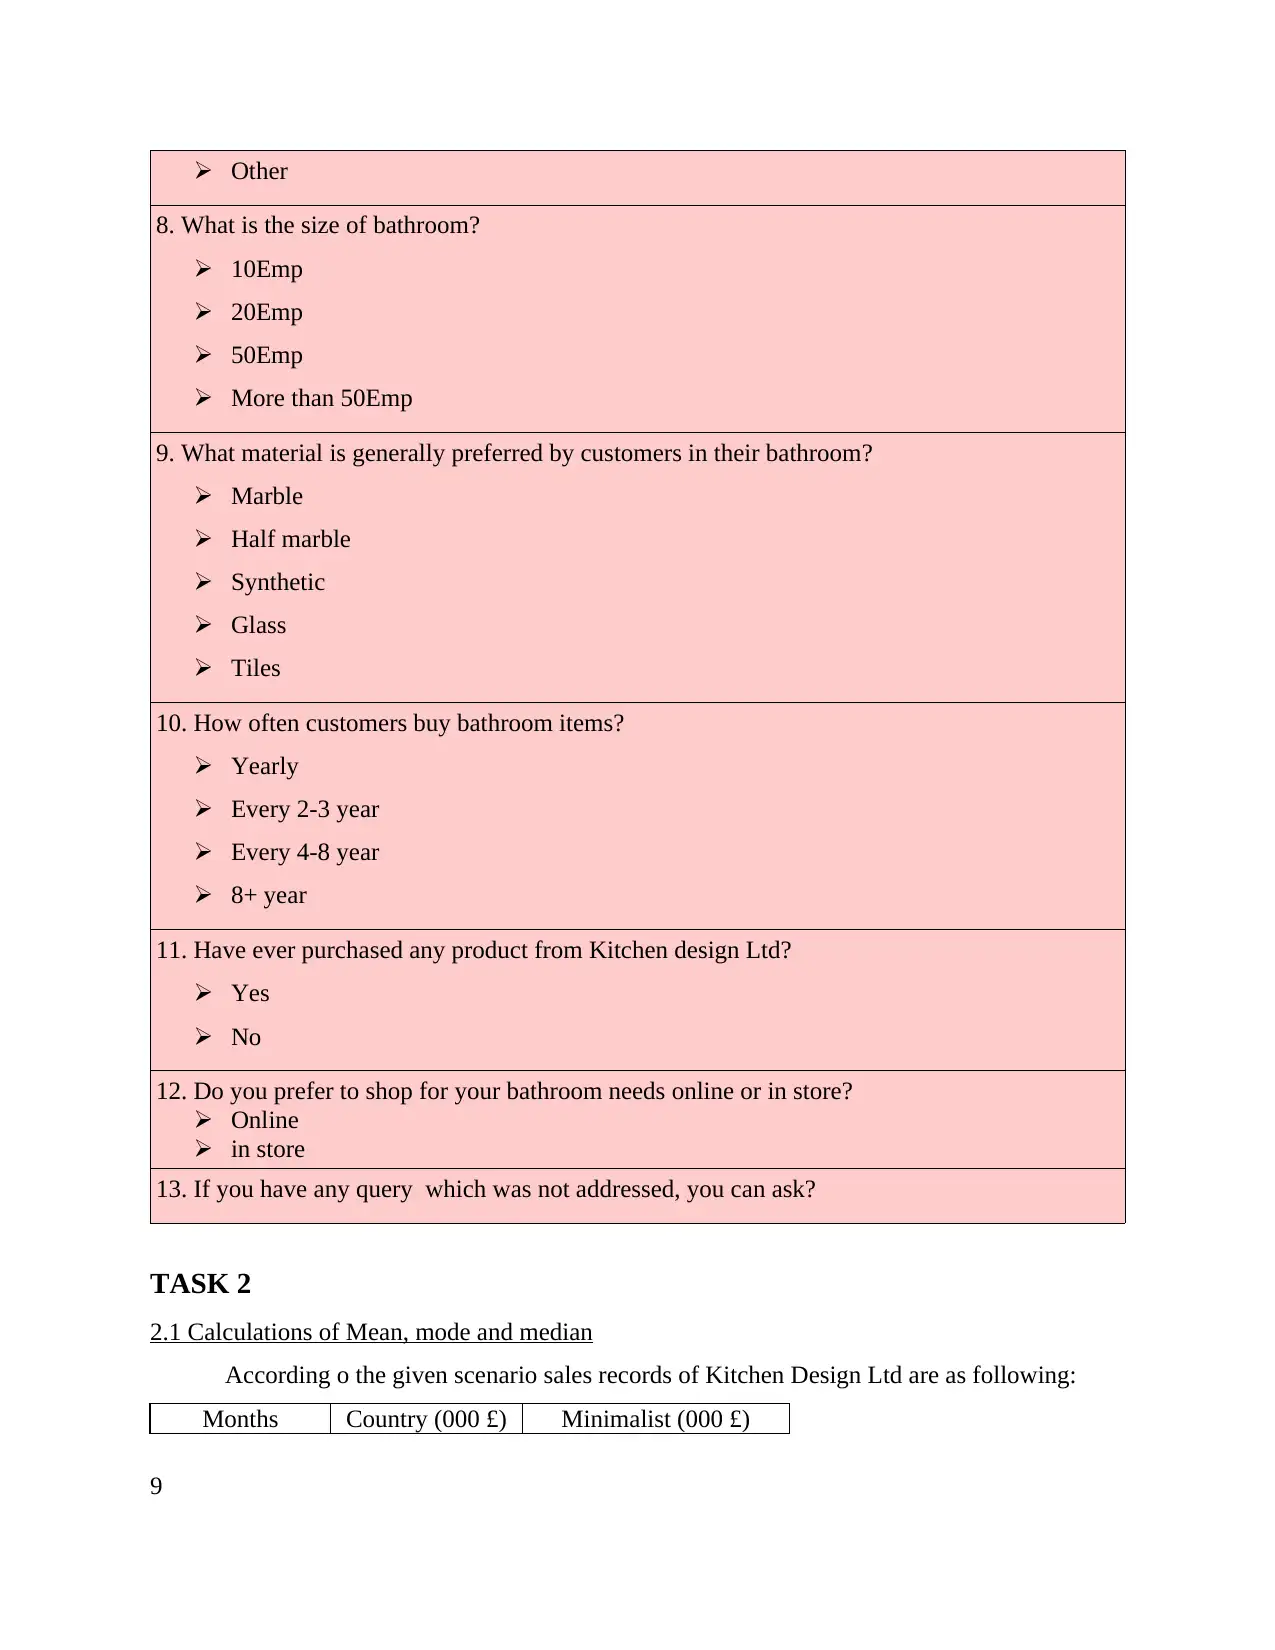
Other
8. What is the size of bathroom?
10Emp
20Emp
50Emp
More than 50Emp
9. What material is generally preferred by customers in their bathroom?
Marble
Half marble
Synthetic
Glass
Tiles
10. How often customers buy bathroom items?
Yearly
Every 2-3 year
Every 4-8 year
8+ year
11. Have ever purchased any product from Kitchen design Ltd?
Yes
No
12. Do you prefer to shop for your bathroom needs online or in store?
Online
in store
13. If you have any query which was not addressed, you can ask?
TASK 2
2.1 Calculations of Mean, mode and median
According o the given scenario sales records of Kitchen Design Ltd are as following:
Months Country (000 £) Minimalist (000 £)
9
⊘ This is a preview!⊘
Do you want full access?
Subscribe today to unlock all pages.
Trusted by 1+ million students worldwide
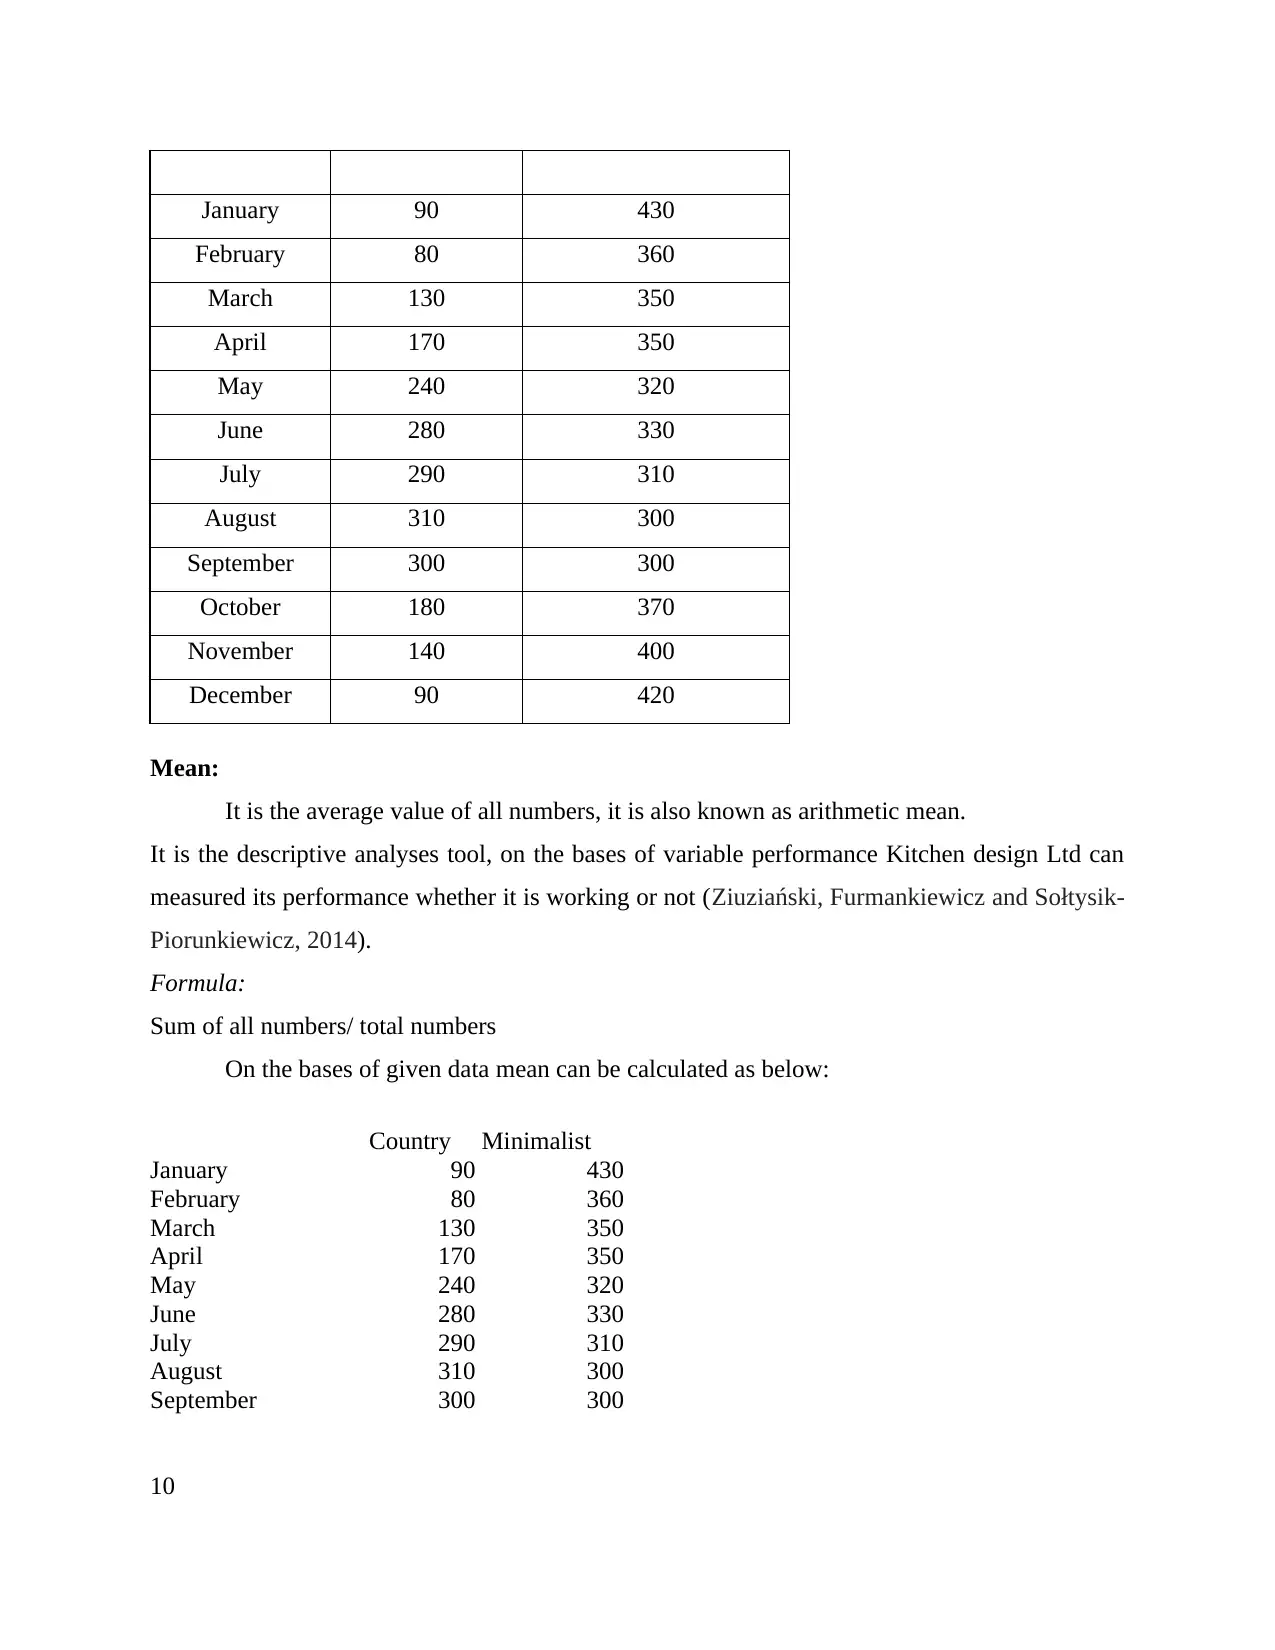
January 90 430
February 80 360
March 130 350
April 170 350
May 240 320
June 280 330
July 290 310
August 310 300
September 300 300
October 180 370
November 140 400
December 90 420
Mean:
It is the average value of all numbers, it is also known as arithmetic mean.
It is the descriptive analyses tool, on the bases of variable performance Kitchen design Ltd can
measured its performance whether it is working or not (Ziuziański, Furmankiewicz and Sołtysik-
Piorunkiewicz, 2014).
Formula:
Sum of all numbers/ total numbers
On the bases of given data mean can be calculated as below:
Country Minimalist
January 90 430
February 80 360
March 130 350
April 170 350
May 240 320
June 280 330
July 290 310
August 310 300
September 300 300
10
February 80 360
March 130 350
April 170 350
May 240 320
June 280 330
July 290 310
August 310 300
September 300 300
October 180 370
November 140 400
December 90 420
Mean:
It is the average value of all numbers, it is also known as arithmetic mean.
It is the descriptive analyses tool, on the bases of variable performance Kitchen design Ltd can
measured its performance whether it is working or not (Ziuziański, Furmankiewicz and Sołtysik-
Piorunkiewicz, 2014).
Formula:
Sum of all numbers/ total numbers
On the bases of given data mean can be calculated as below:
Country Minimalist
January 90 430
February 80 360
March 130 350
April 170 350
May 240 320
June 280 330
July 290 310
August 310 300
September 300 300
10
Paraphrase This Document
Need a fresh take? Get an instant paraphrase of this document with our AI Paraphraser
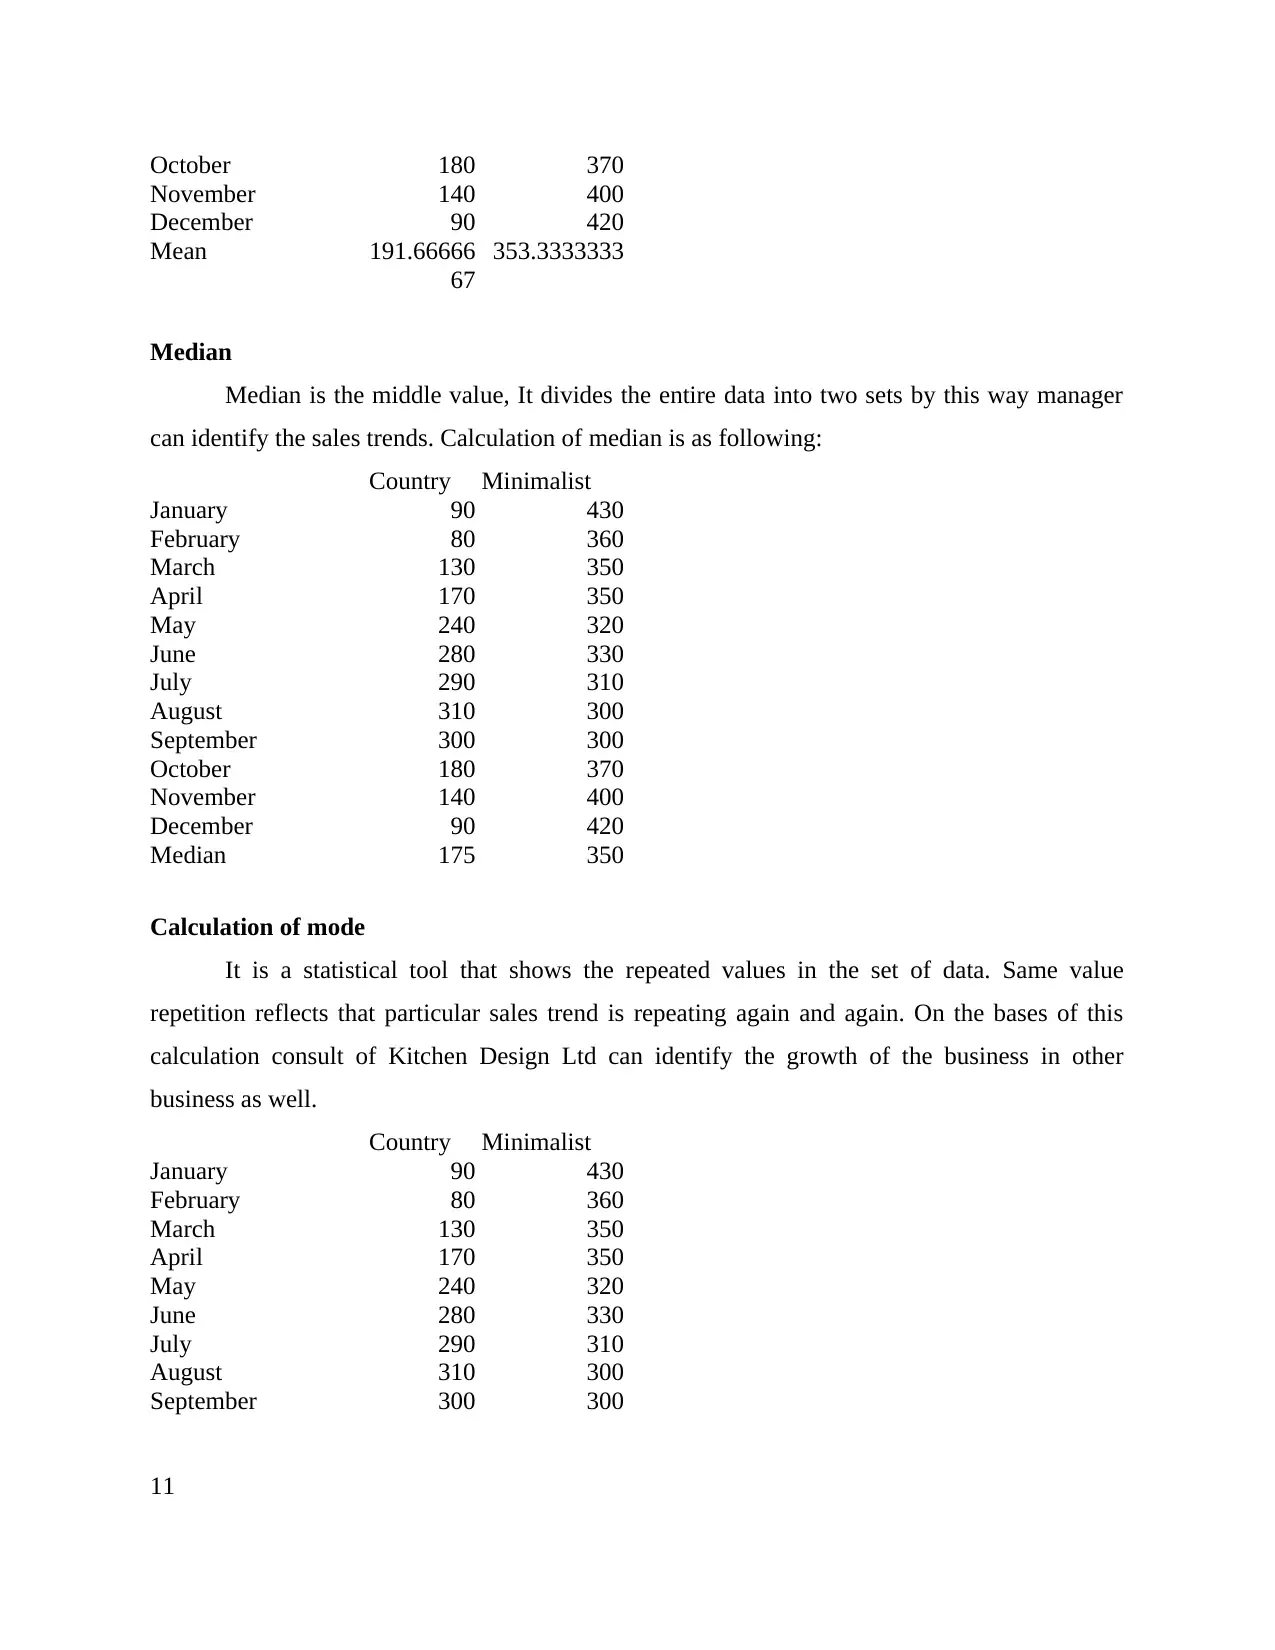
October 180 370
November 140 400
December 90 420
Mean 191.66666
67
353.3333333
Median
Median is the middle value, It divides the entire data into two sets by this way manager
can identify the sales trends. Calculation of median is as following:
Country Minimalist
January 90 430
February 80 360
March 130 350
April 170 350
May 240 320
June 280 330
July 290 310
August 310 300
September 300 300
October 180 370
November 140 400
December 90 420
Median 175 350
Calculation of mode
It is a statistical tool that shows the repeated values in the set of data. Same value
repetition reflects that particular sales trend is repeating again and again. On the bases of this
calculation consult of Kitchen Design Ltd can identify the growth of the business in other
business as well.
Country Minimalist
January 90 430
February 80 360
March 130 350
April 170 350
May 240 320
June 280 330
July 290 310
August 310 300
September 300 300
11
November 140 400
December 90 420
Mean 191.66666
67
353.3333333
Median
Median is the middle value, It divides the entire data into two sets by this way manager
can identify the sales trends. Calculation of median is as following:
Country Minimalist
January 90 430
February 80 360
March 130 350
April 170 350
May 240 320
June 280 330
July 290 310
August 310 300
September 300 300
October 180 370
November 140 400
December 90 420
Median 175 350
Calculation of mode
It is a statistical tool that shows the repeated values in the set of data. Same value
repetition reflects that particular sales trend is repeating again and again. On the bases of this
calculation consult of Kitchen Design Ltd can identify the growth of the business in other
business as well.
Country Minimalist
January 90 430
February 80 360
March 130 350
April 170 350
May 240 320
June 280 330
July 290 310
August 310 300
September 300 300
11
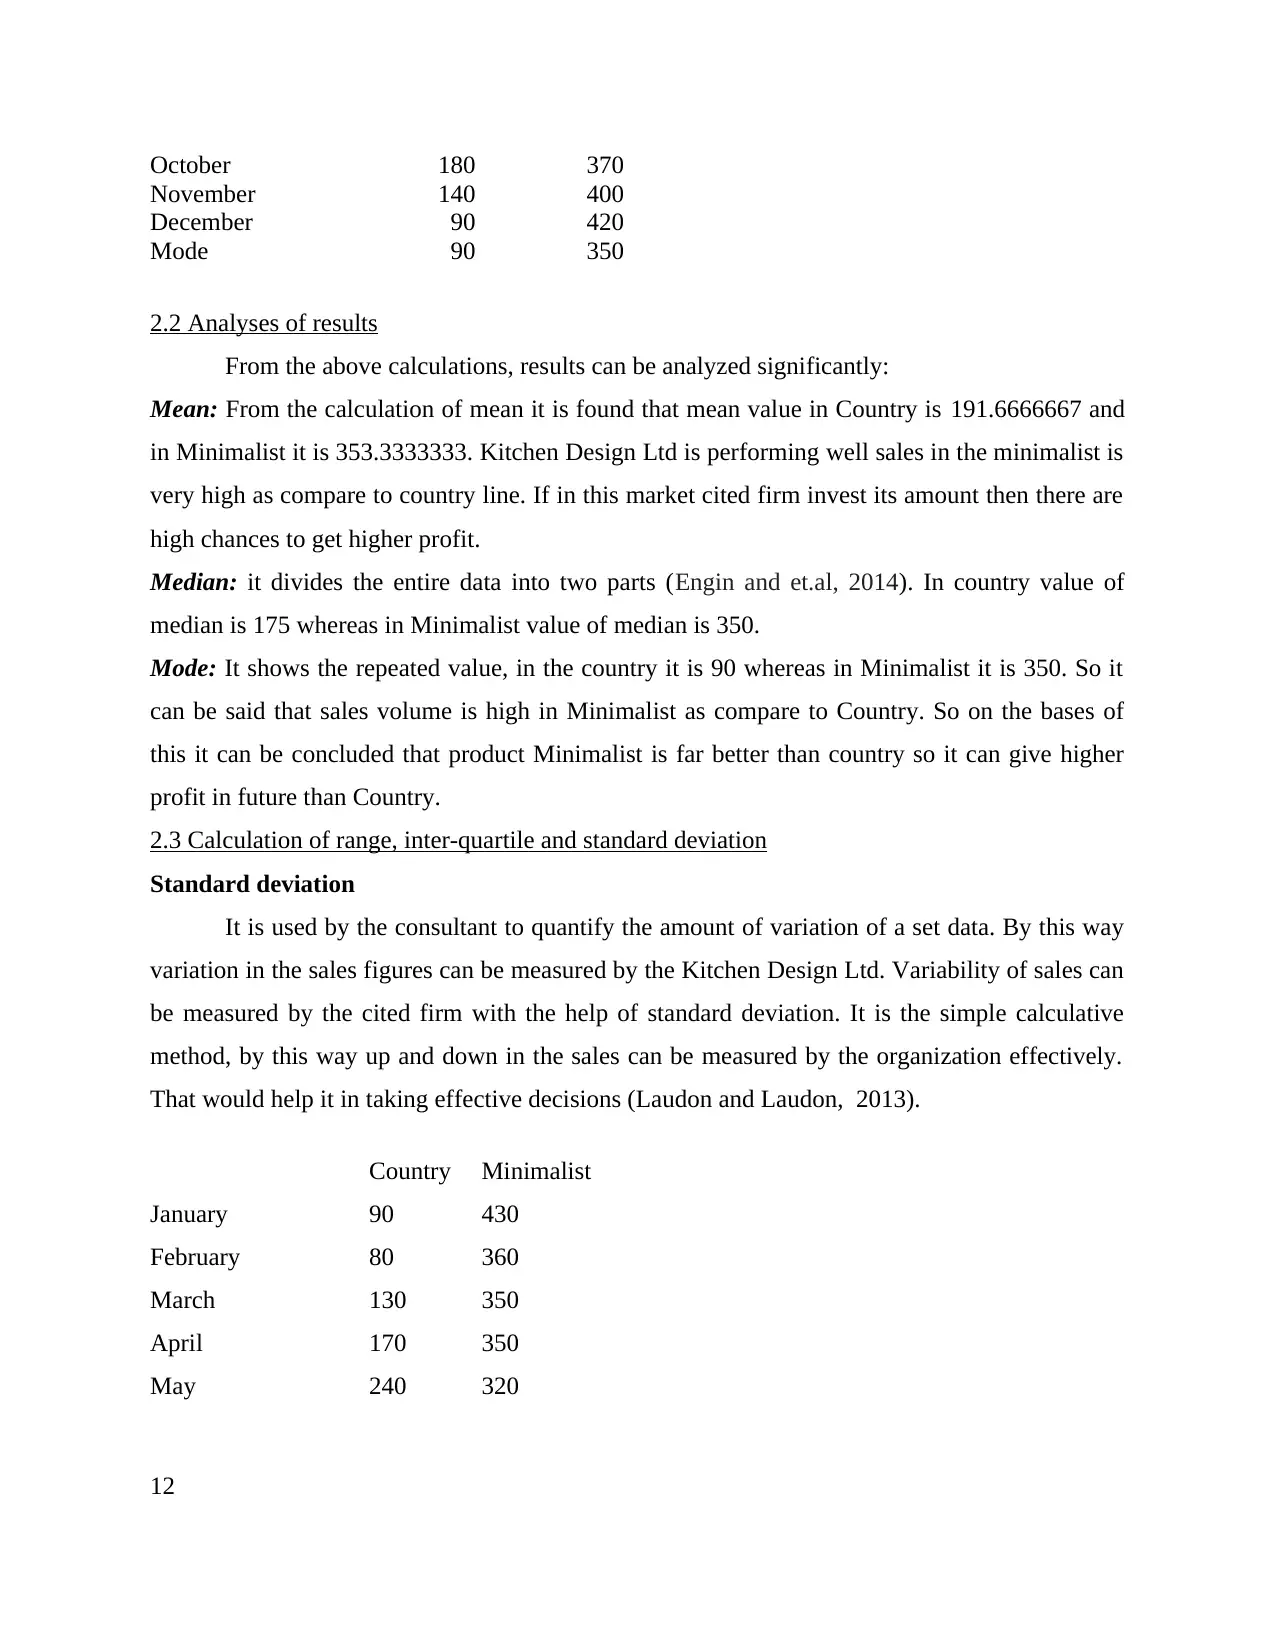
October 180 370
November 140 400
December 90 420
Mode 90 350
2.2 Analyses of results
From the above calculations, results can be analyzed significantly:
Mean: From the calculation of mean it is found that mean value in Country is 191.6666667 and
in Minimalist it is 353.3333333. Kitchen Design Ltd is performing well sales in the minimalist is
very high as compare to country line. If in this market cited firm invest its amount then there are
high chances to get higher profit.
Median: it divides the entire data into two parts (Engin and et.al, 2014). In country value of
median is 175 whereas in Minimalist value of median is 350.
Mode: It shows the repeated value, in the country it is 90 whereas in Minimalist it is 350. So it
can be said that sales volume is high in Minimalist as compare to Country. So on the bases of
this it can be concluded that product Minimalist is far better than country so it can give higher
profit in future than Country.
2.3 Calculation of range, inter-quartile and standard deviation
Standard deviation
It is used by the consultant to quantify the amount of variation of a set data. By this way
variation in the sales figures can be measured by the Kitchen Design Ltd. Variability of sales can
be measured by the cited firm with the help of standard deviation. It is the simple calculative
method, by this way up and down in the sales can be measured by the organization effectively.
That would help it in taking effective decisions (Laudon and Laudon, 2013).
Country Minimalist
January 90 430
February 80 360
March 130 350
April 170 350
May 240 320
12
⊘ This is a preview!⊘
Do you want full access?
Subscribe today to unlock all pages.
Trusted by 1+ million students worldwide
1 out of 31
Related Documents


Your All-in-One AI-Powered Toolkit for Academic Success.
+13062052269
info@desklib.com
Available 24*7 on WhatsApp / Email
![[object Object]](/_next/static/media/star-bottom.7253800d.svg)
Unlock your academic potential
Copyright © 2020–2026 A2Z Services. All Rights Reserved. Developed and managed by ZUCOL.