Business Decision Making Report: Crossrail Project and Carmen Project
VerifiedAdded on 2019/12/03
|23
|4732
|156
Report
AI Summary
This report delves into the intricacies of business decision-making, using the Crossrail project (a large-scale infrastructure endeavor) and the Carmen project (focusing on in-store promotion) as case studies. The report is structured into four tasks. Task 1 focuses on the background, rationale, objectives, and methodology of the research, including data collection methods, sampling techniques, and budget considerations. Task 2 involves descriptive data analysis, including mean, median, mode, range, standard deviation, percentiles, and correlation coefficients, applied to customer spending data. Task 3 covers graphical representations of data, such as line graphs and scatter plots, along with trend line analysis and the creation of business presentations and a formal business report. Task 4 encompasses project management techniques, including network diagrams, critical path analysis, Gantt charts, and the calculation of Net Present Value (NPV) and Internal Rate of Return (IRR) for project evaluation, culminating in recommendations for business strategies. The report integrates both qualitative and quantitative data analysis to provide a comprehensive understanding of the decision-making processes and project outcomes.

BUSINESS DECISION
MAKING
MAKING
Paraphrase This Document
Need a fresh take? Get an instant paraphrase of this document with our AI Paraphraser
TABLE OF CONTENTS
INTRODUCTION...........................................................................................................................4
TASK 1............................................................................................................................................4
Background of the study..............................................................................................................4
Rationale......................................................................................................................................4
Objectives of the research............................................................................................................5
Methodology................................................................................................................................5
Data analysis section....................................................................................................................5
Timeframe....................................................................................................................................5
Budget section for the research....................................................................................................6
Designing questionnaire..............................................................................................................6
TASK 2............................................................................................................................................8
Mean, median and mode..............................................................................................................8
Range and standard deviation......................................................................................................9
25th Percentile (Lower Quartile) and 75th Percentile (Upper Quartile) and explain the use of
Percentile...................................................................................................................................10
Interquartile range......................................................................................................................10
Correlation coefficient...............................................................................................................10
TASK 3..........................................................................................................................................11
Line graph..................................................................................................................................11
Scatter Plot on Advertising and Sales Costs..............................................................................13
Trend lines.................................................................................................................................14
Business presentation.................................................................................................................15
Formal business report...............................................................................................................15
TASK 4..........................................................................................................................................16
Task4 A..........................................................................................................................................16
Network diagram.......................................................................................................................16
Calculation of the project duration............................................................................................17
Critical path...............................................................................................................................19
Gantt chart and its benefits as a project management tool........................................................20
Task 4B..........................................................................................................................................20
1. Calculation of NPV and IRR of project A and B..................................................................20
2. Recommendations..................................................................................................................23
CONCLUSION..............................................................................................................................24
⊘ This is a preview!⊘
Do you want full access?
Subscribe today to unlock all pages.
Trusted by 1+ million students worldwide
INTRODUCTION
Business decision making plays most crucial role as management of every enterprise has
to take different decisions which are linked with growth and development of firm (Hodge and
Austin, 2004.). Further, decisions can be linked with expansion; product development etc which
needs to be taken through proper analysis so that business can be positively benefitted with the
help of this. Moreover, entire process of decision making is supported by collection of primary
and secondary information and it is fruitful for business in every possible manner. Moreover, it
allows organization to easily operate in the competitive market for longer period of time. The
entire study being carried out is based on different scenarios where crossrail service project has
been undertaken which is associated with expansion, Carmen project which is associated with in
store promotion etc. In all the scenarios given business has to take appropriate decisions as they
are linked with development. Further, various tasks have been covered in the study which
involves collection of primary and secondary data, descriptive analysis, designing questionnaire
and budget section for the research.
TASK 1
Background of the study
The present case study provided is based on crossrail services expansion which is one of
the Europe’s largest construction projects which was started in the year May 2009. At present
around 10,000 people are working across 40 construction sites. Crossrail will transform rail
transport in London where capacity will be increased by 10% supporting regeneration and
cutting journey times across the city. Further, through this proper travelling facility will be
granted to around 1.5 million people with the aim to connect their key employment and other key
activities of business to large number of places such as Heathrow etc. It is expected that project
will start in the year 2018 and annual passengers will be 200 million. Funds allocated for
implementing project is £14.8bn.
Rationale
Rationale supports in knowing the main reason due to which the entire project has been
undertaken. So, the present project is based on analysis where government of UK is interested in
knowing the perceived benefit of cross rail project for local community. Regulatory authorities
have invested large amount for implementing this project but government is not at all sure that
weather will be beneficial for the entire community or not. Therefore, it is required for
1
Paraphrase This Document
Need a fresh take? Get an instant paraphrase of this document with our AI Paraphraser
investigator to complete the entire project by evaluating the advantage of crossrail project for
local people living in the society and in other parts of the country. So, to examine the key
benefits of this project is one of the main reasons behind carrying out this study.
Objectives of the research
Following are the objectives set for conducting study and they are as follows:
To identify the key benefits of Crossrail project for local community of central London
To build research plan for carrying out the entire investigation process and collecting
primary along with secondary information linked with the project
To estimate budget along with time required in accomplishing the project
Methodology
For conducting the study in appropriate manner data has been collected from both
sources named primary and secondary for the project of Crossrail. Further, both qualitative and
quantitative methods will be employed for the collection of crucial information. Moreover,
qualitative method is effective as through this it will be possible to know about the behavior of
local community towards Crossrail project. Apart from this, by using quantitative method
investigator can easily obtain data in numeric form and this can assist in knowing the real
benefits of this project for local people living in London (Sapsford and Jupp, 2006). Apart from
this method of qualitative study will support in carrying out survey of all the passengers in
appropriate manner. For collection of primary information investigator has designed
questionnaire keeping in view objectives of the study. Further, for collection of secondary
information various books, journals and online articles have been considered in order to know
the benefits of the Crossrail project.
Sample size of 50 local people has been undertaken from whom overall information has
been collected through which accurate information has been obtained which is fruitful for this
research. This sampling frame is appropriate for the present study as through this it is possible to
accomplish overall aim and objective of the research. On the other hand random sampling
technique has been used where respondents associated with the study have been selected
randomly and there is no such fix criteria present. The main reason behind undertaking this
sampling technique is that through this it is possible to obtain accurate amount of information
which is beneficial for the research. Sample size of 50 is appropriate enough in knowing that
Cross rail project is beneficial for the country like London or not.
2
Data analysis section
In the present study data has been analyzed by using both qualitative and quantitative
technique. Further, the information obtained will be analyzed by forming themes and using
statistical tools. By forming different themes it is possible to know about the response provided
by the respondents and is beneficial in every possible manner.
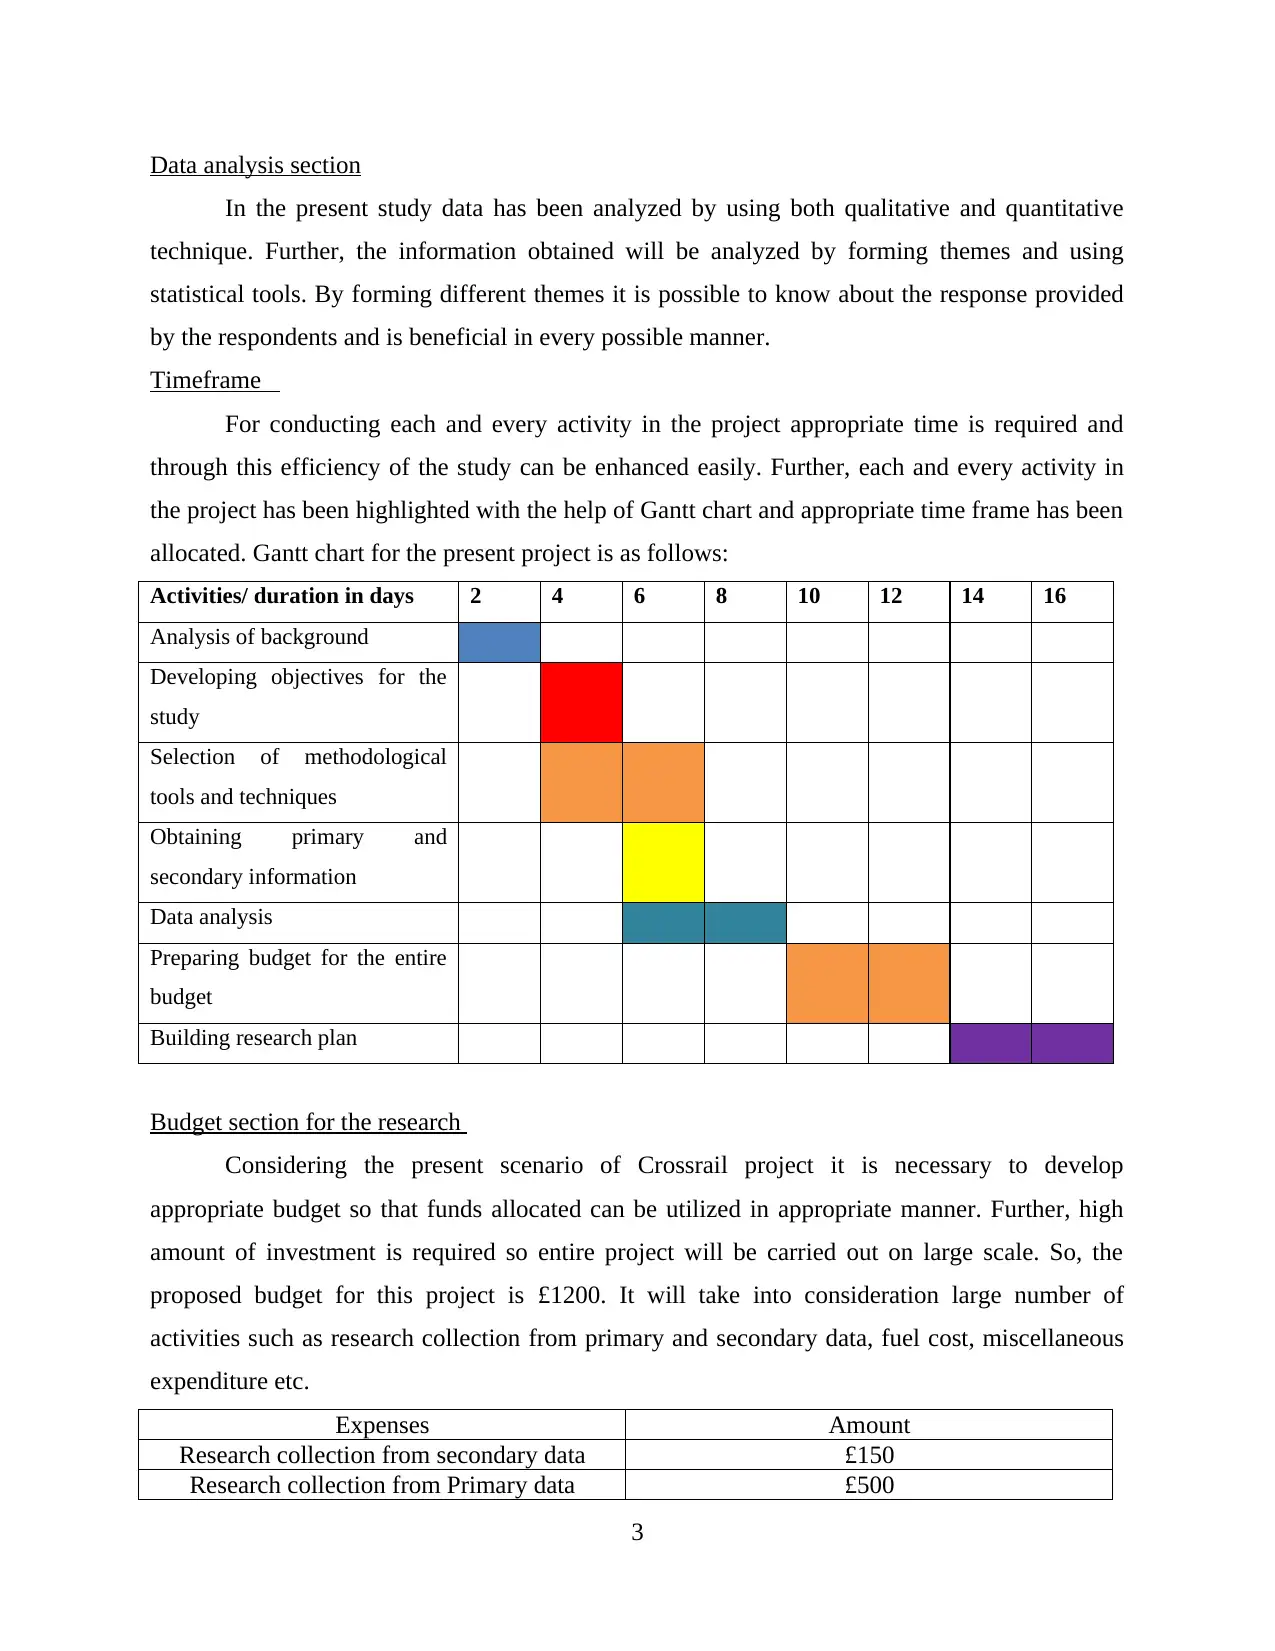
Timeframe
For conducting each and every activity in the project appropriate time is required and
through this efficiency of the study can be enhanced easily. Further, each and every activity in
the project has been highlighted with the help of Gantt chart and appropriate time frame has been
allocated. Gantt chart for the present project is as follows:
Activities/ duration in days 2 4 6 8 10 12 14 16
Analysis of background
Developing objectives for the
study
Selection of methodological
tools and techniques
Obtaining primary and
secondary information
Data analysis
Preparing budget for the entire
budget
Building research plan
Budget section for the research
Considering the present scenario of Crossrail project it is necessary to develop
appropriate budget so that funds allocated can be utilized in appropriate manner. Further, high
amount of investment is required so entire project will be carried out on large scale. So, the
proposed budget for this project is £1200. It will take into consideration large number of
activities such as research collection from primary and secondary data, fuel cost, miscellaneous
expenditure etc.
Expenses Amount
Research collection from secondary data £150
Research collection from Primary data £500
3
In the present study data has been analyzed by using both qualitative and quantitative
technique. Further, the information obtained will be analyzed by forming themes and using
statistical tools. By forming different themes it is possible to know about the response provided
by the respondents and is beneficial in every possible manner.
Timeframe
For conducting each and every activity in the project appropriate time is required and
through this efficiency of the study can be enhanced easily. Further, each and every activity in
the project has been highlighted with the help of Gantt chart and appropriate time frame has been
allocated. Gantt chart for the present project is as follows:
Activities/ duration in days 2 4 6 8 10 12 14 16
Analysis of background
Developing objectives for the
study
Selection of methodological
tools and techniques
Obtaining primary and
secondary information
Data analysis
Preparing budget for the entire
budget
Building research plan
Budget section for the research
Considering the present scenario of Crossrail project it is necessary to develop
appropriate budget so that funds allocated can be utilized in appropriate manner. Further, high
amount of investment is required so entire project will be carried out on large scale. So, the
proposed budget for this project is £1200. It will take into consideration large number of
activities such as research collection from primary and secondary data, fuel cost, miscellaneous
expenditure etc.
Expenses Amount
Research collection from secondary data £150
Research collection from Primary data £500
3
⊘ This is a preview!⊘
Do you want full access?
Subscribe today to unlock all pages.
Trusted by 1+ million students worldwide
Stationary costs £200
Fuel Cost £150
Miscellaneous expenditure £200
Total £1000
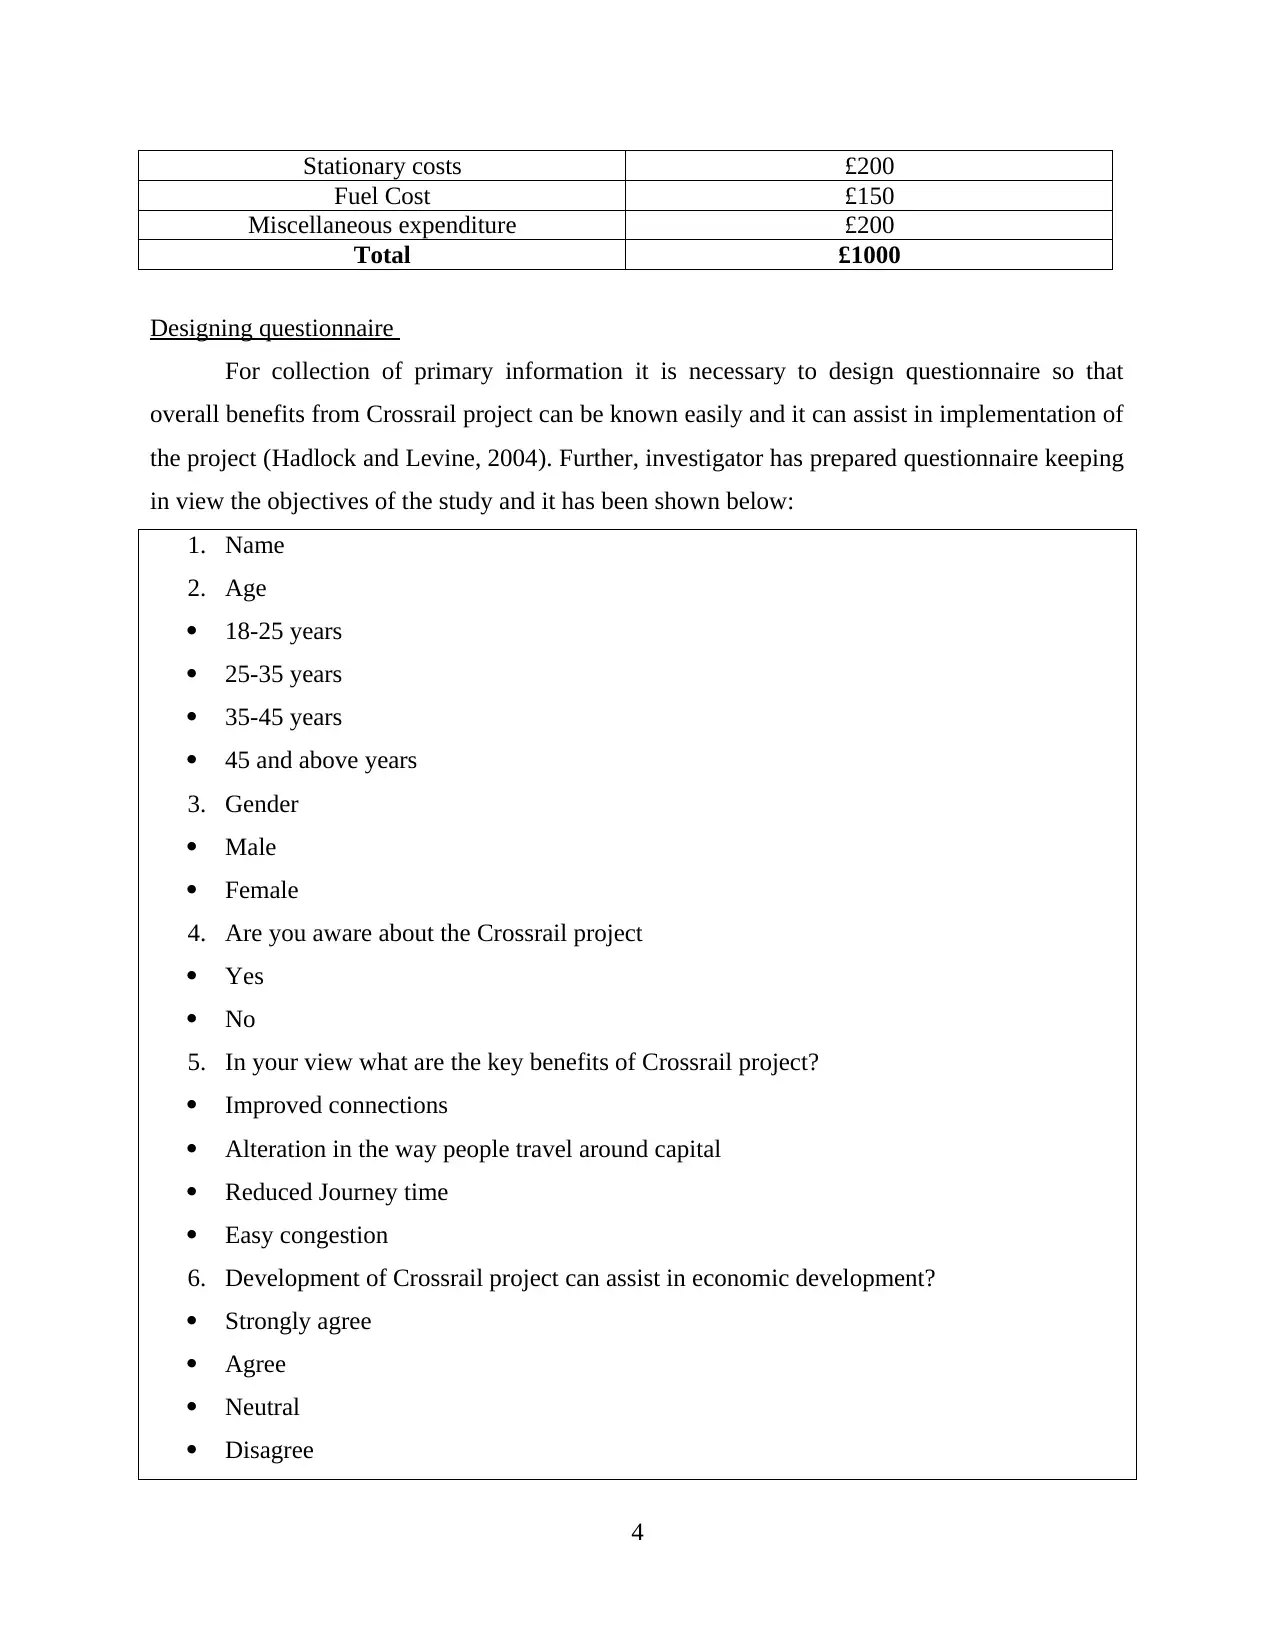
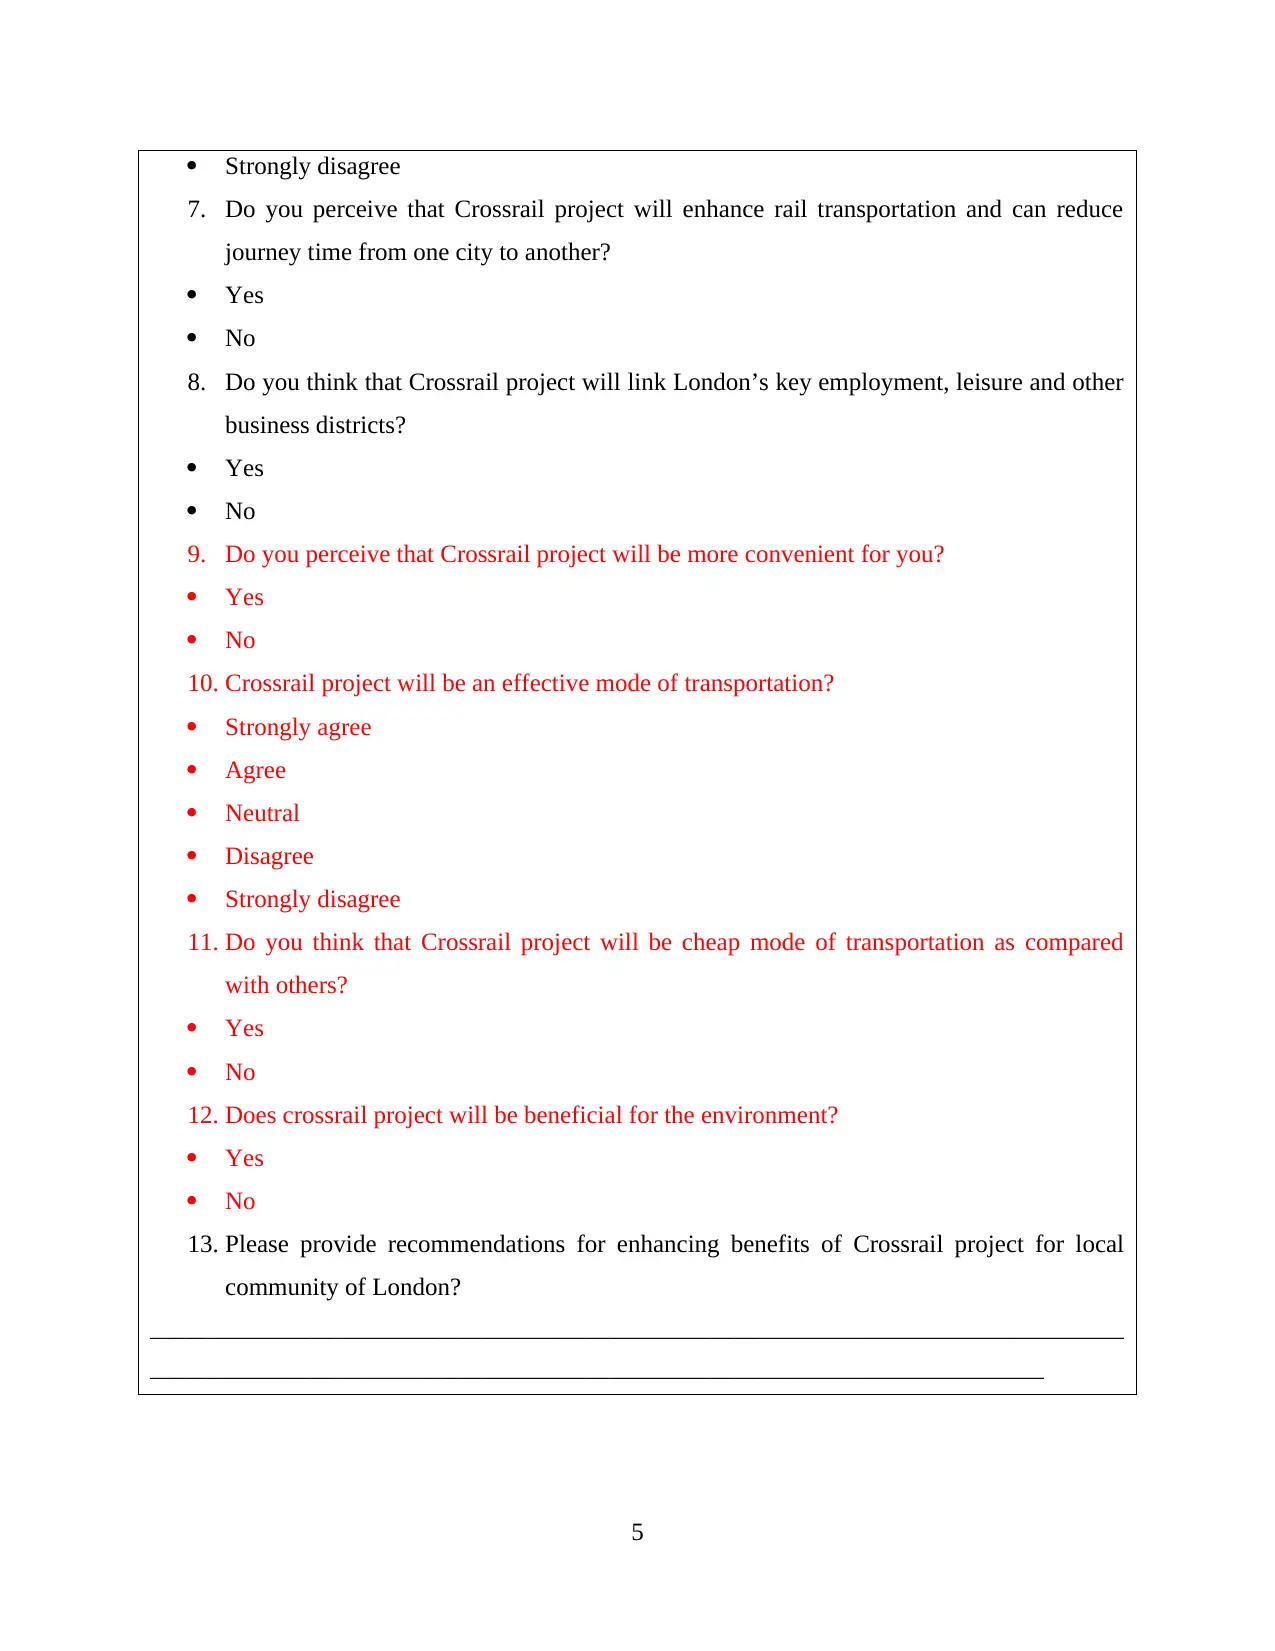
Designing questionnaire
For collection of primary information it is necessary to design questionnaire so that
overall benefits from Crossrail project can be known easily and it can assist in implementation of
the project (Hadlock and Levine, 2004). Further, investigator has prepared questionnaire keeping
in view the objectives of the study and it has been shown below:
1. Name
2. Age
18-25 years
25-35 years
35-45 years
45 and above years
3. Gender
Male
Female
4. Are you aware about the Crossrail project
Yes
No
5. In your view what are the key benefits of Crossrail project?
Improved connections
Alteration in the way people travel around capital
Reduced Journey time
Easy congestion
6. Development of Crossrail project can assist in economic development?
Strongly agree
Agree
Neutral
Disagree
4
Fuel Cost £150
Miscellaneous expenditure £200
Total £1000
Designing questionnaire
For collection of primary information it is necessary to design questionnaire so that
overall benefits from Crossrail project can be known easily and it can assist in implementation of
the project (Hadlock and Levine, 2004). Further, investigator has prepared questionnaire keeping
in view the objectives of the study and it has been shown below:
1. Name
2. Age
18-25 years
25-35 years
35-45 years
45 and above years
3. Gender
Male
Female
4. Are you aware about the Crossrail project
Yes
No
5. In your view what are the key benefits of Crossrail project?
Improved connections
Alteration in the way people travel around capital
Reduced Journey time
Easy congestion
6. Development of Crossrail project can assist in economic development?
Strongly agree
Agree
Neutral
Disagree
4
Paraphrase This Document
Need a fresh take? Get an instant paraphrase of this document with our AI Paraphraser
Strongly disagree
7. Do you perceive that Crossrail project will enhance rail transportation and can reduce
journey time from one city to another?
Yes
No
8. Do you think that Crossrail project will link London’s key employment, leisure and other
business districts?
Yes
No
9. Do you perceive that Crossrail project will be more convenient for you?
Yes
No
10. Crossrail project will be an effective mode of transportation?
Strongly agree
Agree
Neutral
Disagree
Strongly disagree
11. Do you think that Crossrail project will be cheap mode of transportation as compared
with others?
Yes
No
12. Does crossrail project will be beneficial for the environment?
Yes
No
13. Please provide recommendations for enhancing benefits of Crossrail project for local
community of London?
_____________________________________________________________________________________
______________________________________________________________________________
5
TASK 2
Mean, median and mode
Amount Spent
(£)
No. of customers
(f) Mid- value(x) fx
Cumulative Frequency
(CF)
10-20 20 15 300 20
20-30 22 25 550 42
30-40 20 35 700 62
40-50 14 45 630 76
50-60 16 55 880 92
60-70 10 65 650 102
70-80 8 75 600 110
80-90 6 85 510 116
90-100 4 95 380 120
120 5200
Mean ∑FX/n 43.33
Median
L + (n/2-
CF)/f*h 39
Mode
Lmo + (Δ1/
Δ1 + Δ2) * i 25
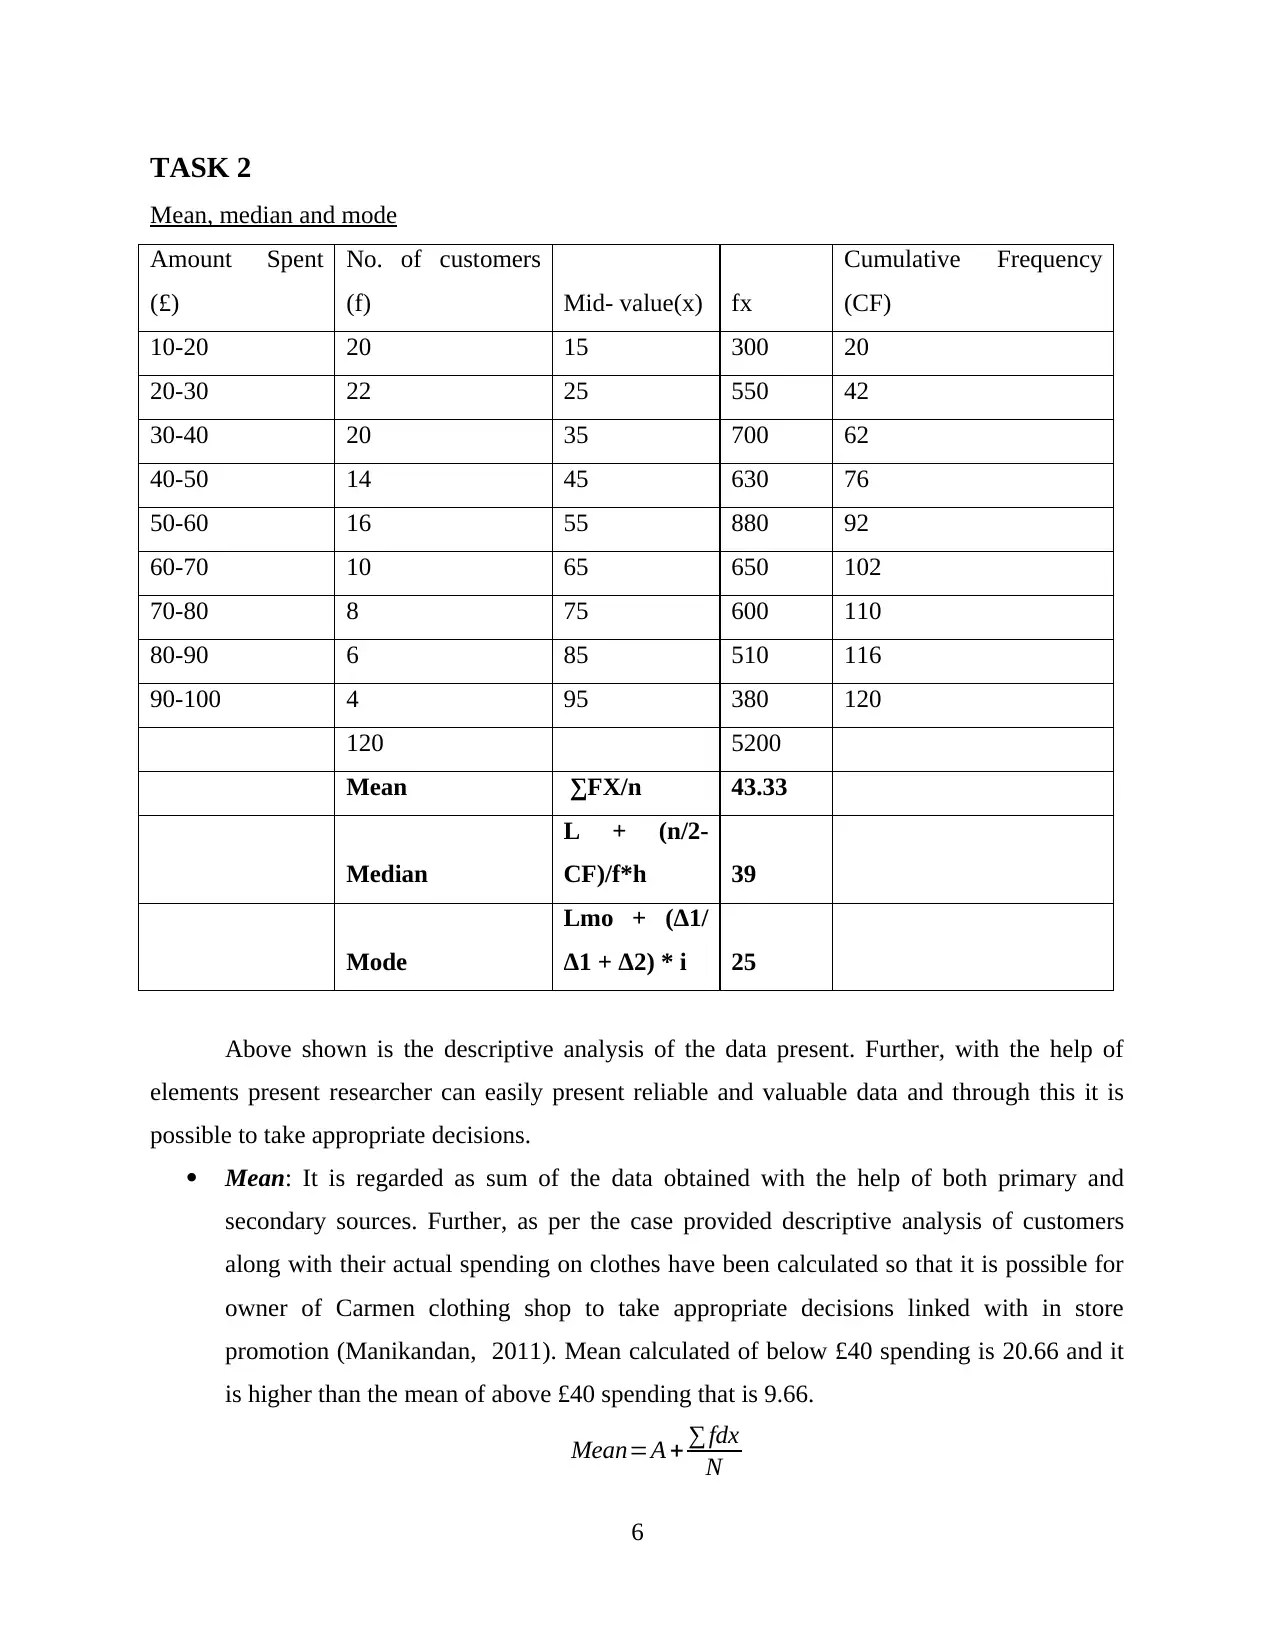
Above shown is the descriptive analysis of the data present. Further, with the help of
elements present researcher can easily present reliable and valuable data and through this it is
possible to take appropriate decisions.
Mean: It is regarded as sum of the data obtained with the help of both primary and
secondary sources. Further, as per the case provided descriptive analysis of customers
along with their actual spending on clothes have been calculated so that it is possible for
owner of Carmen clothing shop to take appropriate decisions linked with in store
promotion (Manikandan, 2011). Mean calculated of below £40 spending is 20.66 and it
is higher than the mean of above £40 spending that is 9.66.
Mean=A + ∑ fdx
N
6
Mean, median and mode
Amount Spent
(£)
No. of customers
(f) Mid- value(x) fx
Cumulative Frequency
(CF)
10-20 20 15 300 20
20-30 22 25 550 42
30-40 20 35 700 62
40-50 14 45 630 76
50-60 16 55 880 92
60-70 10 65 650 102
70-80 8 75 600 110
80-90 6 85 510 116
90-100 4 95 380 120
120 5200
Mean ∑FX/n 43.33
Median
L + (n/2-
CF)/f*h 39
Mode
Lmo + (Δ1/
Δ1 + Δ2) * i 25
Above shown is the descriptive analysis of the data present. Further, with the help of
elements present researcher can easily present reliable and valuable data and through this it is
possible to take appropriate decisions.
Mean: It is regarded as sum of the data obtained with the help of both primary and
secondary sources. Further, as per the case provided descriptive analysis of customers
along with their actual spending on clothes have been calculated so that it is possible for
owner of Carmen clothing shop to take appropriate decisions linked with in store
promotion (Manikandan, 2011). Mean calculated of below £40 spending is 20.66 and it
is higher than the mean of above £40 spending that is 9.66.
Mean=A + ∑ fdx
N
6
⊘ This is a preview!⊘
Do you want full access?
Subscribe today to unlock all pages.
Trusted by 1+ million students worldwide
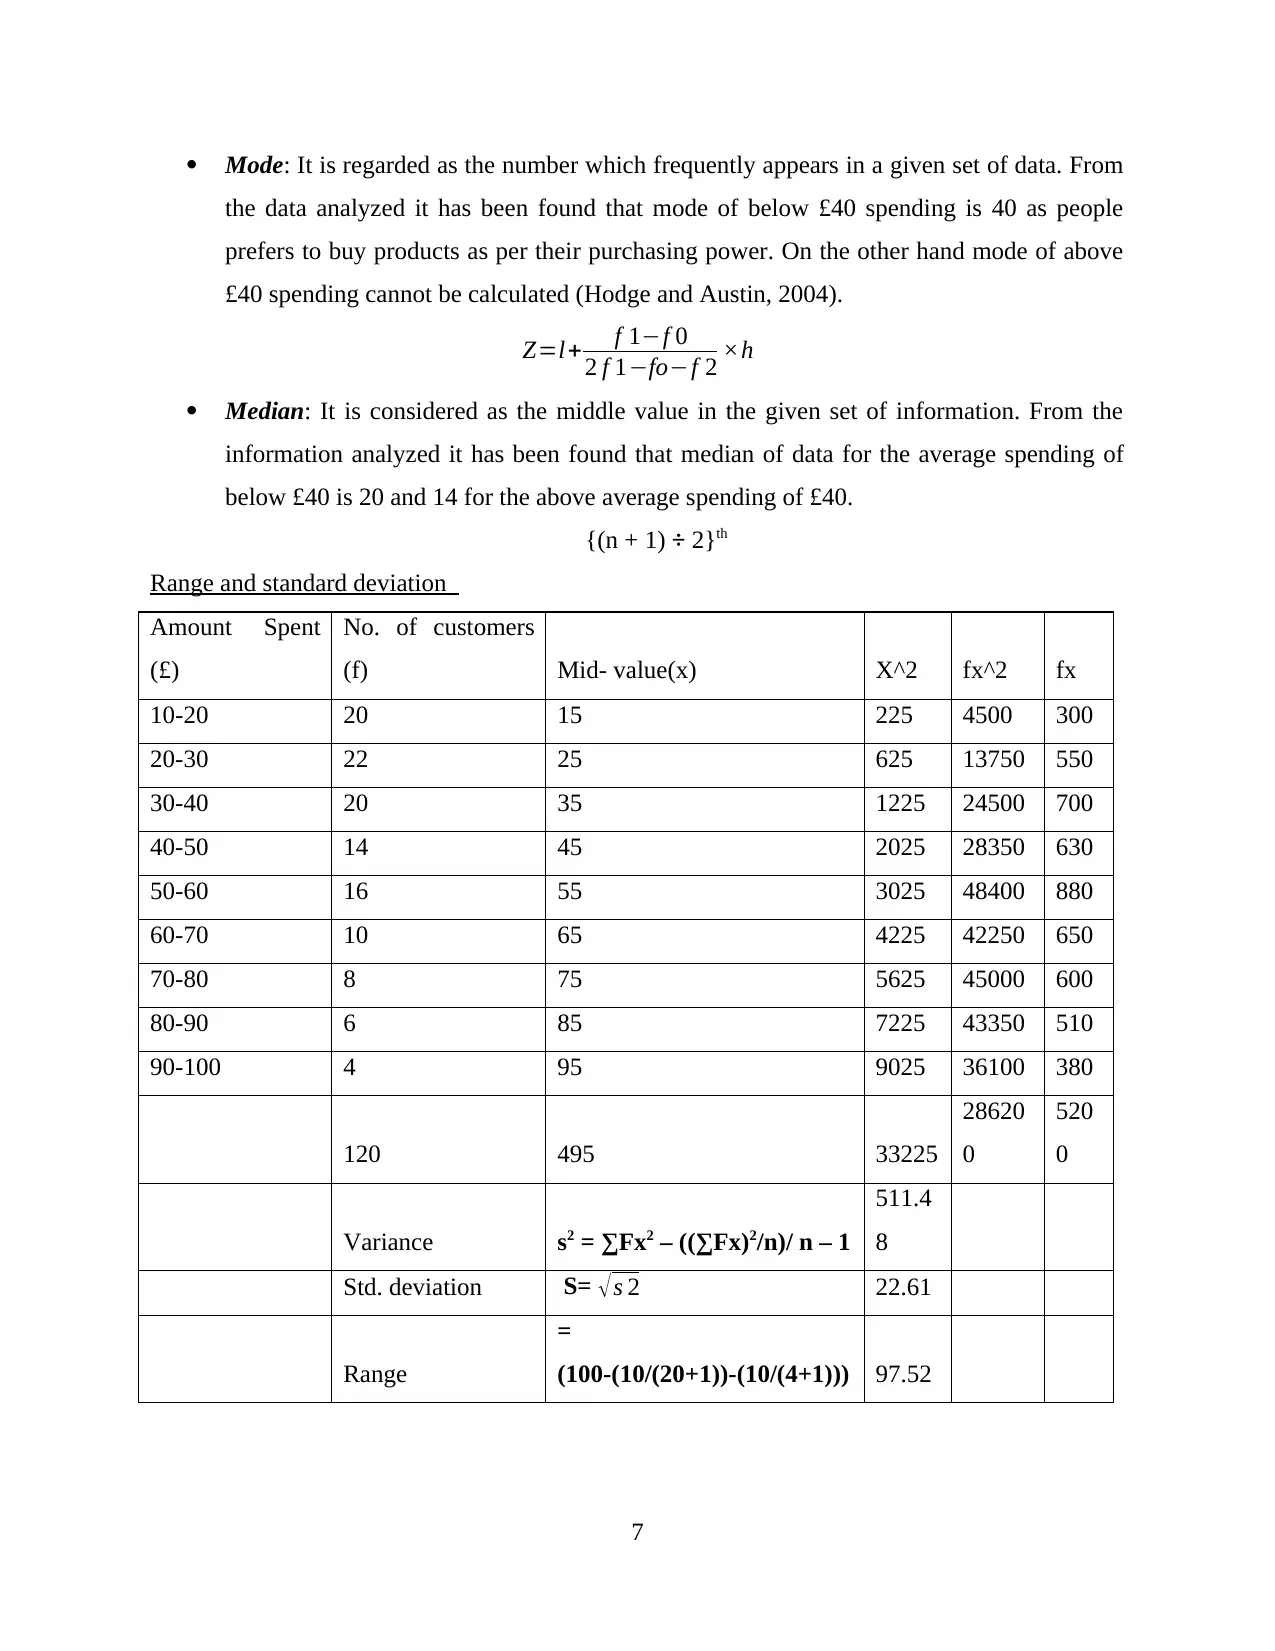
Mode: It is regarded as the number which frequently appears in a given set of data. From
the data analyzed it has been found that mode of below £40 spending is 40 as people
prefers to buy products as per their purchasing power. On the other hand mode of above
£40 spending cannot be calculated (Hodge and Austin, 2004).
Z=l+ f 1−f 0
2 f 1−fo−f 2 ×h
Median: It is considered as the middle value in the given set of information. From the
information analyzed it has been found that median of data for the average spending of
below £40 is 20 and 14 for the above average spending of £40.
{(n + 1) ÷ 2}th
Range and standard deviation
Amount Spent
(£)
No. of customers
(f) Mid- value(x) X^2 fx^2 fx
10-20 20 15 225 4500 300
20-30 22 25 625 13750 550
30-40 20 35 1225 24500 700
40-50 14 45 2025 28350 630
50-60 16 55 3025 48400 880
60-70 10 65 4225 42250 650
70-80 8 75 5625 45000 600
80-90 6 85 7225 43350 510
90-100 4 95 9025 36100 380
120 495 33225
28620
0
520
0
Variance s2 = ∑Fx2 – ((∑Fx)2/n)/ n – 1
511.4
8
Std. deviation S= √s 2 22.61
Range
=
(100-(10/(20+1))-(10/(4+1))) 97.52
7
Paraphrase This Document
Need a fresh take? Get an instant paraphrase of this document with our AI Paraphraser
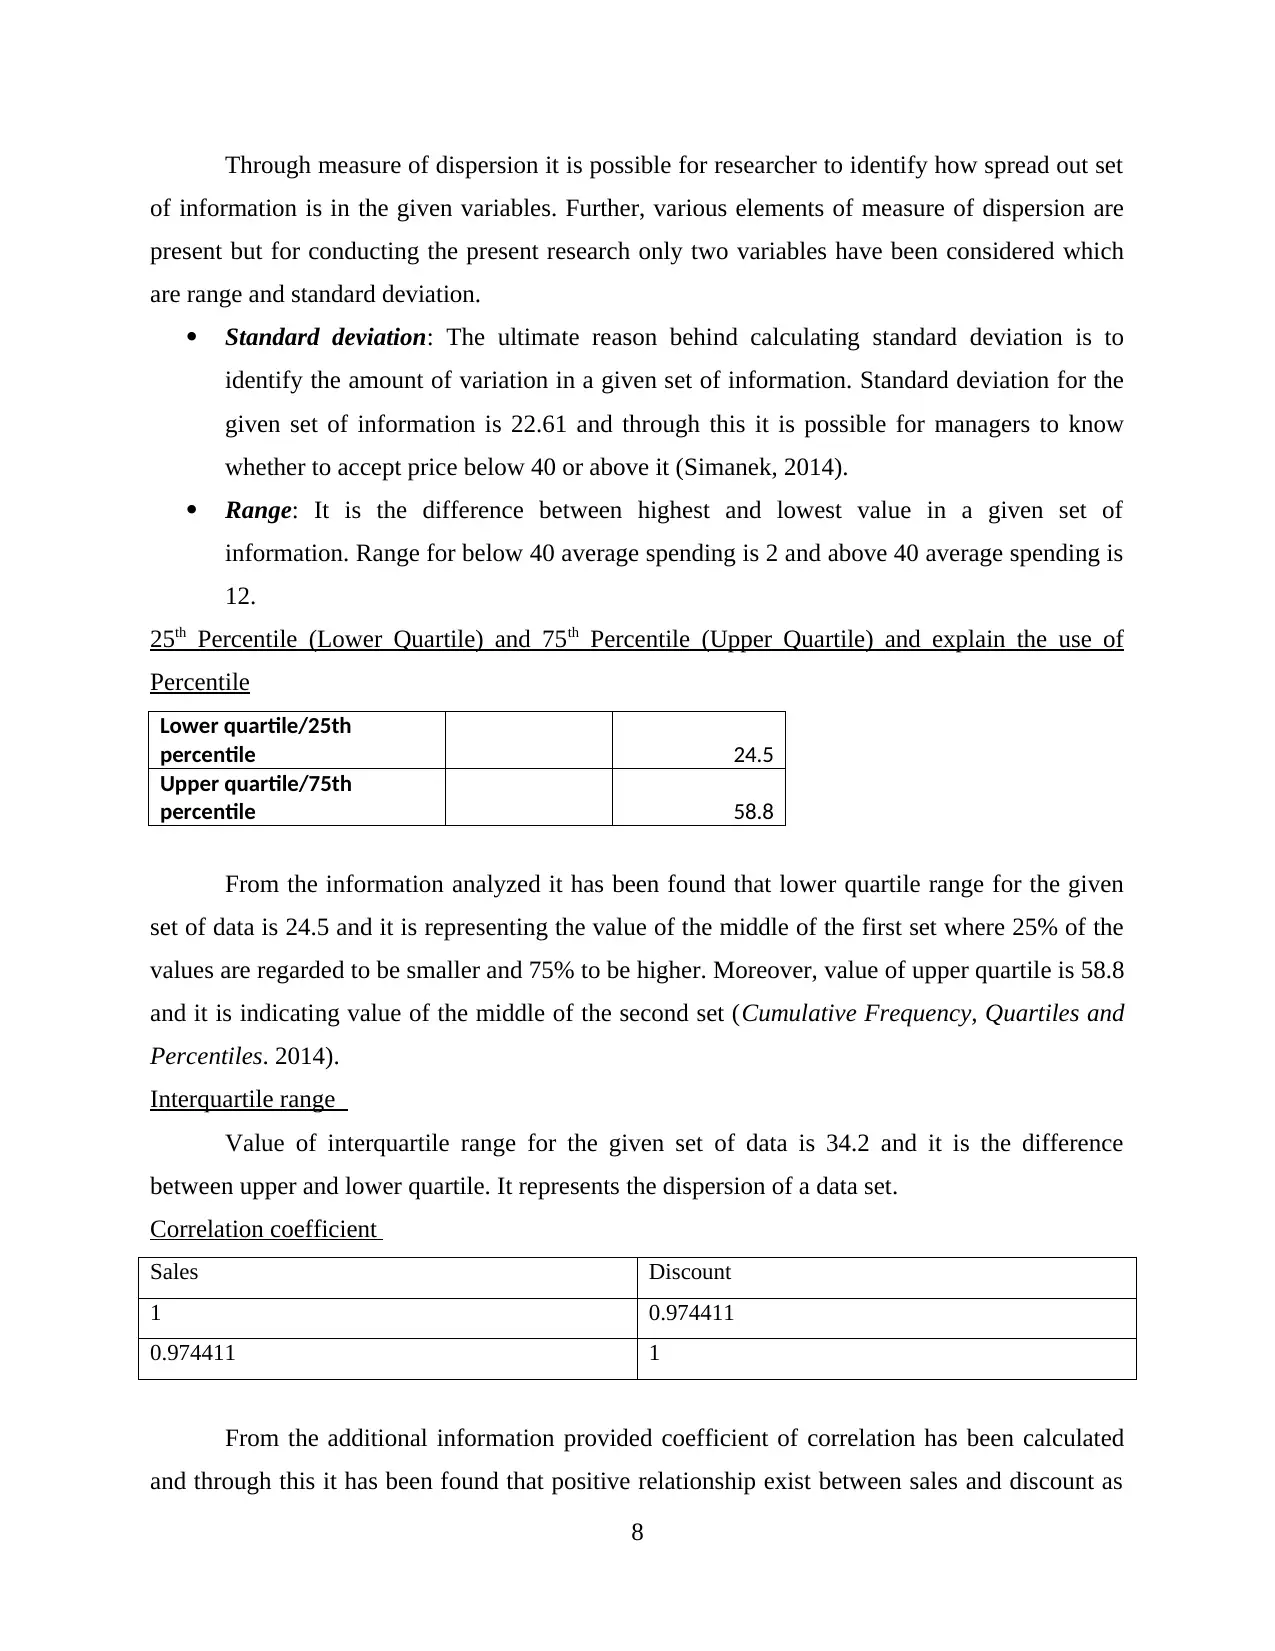
Through measure of dispersion it is possible for researcher to identify how spread out set
of information is in the given variables. Further, various elements of measure of dispersion are
present but for conducting the present research only two variables have been considered which
are range and standard deviation.
Standard deviation: The ultimate reason behind calculating standard deviation is to
identify the amount of variation in a given set of information. Standard deviation for the
given set of information is 22.61 and through this it is possible for managers to know
whether to accept price below 40 or above it (Simanek, 2014).
Range: It is the difference between highest and lowest value in a given set of
information. Range for below 40 average spending is 2 and above 40 average spending is
12.
25th Percentile (Lower Quartile) and 75th Percentile (Upper Quartile) and explain the use of
Percentile
Lower quartile/25th
percentile 24.5
Upper quartile/75th
percentile 58.8
From the information analyzed it has been found that lower quartile range for the given
set of data is 24.5 and it is representing the value of the middle of the first set where 25% of the
values are regarded to be smaller and 75% to be higher. Moreover, value of upper quartile is 58.8
and it is indicating value of the middle of the second set (Cumulative Frequency, Quartiles and
Percentiles. 2014).
Interquartile range
Value of interquartile range for the given set of data is 34.2 and it is the difference
between upper and lower quartile. It represents the dispersion of a data set.
Correlation coefficient
Sales Discount
1 0.974411
0.974411 1
From the additional information provided coefficient of correlation has been calculated
and through this it has been found that positive relationship exist between sales and discount as
8
rise level of discount enhances sales volume of the enterprise and vice versa. Therefore, through
descriptive analysis it is quite clear that in store promotion can be carried out by business and
through this business can easily earn higher profits by enhancing its sales volume (Correlation
coefficient. 2015). One of the key advantages of coefficient of correlation to business is that it
supports in understanding the real benefits between two variables and management can easily
analyze its overall performance through which corrective actions can also be taken if business is
not performing as per expected level (Ferrell and Fraedrich, 2014). So, in this way Correlation
coefficient provides advantage to business in every possible manner.
TASK 3
Line graph
2002 2003 2004 2005 2006 2007 2008 2009 2010 2011 2012 2013 2014 2015
0
1000
2000
3000
4000
5000
6000
7000
Line Graph
Advertising Cost £'000s Sales £'000s
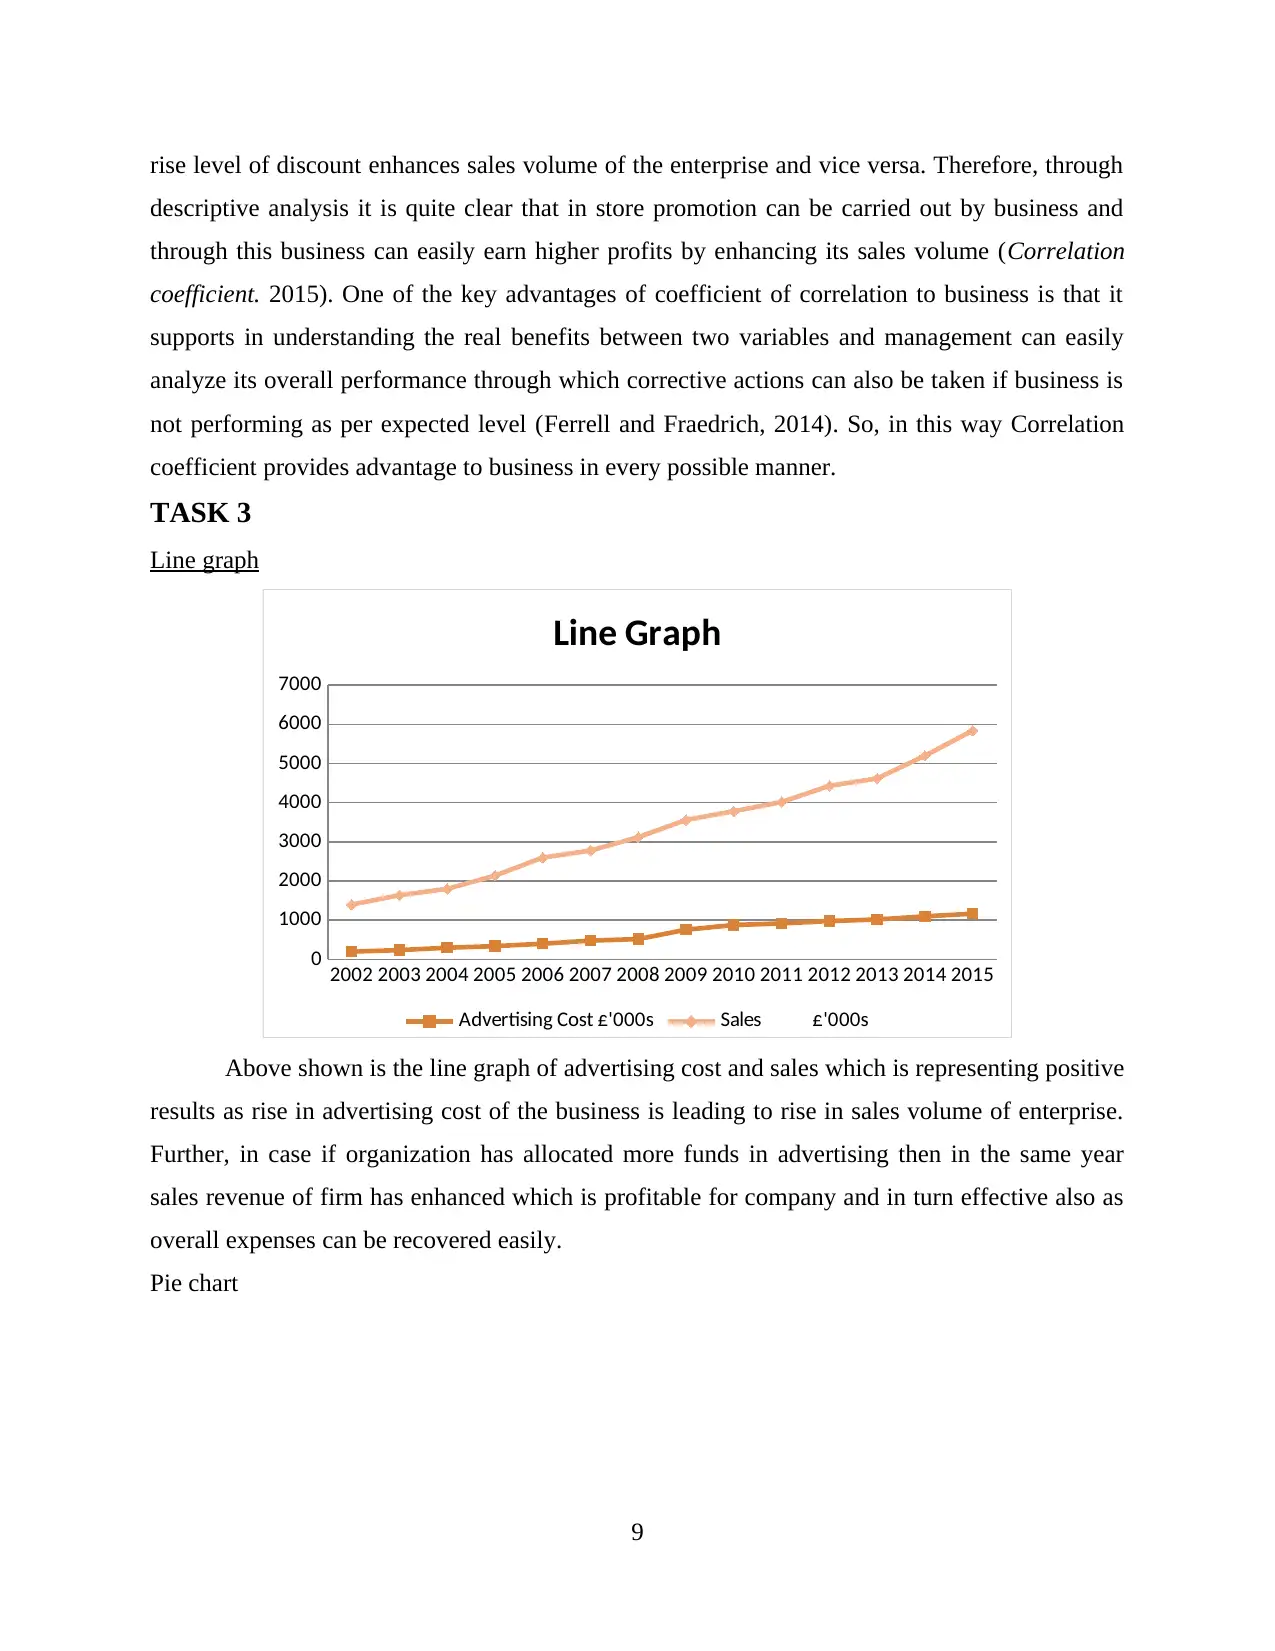
Above shown is the line graph of advertising cost and sales which is representing positive
results as rise in advertising cost of the business is leading to rise in sales volume of enterprise.
Further, in case if organization has allocated more funds in advertising then in the same year
sales revenue of firm has enhanced which is profitable for company and in turn effective also as
overall expenses can be recovered easily.
Pie chart
9
descriptive analysis it is quite clear that in store promotion can be carried out by business and
through this business can easily earn higher profits by enhancing its sales volume (Correlation
coefficient. 2015). One of the key advantages of coefficient of correlation to business is that it
supports in understanding the real benefits between two variables and management can easily
analyze its overall performance through which corrective actions can also be taken if business is
not performing as per expected level (Ferrell and Fraedrich, 2014). So, in this way Correlation
coefficient provides advantage to business in every possible manner.
TASK 3
Line graph
2002 2003 2004 2005 2006 2007 2008 2009 2010 2011 2012 2013 2014 2015
0
1000
2000
3000
4000
5000
6000
7000
Line Graph
Advertising Cost £'000s Sales £'000s
Above shown is the line graph of advertising cost and sales which is representing positive
results as rise in advertising cost of the business is leading to rise in sales volume of enterprise.
Further, in case if organization has allocated more funds in advertising then in the same year
sales revenue of firm has enhanced which is profitable for company and in turn effective also as
overall expenses can be recovered easily.
Pie chart
9
⊘ This is a preview!⊘
Do you want full access?
Subscribe today to unlock all pages.
Trusted by 1+ million students worldwide
1 out of 23
Related Documents


Your All-in-One AI-Powered Toolkit for Academic Success.
+13062052269
info@desklib.com
Available 24*7 on WhatsApp / Email
![[object Object]](/_next/static/media/star-bottom.7253800d.svg)
Unlock your academic potential
Copyright © 2020–2026 A2Z Services. All Rights Reserved. Developed and managed by ZUCOL.