Business Decision Making Project Report: Data Analysis
VerifiedAdded on 2020/06/03
|19
|4426
|26
Project
AI Summary
This project report focuses on business decision-making processes, using Balti Palace as a case study. The report begins with an introduction to decision-making and its importance, followed by a detailed explanation of data collection methods, including primary and secondary sources, methodologies, and sampling frameworks. The project includes questionnaires and the summarization of raw data collected from research. Furthermore, the report delves into data analysis, covering calculations and analysis using mean, median, mode, measures of dispersion, quartiles, percentile, and correlation coefficients. The project also incorporates the use of charts and graphs, trend line graphs, and a formal business report to present findings and recommendations. Finally, the report concludes with a discussion on determining processing tools, critical path analysis, and the financial tools used to make informed business decisions, providing a comprehensive overview of the decision-making process within the context of the Balti Palace restaurant.
BUSINESS DECISION
MAKING
MAKING
Paraphrase This Document
Need a fresh take? Get an instant paraphrase of this document with our AI Paraphraser
Table of Contents
INTRODUCTION...........................................................................................................................1
TASK 1............................................................................................................................................1
1.1 Different sources of data collection......................................................................................1
1.2 Methodologies and sampling framework..............................................................................2
1.3 Questionnaires from collected data.......................................................................................2
2.1 Summarization of raw data collected from research.............................................................5
2.2 Calculation and analysis through mean, median and mode..................................................6
2.3 Analysis of measure of dispersion.......................................................................................7
2.4 Quartiles, percentile and correlation coefficient in decision making....................................8
TASK 2............................................................................................................................................9
3.1 Charts and graphs from the calculations...............................................................................9
3.2 Trend line graphs ................................................................................................................11
3.3 Covered in PPT...................................................................................................................12
3.4 Formal business report: ......................................................................................................12
TASK 3..........................................................................................................................................13
4.1 Determining Processing tools to present project plan.........................................................13
4.2 Determining critical path.....................................................................................................14
4.3 Financial tools used to make decisions...............................................................................14
CONCLUSION..............................................................................................................................15
REFERENCES..............................................................................................................................16

⊘ This is a preview!⊘
Do you want full access?
Subscribe today to unlock all pages.
Trusted by 1+ million students worldwide
INTRODUCTION
Business decision making is a process resulting in the selection of a belief or a course of
action among various alternative possible. Each decision making produce a complete image of a
company. It involves collection and analysis of data by using several method and all these
aspects will be explained in this project report regarding Balti Palace (Ariely and Berns, 2010).
Better outcomes can only be fulfilled when a systematic way is followed by the organisation in
order to achieve the targeted plan. Business decision are about anything can only be taken when
a detailed research and analysis is made over the person which can be get affected of such steps.
Under this project data is collected though primary and secondary sources. On the basis of
analysis various decision have been taken and recommendation has been made to overcome there
problems.
TASK 1
1.1 Different sources of data collection
In any business organisation there are various data collection methods are used. For the
purpose of decision making it is required that a proper plan is formulated that will be helpful to
balti palace. There are various aspects that are need to taken into account such as size and needs
of the market and for that a complete survey report is being prepared with the help of various
sources (Casadesus-Masanell and Ricart, 2011). The data can be collected from two ways
primary and secondary sources and they are discussed below:
Data collection Plan
It is the process of collection and measuring information on various variables of interest
in establishing individual perceptions that enables researchers to answer asked research
questions, testing hypotheses and analysed outcome. It is collected through interviews, phone
calls and direct observations. There are two sources are primary and secondary.
Secondary data are essential for balti palace. It is collected data by individual other than
researcher who conduct current study. Statistical data of Balti palace are used in research project.
From conducting research it require primary sources that would be conducted through
filling questionnaires. It provide fresh information about ideas and innovation collected from
primary sources. While secondary sources is used to analysed past and current data of Balti
palace through using appropriate graphs and calculation (ChangVan, Witteloostuijn and Eden,
1
Paraphrase This Document
Need a fresh take? Get an instant paraphrase of this document with our AI Paraphraser
2010). The information collected from several aspects of restaurant like satisfaction, attitude and
behaviour of employees toward its customers.
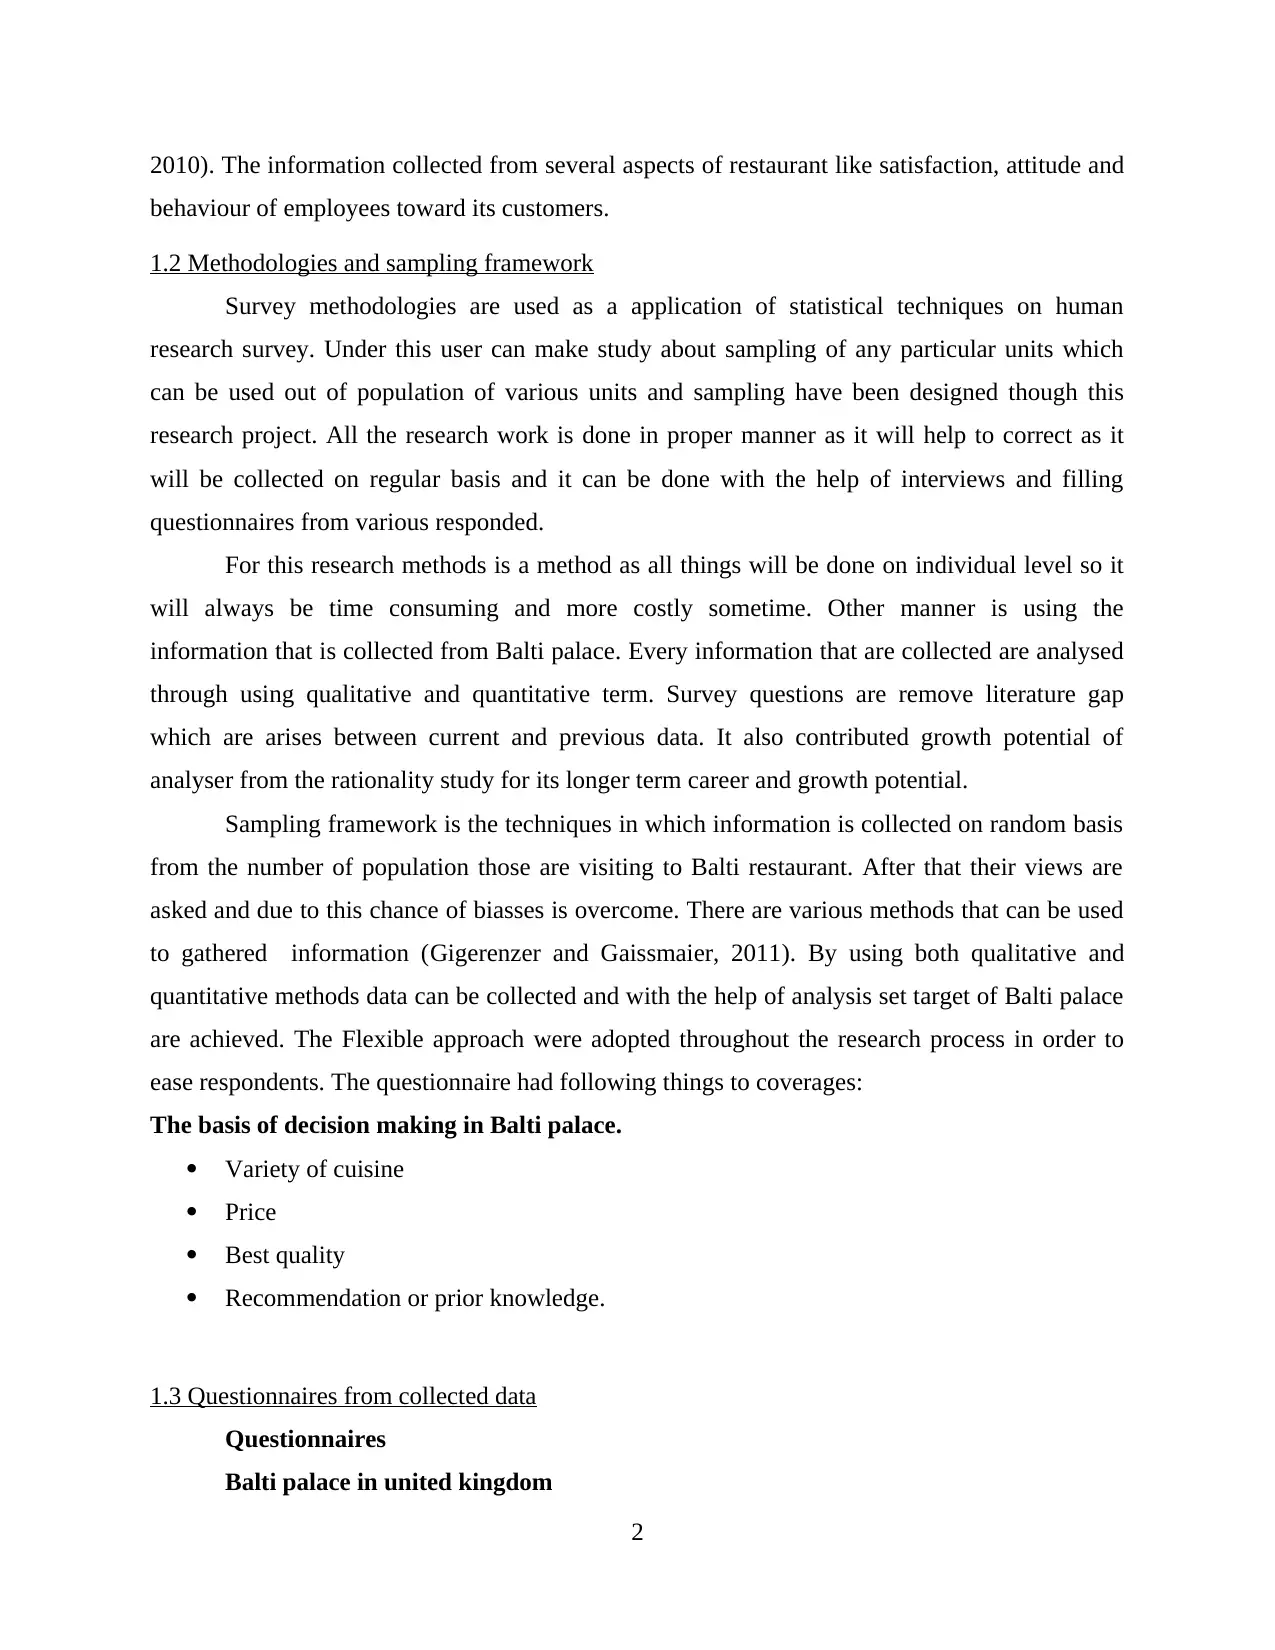
1.2 Methodologies and sampling framework
Survey methodologies are used as a application of statistical techniques on human
research survey. Under this user can make study about sampling of any particular units which
can be used out of population of various units and sampling have been designed though this
research project. All the research work is done in proper manner as it will help to correct as it
will be collected on regular basis and it can be done with the help of interviews and filling
questionnaires from various responded.
For this research methods is a method as all things will be done on individual level so it
will always be time consuming and more costly sometime. Other manner is using the
information that is collected from Balti palace. Every information that are collected are analysed
through using qualitative and quantitative term. Survey questions are remove literature gap
which are arises between current and previous data. It also contributed growth potential of
analyser from the rationality study for its longer term career and growth potential.
Sampling framework is the techniques in which information is collected on random basis
from the number of population those are visiting to Balti restaurant. After that their views are
asked and due to this chance of biasses is overcome. There are various methods that can be used
to gathered information (Gigerenzer and Gaissmaier, 2011). By using both qualitative and
quantitative methods data can be collected and with the help of analysis set target of Balti palace
are achieved. The Flexible approach were adopted throughout the research process in order to
ease respondents. The questionnaire had following things to coverages:
The basis of decision making in Balti palace.
Variety of cuisine
Price
Best quality
Recommendation or prior knowledge.
1.3 Questionnaires from collected data
Questionnaires
Balti palace in united kingdom
2
behaviour of employees toward its customers.
1.2 Methodologies and sampling framework
Survey methodologies are used as a application of statistical techniques on human
research survey. Under this user can make study about sampling of any particular units which
can be used out of population of various units and sampling have been designed though this
research project. All the research work is done in proper manner as it will help to correct as it
will be collected on regular basis and it can be done with the help of interviews and filling
questionnaires from various responded.
For this research methods is a method as all things will be done on individual level so it
will always be time consuming and more costly sometime. Other manner is using the
information that is collected from Balti palace. Every information that are collected are analysed
through using qualitative and quantitative term. Survey questions are remove literature gap
which are arises between current and previous data. It also contributed growth potential of
analyser from the rationality study for its longer term career and growth potential.
Sampling framework is the techniques in which information is collected on random basis
from the number of population those are visiting to Balti restaurant. After that their views are
asked and due to this chance of biasses is overcome. There are various methods that can be used
to gathered information (Gigerenzer and Gaissmaier, 2011). By using both qualitative and
quantitative methods data can be collected and with the help of analysis set target of Balti palace
are achieved. The Flexible approach were adopted throughout the research process in order to
ease respondents. The questionnaire had following things to coverages:
The basis of decision making in Balti palace.
Variety of cuisine
Price
Best quality
Recommendation or prior knowledge.
1.3 Questionnaires from collected data
Questionnaires
Balti palace in united kingdom
2
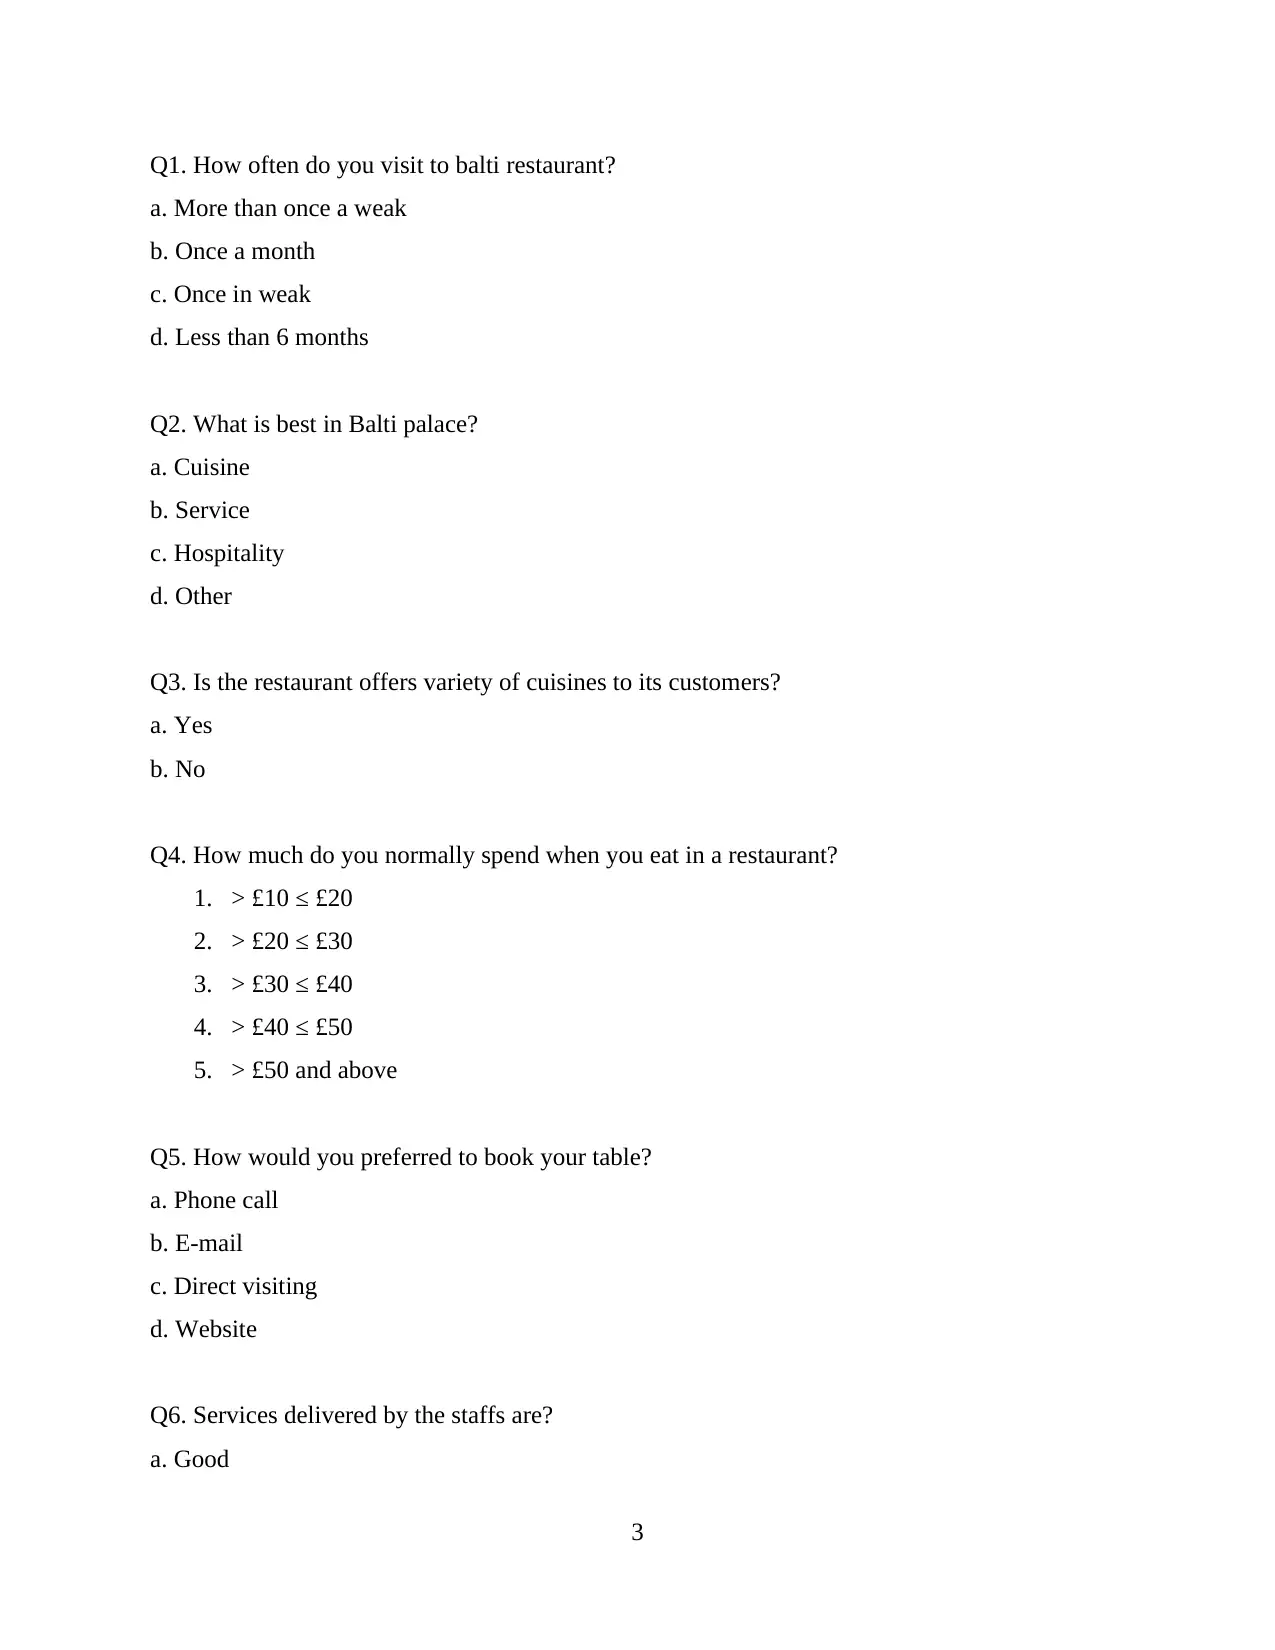
Q1. How often do you visit to balti restaurant?
a. More than once a weak
b. Once a month
c. Once in weak
d. Less than 6 months
Q2. What is best in Balti palace?
a. Cuisine
b. Service
c. Hospitality
d. Other
Q3. Is the restaurant offers variety of cuisines to its customers?
a. Yes
b. No
Q4. How much do you normally spend when you eat in a restaurant?
1. > £10 ≤ £20
2. > £20 ≤ £30
3. > £30 ≤ £40
4. > £40 ≤ £50
5. > £50 and above
Q5. How would you preferred to book your table?
a. Phone call
b. E-mail
c. Direct visiting
d. Website
Q6. Services delivered by the staffs are?
a. Good
3
⊘ This is a preview!⊘
Do you want full access?
Subscribe today to unlock all pages.
Trusted by 1+ million students worldwide
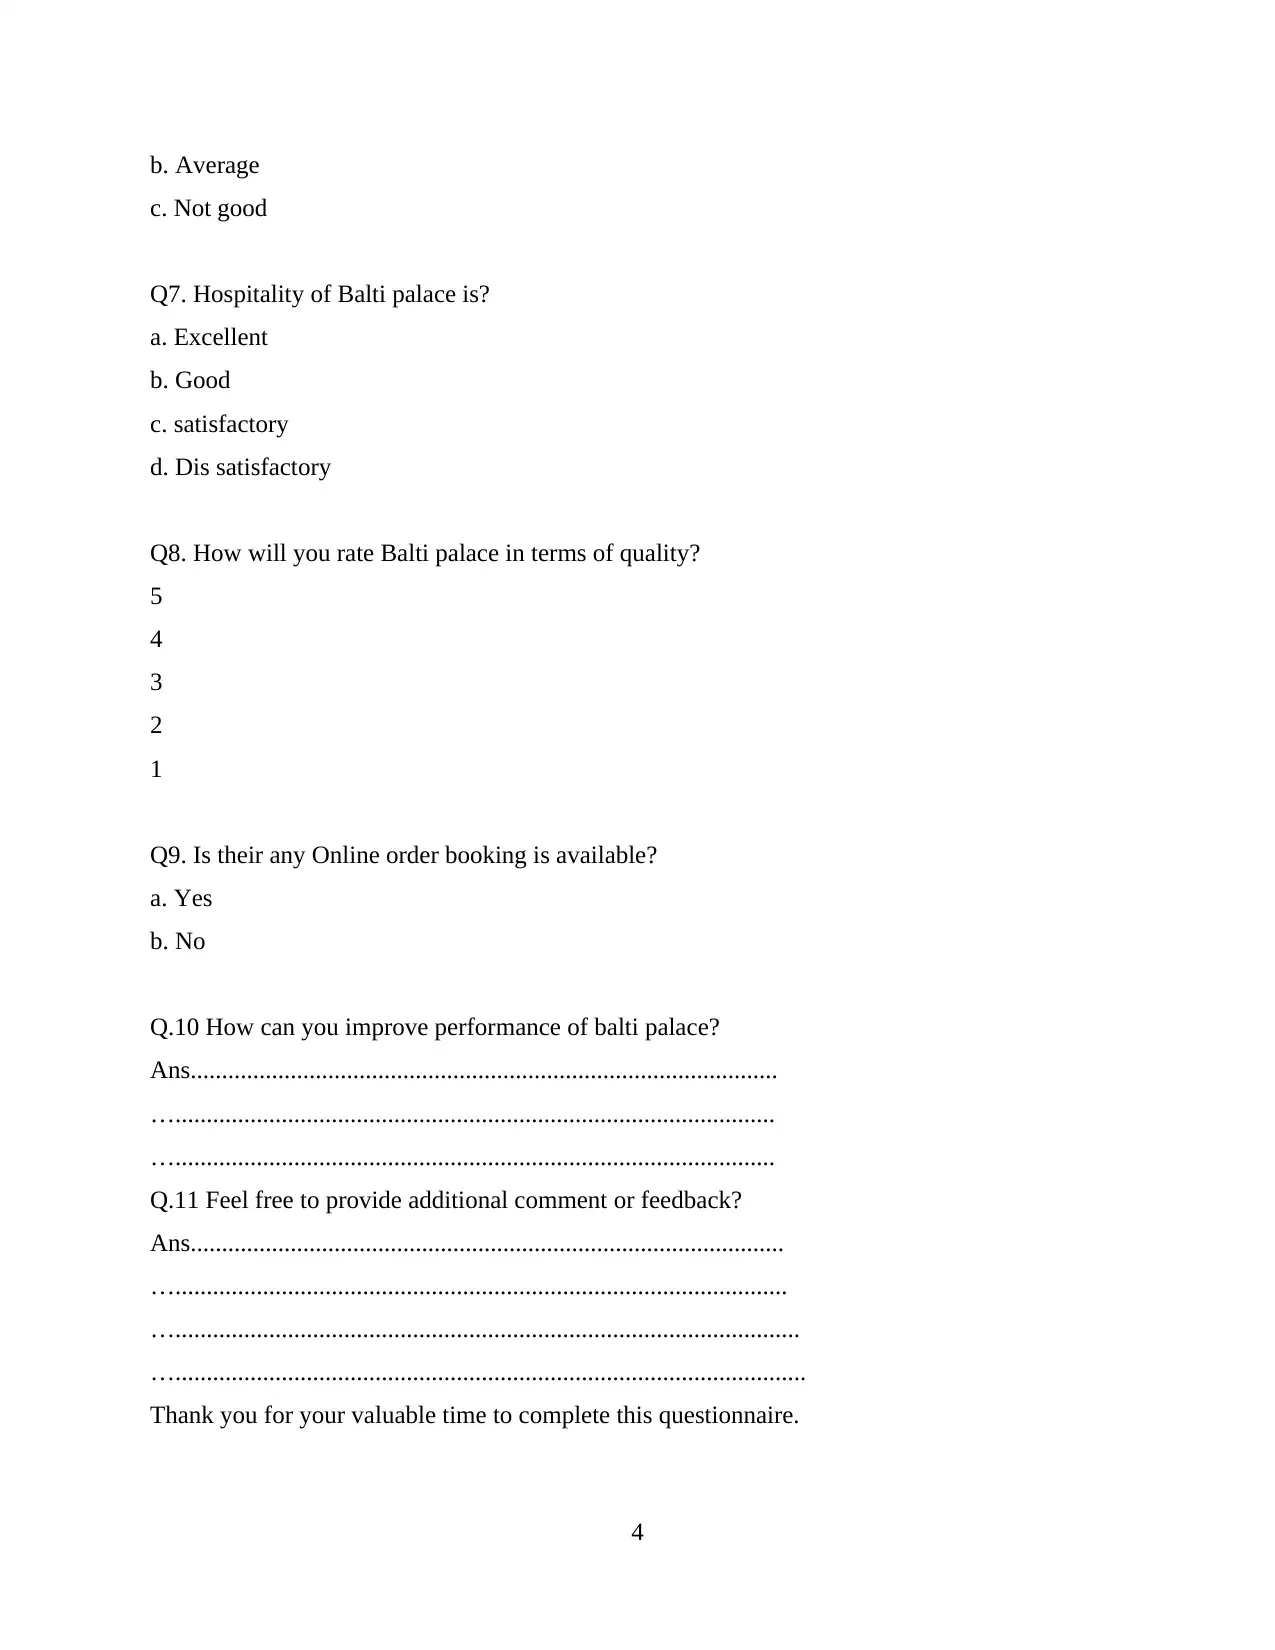
b. Average
c. Not good
Q7. Hospitality of Balti palace is?
a. Excellent
b. Good
c. satisfactory
d. Dis satisfactory
Q8. How will you rate Balti palace in terms of quality?
5
4
3
2
1
Q9. Is their any Online order booking is available?
a. Yes
b. No
Q.10 How can you improve performance of balti palace?
Ans..............................................................................................
…................................................................................................
…................................................................................................
Q.11 Feel free to provide additional comment or feedback?
Ans...............................................................................................
…..................................................................................................
…....................................................................................................
….....................................................................................................
Thank you for your valuable time to complete this questionnaire.
4
Paraphrase This Document
Need a fresh take? Get an instant paraphrase of this document with our AI Paraphraser
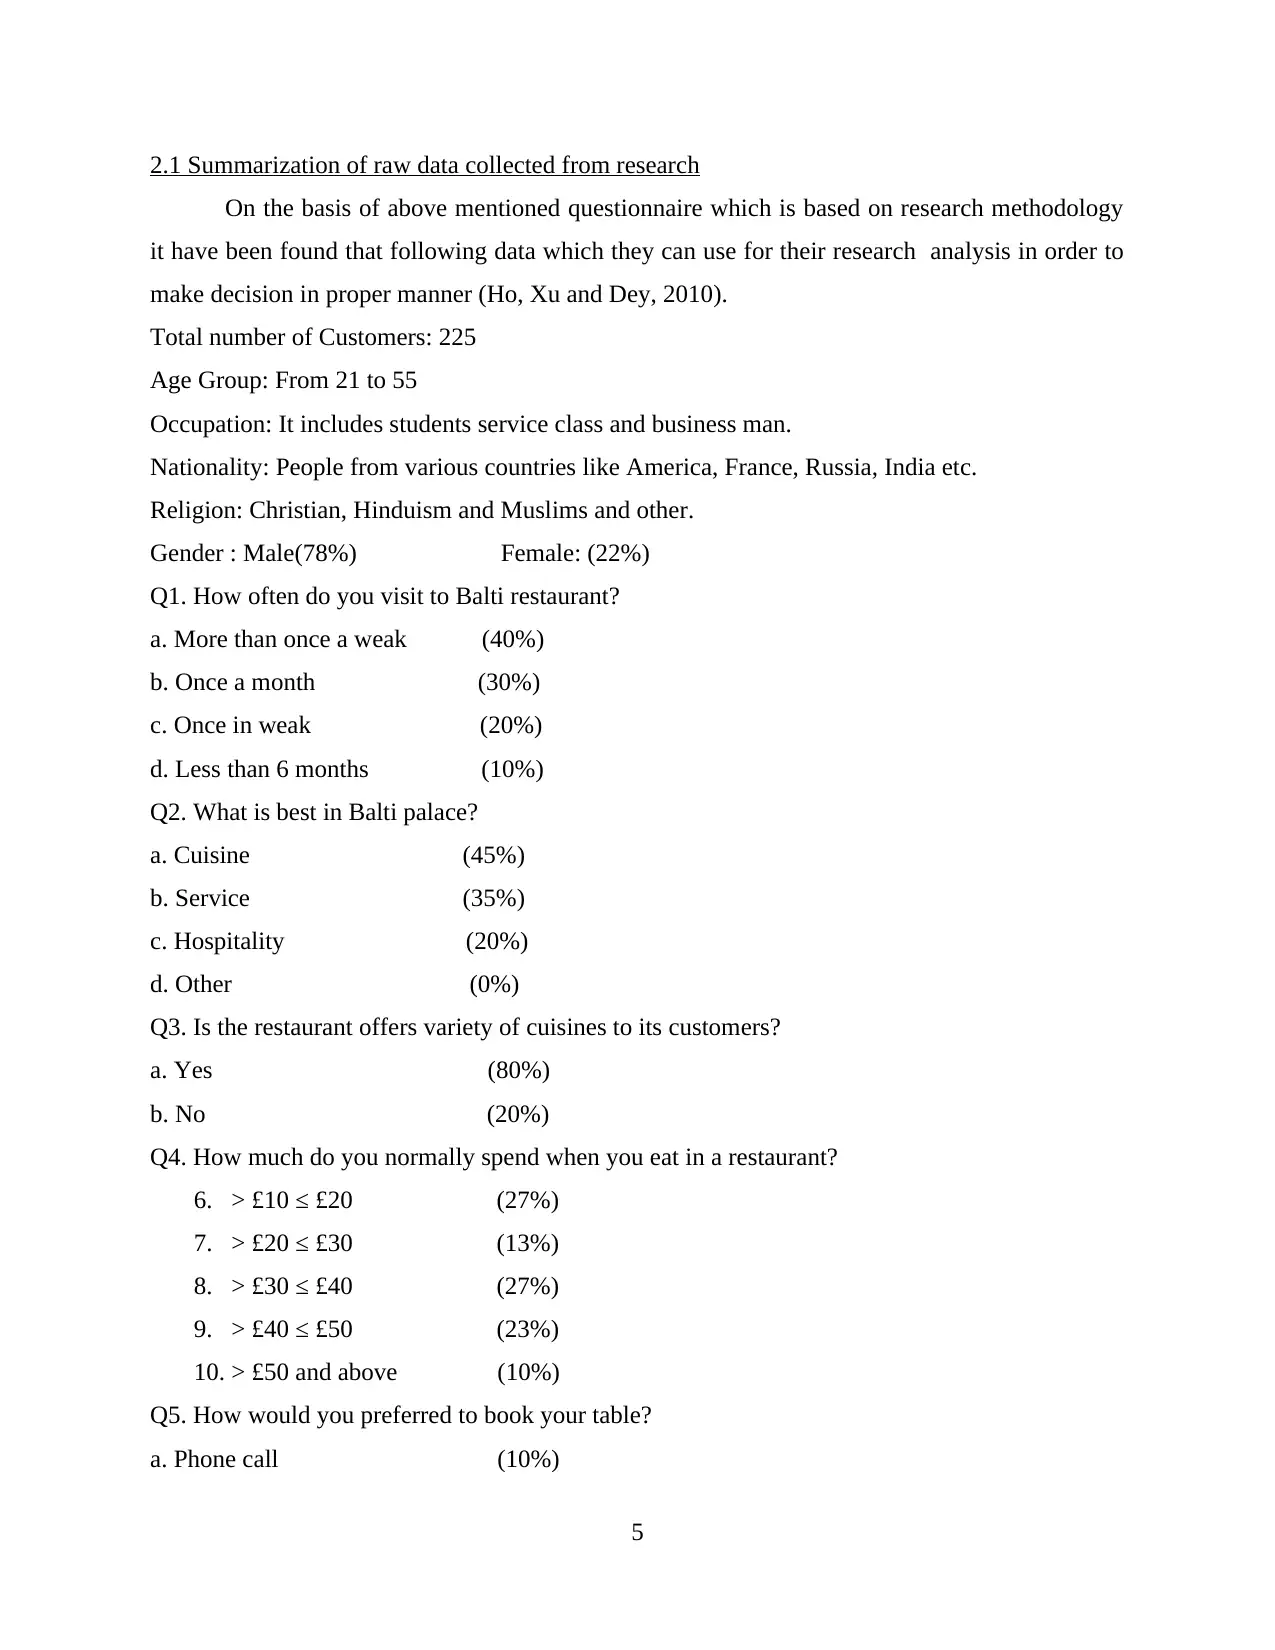
2.1 Summarization of raw data collected from research
On the basis of above mentioned questionnaire which is based on research methodology
it have been found that following data which they can use for their research analysis in order to
make decision in proper manner (Ho, Xu and Dey, 2010).
Total number of Customers: 225
Age Group: From 21 to 55
Occupation: It includes students service class and business man.
Nationality: People from various countries like America, France, Russia, India etc.
Religion: Christian, Hinduism and Muslims and other.
Gender : Male(78%) Female: (22%)
Q1. How often do you visit to Balti restaurant?
a. More than once a weak (40%)
b. Once a month (30%)
c. Once in weak (20%)
d. Less than 6 months (10%)
Q2. What is best in Balti palace?
a. Cuisine (45%)
b. Service (35%)
c. Hospitality (20%)
d. Other (0%)
Q3. Is the restaurant offers variety of cuisines to its customers?
a. Yes (80%)
b. No (20%)
Q4. How much do you normally spend when you eat in a restaurant?
6. > £10 ≤ £20 (27%)
7. > £20 ≤ £30 (13%)
8. > £30 ≤ £40 (27%)
9. > £40 ≤ £50 (23%)
10. > £50 and above (10%)
Q5. How would you preferred to book your table?
a. Phone call (10%)
5
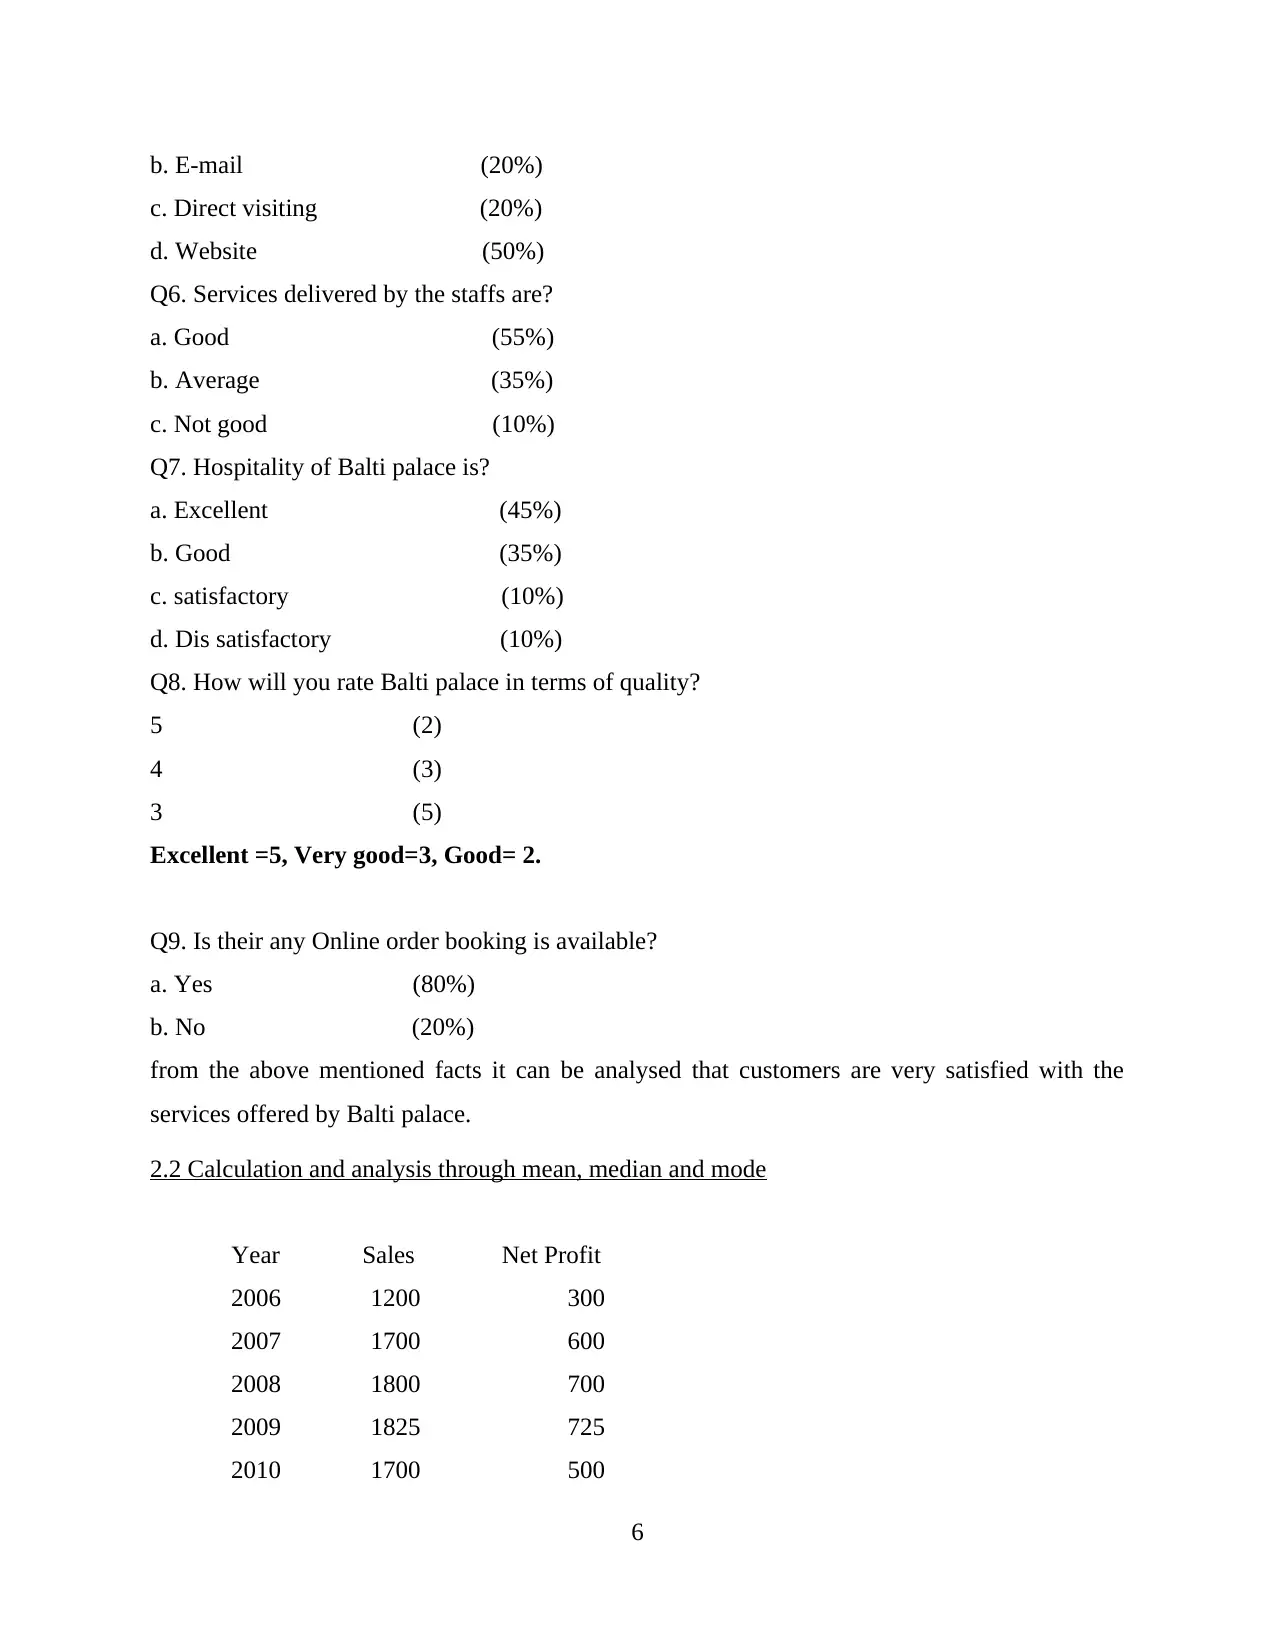
b. E-mail (20%)
c. Direct visiting (20%)
d. Website (50%)
Q6. Services delivered by the staffs are?
a. Good (55%)
b. Average (35%)
c. Not good (10%)
Q7. Hospitality of Balti palace is?
a. Excellent (45%)
b. Good (35%)
c. satisfactory (10%)
d. Dis satisfactory (10%)
Q8. How will you rate Balti palace in terms of quality?
5 (2)
4 (3)
3 (5)
Excellent =5, Very good=3, Good= 2.
Q9. Is their any Online order booking is available?
a. Yes (80%)
b. No (20%)
from the above mentioned facts it can be analysed that customers are very satisfied with the
services offered by Balti palace.
2.2 Calculation and analysis through mean, median and mode
Year Sales Net Profit
2006 1200 300
2007 1700 600
2008 1800 700
2009 1825 725
2010 1700 500
6
⊘ This is a preview!⊘
Do you want full access?
Subscribe today to unlock all pages.
Trusted by 1+ million students worldwide
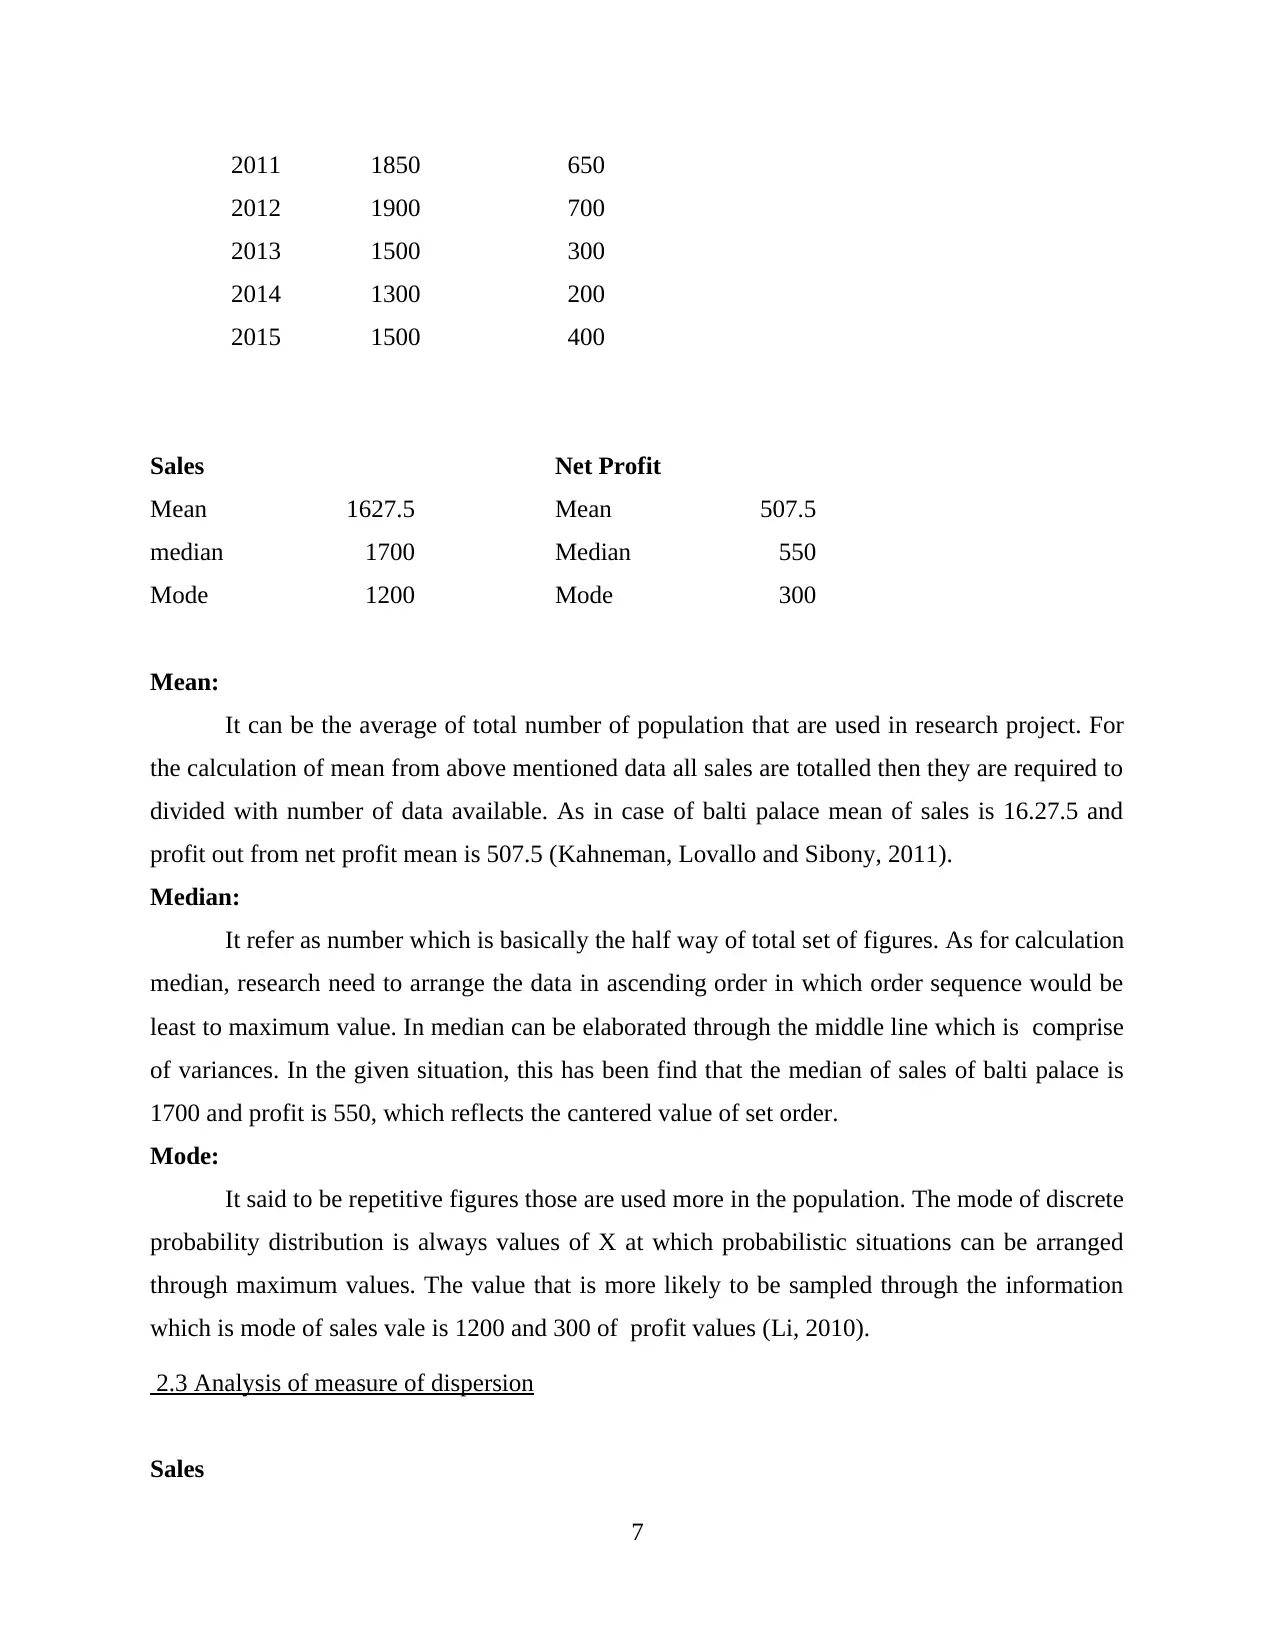
2011 1850 650
2012 1900 700
2013 1500 300
2014 1300 200
2015 1500 400
Sales Net Profit
Mean 1627.5 Mean 507.5
median 1700 Median 550
Mode 1200 Mode 300
Mean:
It can be the average of total number of population that are used in research project. For
the calculation of mean from above mentioned data all sales are totalled then they are required to
divided with number of data available. As in case of balti palace mean of sales is 16.27.5 and
profit out from net profit mean is 507.5 (Kahneman, Lovallo and Sibony, 2011).
Median:
It refer as number which is basically the half way of total set of figures. As for calculation
median, research need to arrange the data in ascending order in which order sequence would be
least to maximum value. In median can be elaborated through the middle line which is comprise
of variances. In the given situation, this has been find that the median of sales of balti palace is
1700 and profit is 550, which reflects the cantered value of set order.
Mode:
It said to be repetitive figures those are used more in the population. The mode of discrete
probability distribution is always values of X at which probabilistic situations can be arranged
through maximum values. The value that is more likely to be sampled through the information
which is mode of sales vale is 1200 and 300 of profit values (Li, 2010).
2.3 Analysis of measure of dispersion
Sales
7
Paraphrase This Document
Need a fresh take? Get an instant paraphrase of this document with our AI Paraphraser
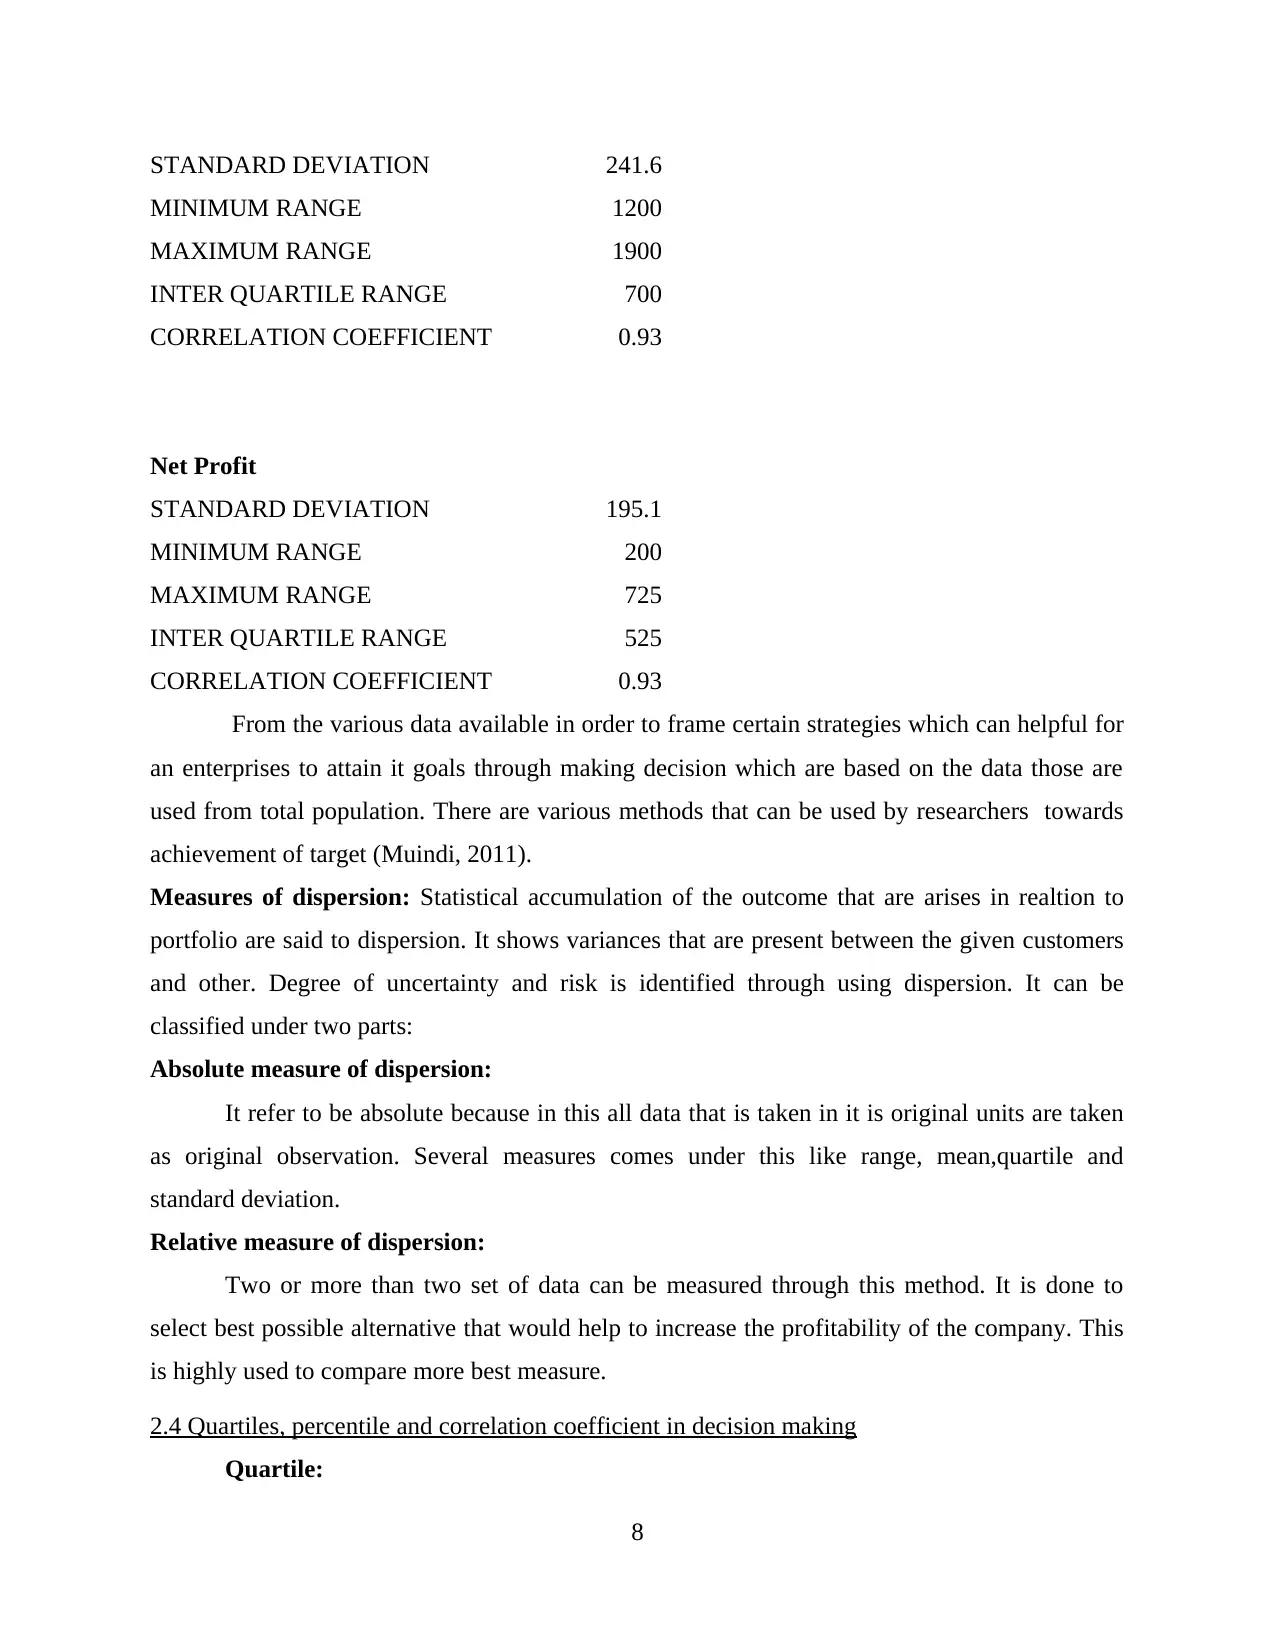
STANDARD DEVIATION 241.6
MINIMUM RANGE 1200
MAXIMUM RANGE 1900
INTER QUARTILE RANGE 700
CORRELATION COEFFICIENT 0.93
Net Profit
STANDARD DEVIATION 195.1
MINIMUM RANGE 200
MAXIMUM RANGE 725
INTER QUARTILE RANGE 525
CORRELATION COEFFICIENT 0.93
From the various data available in order to frame certain strategies which can helpful for
an enterprises to attain it goals through making decision which are based on the data those are
used from total population. There are various methods that can be used by researchers towards
achievement of target (Muindi, 2011).
Measures of dispersion: Statistical accumulation of the outcome that are arises in realtion to
portfolio are said to dispersion. It shows variances that are present between the given customers
and other. Degree of uncertainty and risk is identified through using dispersion. It can be
classified under two parts:
Absolute measure of dispersion:
It refer to be absolute because in this all data that is taken in it is original units are taken
as original observation. Several measures comes under this like range, mean,quartile and
standard deviation.
Relative measure of dispersion:
Two or more than two set of data can be measured through this method. It is done to
select best possible alternative that would help to increase the profitability of the company. This
is highly used to compare more best measure.
2.4 Quartiles, percentile and correlation coefficient in decision making
Quartile:
8
There are different segments and variables that are exist in Balti palace so division of
groups on the basis of that is done. In order to find out deviation between various segments it
will be used. There are various three types of quartile. Such as lower quartile will show 25%
share of component and then next is middle quartile is 50% and higher quartile will represent
75%.
Percentile:
It is a kind of techniques under which various aspects will be calculated with relation to
total numbers. Under this the decision is made on the basis of set criteria, if anything is identified
below it will be rejected or accepted (Nielsen and Nielsen, 2011).
Coefficient correlation represent relation between two or more variable used in research
analysis. It it comes to 1 is means that there is perfect correlation and if there is negative-1 then it
can be negative correlation which is not taken as in research. The ideal situation of variable
would be lies between negative -1 and positive1. According to calculation that has been made it
is suggested to the balti palace to carry on with their new evolution plan. Its mangers can draw a
complete image a systematic decision making process through which they can introduce certain
techniques and strategies.
TASK 2
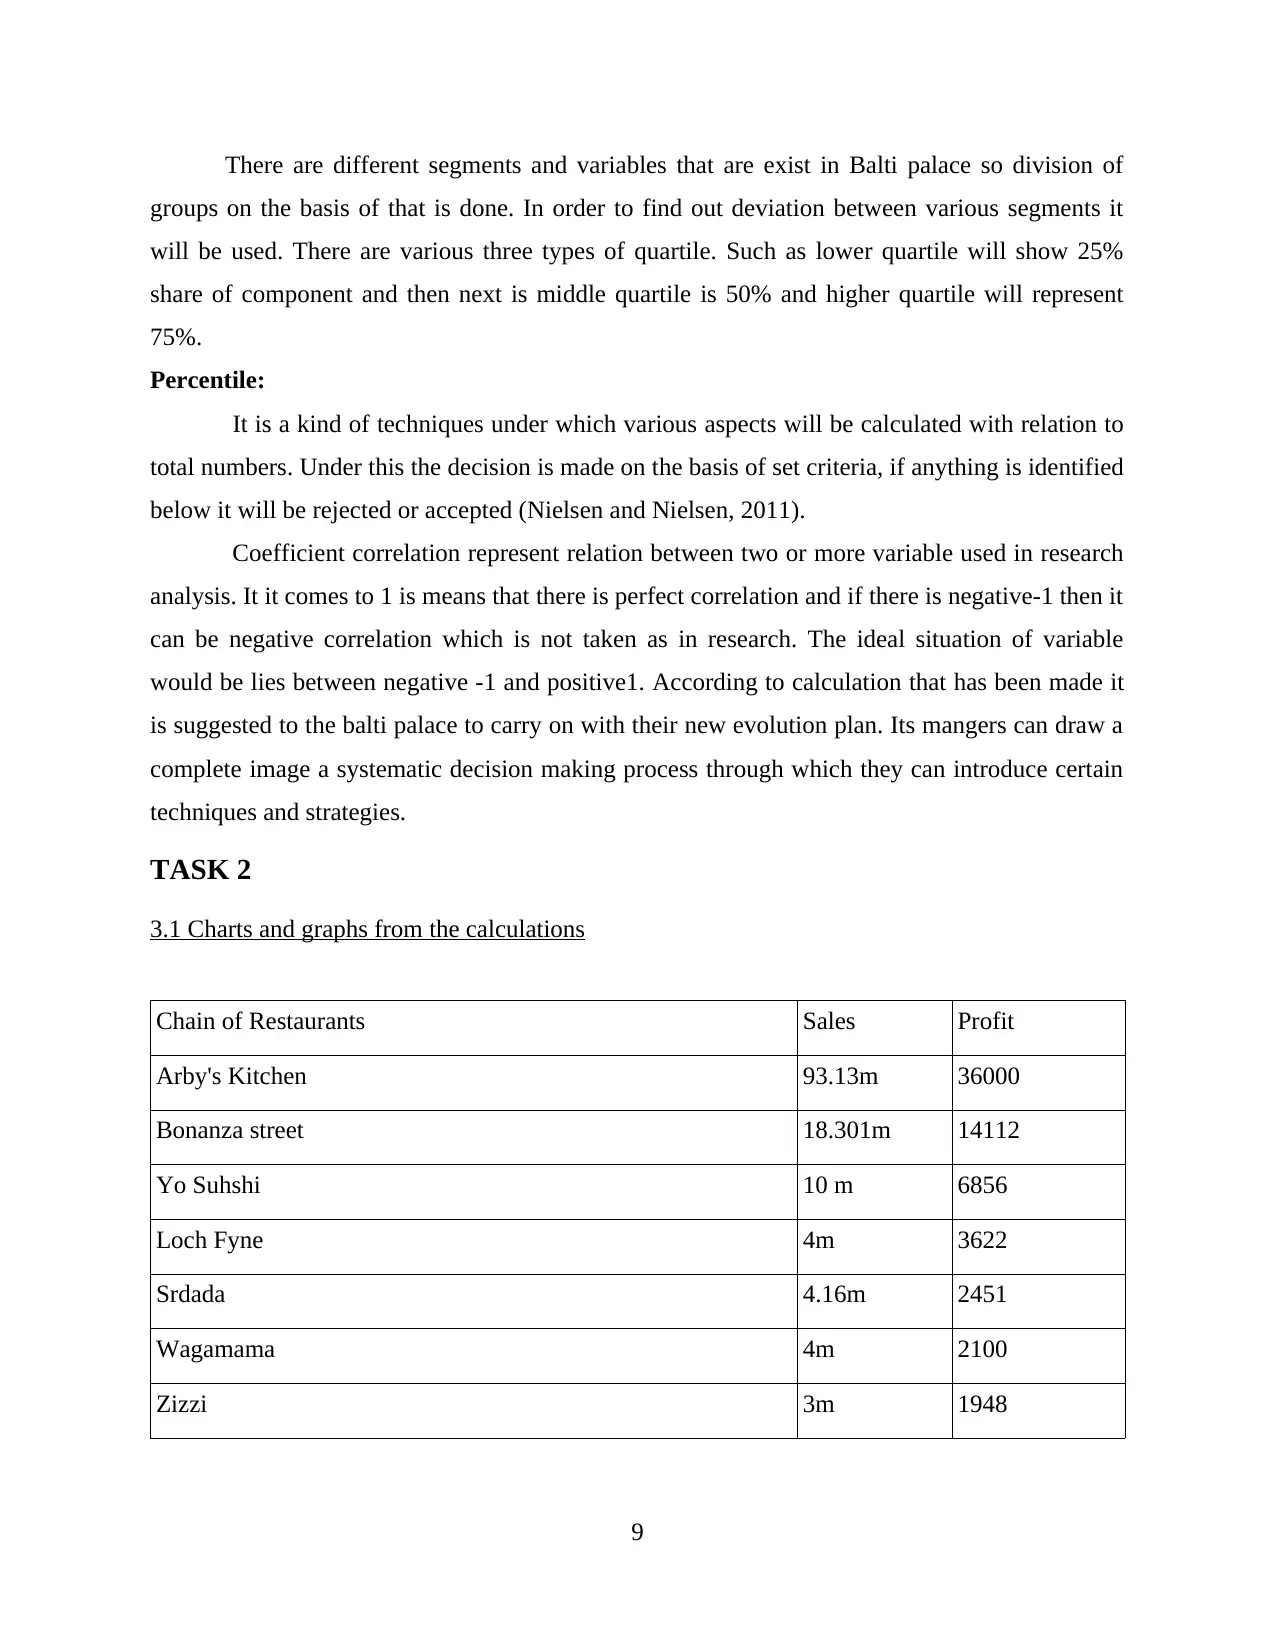
3.1 Charts and graphs from the calculations
Chain of Restaurants Sales Profit
Arby's Kitchen 93.13m 36000
Bonanza street 18.301m 14112
Yo Suhshi 10 m 6856
Loch Fyne 4m 3622
Srdada 4.16m 2451
Wagamama 4m 2100
Zizzi 3m 1948
9
groups on the basis of that is done. In order to find out deviation between various segments it
will be used. There are various three types of quartile. Such as lower quartile will show 25%
share of component and then next is middle quartile is 50% and higher quartile will represent
75%.
Percentile:
It is a kind of techniques under which various aspects will be calculated with relation to
total numbers. Under this the decision is made on the basis of set criteria, if anything is identified
below it will be rejected or accepted (Nielsen and Nielsen, 2011).
Coefficient correlation represent relation between two or more variable used in research
analysis. It it comes to 1 is means that there is perfect correlation and if there is negative-1 then it
can be negative correlation which is not taken as in research. The ideal situation of variable
would be lies between negative -1 and positive1. According to calculation that has been made it
is suggested to the balti palace to carry on with their new evolution plan. Its mangers can draw a
complete image a systematic decision making process through which they can introduce certain
techniques and strategies.
TASK 2
3.1 Charts and graphs from the calculations
Chain of Restaurants Sales Profit
Arby's Kitchen 93.13m 36000
Bonanza street 18.301m 14112
Yo Suhshi 10 m 6856
Loch Fyne 4m 3622
Srdada 4.16m 2451
Wagamama 4m 2100
Zizzi 3m 1948
9
⊘ This is a preview!⊘
Do you want full access?
Subscribe today to unlock all pages.
Trusted by 1+ million students worldwide
1 out of 19
Related Documents


Your All-in-One AI-Powered Toolkit for Academic Success.
+13062052269
info@desklib.com
Available 24*7 on WhatsApp / Email
![[object Object]](/_next/static/media/star-bottom.7253800d.svg)
Unlock your academic potential
Copyright © 2020–2026 A2Z Services. All Rights Reserved. Developed and managed by ZUCOL.